Zahraa Khalid Shuhaib* | Saleh Issa Khassa
© 2024 The authors. This article is published by IIETA and is licensed under the CC BY 4.0 license (http://creativecommons.org/licenses/by/4.0/).
OPEN ACCESS
Permeability one of the most significant parameters influencing reservoir performance is the accessibility that fluids flow through, this study investigates the influence of anisotropic permeability on seepage patterns and slope stability of an earthen dam during rapid and slow drawdown conditions using physical and numerical modeling. Physical modeling using a small-scale dam model and numerical simulations using SEEP/W and SLOPE/W were performed for rapid and slow drawdown scenarios. The present study focuses on the impact of hydraulic anisotropy and soil characteristics on the seepage rate and the stability evaluation of the upstream and downstream slopes for rapidly and slow drawdown scenario during transient flow regime and compared the findings with numerical results. The results show that anisotropic permeability increased seepage rates by over 75% and reduced slope stability by over 55% compared to the isotropic case. The effects were more significant for rapid drawdown conditions. Moreover, effects of hydraulic anisotropic on the physical model's progress to saturation and the period of time needed for reaching saturation (steady state) has been twice as long as it takes an isotropic model to finally reach saturation, this is because a drop in saturated hydraulic conductivity levels causes flow rates to decrease, which in turn causes a gradual development of seepage inside the earth dam. The study demonstrates the importance of incorporating anisotropic permeability for accurate prediction of seepage and slope stability during drawdown.
anisotropic soil, unsaturated soils, rapid drawdown, slow drawdown, slope stability
1.1 Background
From a geotechnical perspective, the seepage analysis is mainly concerned with the slope stability of earth retaining structures, hydraulic systems, etc. Nonetheless, some seepage-related issues, such as capillary siphoning, rainwater infiltration, anisotropy properties of soils and pipe failure in earthen dams, might go unnoticed in general. The detailed stability study of an earthen dam and also its maintenance will certainly be of interest in these circumstances. Sometimes, in order to operate levees and dams, excess amount of water must be rapidly discharged from the reservoir, causing the water level on the upstream slope to suddenly change. Modern engineering professionals refer to this phenomenon as rapid drawdown [1].
The internal pore water pressure and stresses encountered by the slopes are both affected by the reduction in reservoir level. The following two phenomena may generate changes in the pore pressure inside geomaterials: (i) seepage-induced pore pressure resulting from a transient water flow; or (ii) stress-induced excess pore water pressure brought on by the deformation of the geomaterial located in the slope [1, 2]. The development of an imbalanced system is caused by the increase in the destabilizing force as well as the decrease in the hydrostatic pressure acting on the upstream slope. The upstream shell of the dam may consequently fail catastrophically. The slopes settle as a result of the dissipation of this excess pore water pressure over time [1]. According to Duncan [3], the rate of settlement is influenced by the time factor, or dimensionless parameter T. The rate at which water flows, as well as in-situ soil properties like compressibility and hydraulic conductivities, affect this time factor [1, 4].
1.2 Permeability anisotropy
Earlier studies used the assumption that the soil is ideally isotropic and that its permeability is identical in all directions. Yet, a variety of studies have shown that the permeability of the soil varies in different directions and that the soil does not act in an ideal manner [1, 2]. According to Chapuis et al. [5], who investigated the impact of compaction technique on sands' anisotropic permeability, the normal range of anisotropic ratio (kx/ky) values is between 1.5 and 4.0, Additionally, the findings show that no uniformity or segregation within the soil mass, rather than deposition or compaction, is what causes the high apparent anisotropy that is frequently observed in either natural or compacted soils. Similar findings were reached by Clavaud et al. [6] who conducted the anisotropic permeability experiment on porous soils as well as sedimentary rocks utilizing tracers to determine the anisotropic ratios present in the porous structures by using X-ray tomography monitoring while a salty tracer was being displaced, the total permeability tensor for 18 porous rock cores has been identified. Biswas et al. [7] who investigated the earthen dams' drawdown-induced stability under the influence of anisotropic permeability, they discovered that the stability of dams with steep slopes is significantly more affected by anisotropy than that of dams with flat slopes. If the anisotropy of the shell is ignored, the predicted displacement of the upstream shell of a dam with a steep slope (1V:1.5H) may be greatly understated (estimation error of 120% for V=1m/day and ky=kx/4).
Several numerical studies make use of laboratory experimentation-derived permeability values. The media is said to be anisotropic if the probability density distribution is dependent on the angular coordinates [8]. However, previous studies have found that in situ measurements of soil properties offer advantages such as minimal sampling disturbance, preservation of the in situ state of stress, temperature, chemical, and biological environments, and cost effectiveness in comparison to laboratory experiments [9]. Because of this, it makes more sense to determine the soil parameters using various in-situ testing techniques, including the CPT dissipation test. By observing the decline in surplus pore water pressure during the intermission in cone penetration testing, dissipation tests are frequently used in practice to determine the horizontal hydraulic conductivity of soil [10].
1.3 Rapid drawdown modeling
It is probable that a seepage level has stabilized whenever an earth dam has long-term maintained the reservoir with a substantially consistent water surface level. When the reservoir has to be quickly emptied, the weight that fills the reservoir acts like a stabilizing factor beside the upstream side of the dam, allowing the pore-water pressures to the inside the dam to stay relatively high. This is referred to as "rapid drawdown," which may lead to dam instability that affects the upstream face, here are some previous studies of slope stability and seepage under drawdown circumstances. Khattab [11] examined the impact of rapid drawdown for the slope stability of the Mosul dam, which was calculated utilizing the Bishop method with the finite element software GEO-SLOPE OFFICE. The program was carried out with both saturated and non-saturated soil transient seepage throughout three periods (31, 21, and 8 days) of fast water level decline. The main results showed that the 2nd day of an eight-day fast drawdown, which is the most crucial circumstance, is when the stability slope for the lowest safety factor occurs.
Khassaf et al. [12] investigated the effects of rapidly drawdown on the slope stability of the Mandali dam. The Morgenstern-Price method and the finite element computer software SLIDE V.6.0 were used to assess it. The zoned earth dam's safety was determined using the program, along with the possible slip surface during rapid drawdown circumstances for maximum elevation with seismic force impacts. Despite rapidly drawdown circumstances, the stability of the upper slope was found to remain steady. The minimum safety factor value for rapidly drawdown scenarios with a seismic load factor of 0.07g is about 1.254. Fattah et al. [13] analyzed Al-Wand dam as a case study to replicate an earth dam using SEEP/W and SLOPE/W. The software considered boundary conditions, soil qualities that build up the earth dam, and the increase in water before and after the earth dam. While the seepage flow, pore water pressure, and exit gradient were included in the output data. The drawdown condition was tested across three different time frames: 11 days, 3 days, and 1 day. Throughout all drawdown occurrences, the seepage flow and pore water pressure both linearly decreasing with time. The lowest safety factor regarding sliding upstream for each of the three different periods was 1.3, 1.231, and 1.154 since the exit gradient values decreased with time.
Zedan et al. [14] used (SEEP/W & SLOPE/W) for modeling the earth dam and evaluated how rapidly drawdown conditions influenced the stability of the upstream slope of the KHASA-CHAI dam. The reservoir's maximum depth was determined in both of the rapidly drawdown studies (sharp in 20 days and prolonged in 40 days). The minimal safety factor regarding sliding has been larger than (1.0) in both circumstances. The phreatic line shrank at the same location under both rapid and prolonged depletion. The drawdown rate, the angle of the upstream slope, and the hydraulic conductivity of the dam's drops all had an impact on the phreatic line's delay. As drawdown progresses, the earth dam's toe experiences a gradual decrease in the exit gradient as well as water drainage, making it less susceptible to piping and boiling.
In context of the discussions above, it is obvious that most current analyses presumptively assume that permeability is constant in all directions. Porous media are definitely anisotropic, though, as is shown from the above. Thus, it is postulated that the soil's anisotropy plays a substantial role in the dissipation of excess pore pressure and, in turn, in the collapse of the upstream shell during drawdowns. The main objective of this study is to investigate how anisotropic permeability influence seepage patterns and drawdown-related slope stability problems using physical and numerical modeling. The study incorporated anisotropic permeability ratios within the typical range for earthen materials to develop a more realistic model.
1.4 Flow through anisotropic material
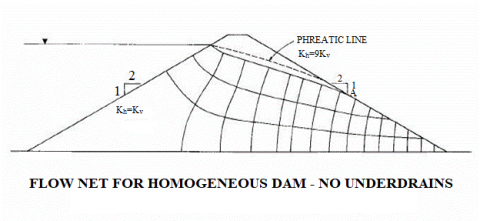
The assumption that the flow region is isotropic, or that the permeability is equal in all directions, has been adopted in the most of previous studies on seepage. Vertical and horizontal permeability are frequently not identical in strata that are naturally occurring along with in earth dams. Only isotropic materials are affected by the Laplace equation, which is depicted by Eq. (1) and where the flow net gives a graphical solution. This implies that flow nets comparable to those seen in Figure 1 cannot be drawn in anisotropic materials.
$\frac{\partial^2 h}{\partial x^2}+\frac{\partial^2 h}{\partial y^2}=0$ (1)
Figure 1. Flow net in homogenous earth dams [14]
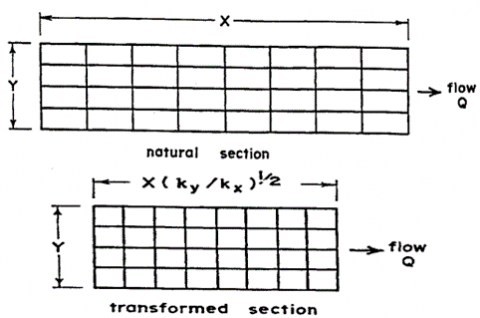
This indicates that an isotropic zone is obtained when the x dimensions being transformed to X in accordance with Eq. (2), so that the flow net could be drawn. The y dimensions being maintained constant while the x dimensions are changed. Instead, the transformation may happen in the y direction, which would keep the x dimensions constant.
$X=x\left(k_y / k_x\right)^{1 / 2}$ (2)
Figure 2 depicts this transformational process. In this instance, permeability kx exceeds permeability ky. This indicates that in the x direction, the converted section has been smaller than the natural section. In the isotropic transformed portion of the figure, the flow net for one-dimensional flow from left to right has been drawn. The flow lines and equipotential lines in this flow net have been created in a square design. The square pattern is disrupted when the flow net is returned to the natural section, and the forms have changed to rectangular ones.
Figure 2. Transformation for anisotropic conditions [15]
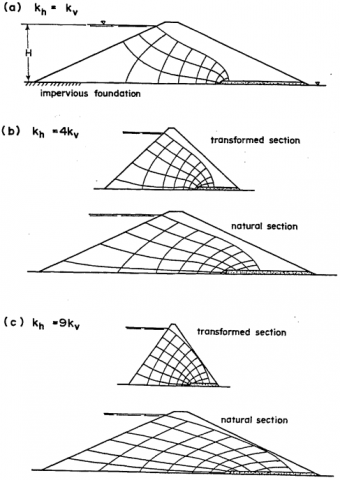
Figure 3. Effect of anisotropy on seepage through an earth dam [15]
Figure 3 depicts how anisotropy affects the seepage flow via the earth dam section. This figure indicates that the flow net gets more deformed when it is redrawn on the natural dam section the higher the degree of anisotropy, or the larger the value of a ratio of the horizontal to vertical permeability. The figure also shows that the line of seepage gets closer to the downstream slop of the dam as the degree of anisotropy increases [15].
Seepage and slope stability investigations were performed using the two-dimensional computer programs SEEP/W and SLOPE/W. This program can effectively assess both basic and complicated issues concurrently with relation to a variety of slip surface geometries, pore-water pressure, soil properties, and loading circumstances under rapid and slow draw down conditions. The analysis has been carried out using the subsequent techniques: (1) Comparing the results after evaluating the physical models; (2) To estimate the seepage and factor of safety throughout the configurations via numerical models, but with prototype properties and dimensions.
2.1 Steady state analysis
The permeability of the soil materials is the only factor that affects the steady state seepage analysis. The first study that quantitatively represented fluid flow through a porous media was published in 1856 by Henri Darcy. The flow of water past vertical filters in laboratory setups served as the basis for Darcy's formula, generally known as Darcy's law [16]. He was able to establish a clear relationship between hydraulic gradient with discharge velocity through a variety of investigations, which he characterized as follows:
$Q=k . i . A$ (3)
where, k: the hydraulic conductivity (LT-1), A: cross sectional area a normal to the direction of flow (L2), Q: the discharge rate (L3T-1), i: the hydraulic gradient (L/L).
It might not be exactly evident which value of the permeability must be used for k in Eq. (3) given the existence of two permeabilities (kx and ky). The following formula may be used to determine the permeability value that will be utilized in conjunction with the converted section to determine the rate of seepage flow [15]:
From the natural section (anisotropic):
$Q=k_x \frac{\partial h}{\partial x} y$ (4)
From the transformed section (isotropic):
$Q=k \frac{\partial h}{\partial x} y\,\,per\,\, unit\,\, width$ (5)
where, k is the permeability coefficient to be applied to the transformed section:
These two values of Q (calculated from the natural and transformed sections) must be equal.
$k_x \frac{\partial h}{\partial x} y=k \frac{\partial h}{\partial x}\left(\frac{k_x}{k_y}\right)^{1 / 2} y$ (6)
$\therefore k=\left(k_x k_v\right)^{1 / 2}$ (7)
2.2 Transient seepage analysis
The transient state condition varies with time and degree of soil saturation. It is also necessary to define an initial condition in addition to boundary conditions.
The limit equilibrium technique recommended by Morgenstern-Price (1965) has been used in the study. Despite being a challenging process, this approach is more current, safer, and more accurate than any one of the other methods in the program [17]. Additionally, the MPM assumes the interslice force functionality and meets the force as well as moment equilibriums.
The GeoStudio program is a numerical model that utilizes the finite element method. It is possible to mimic mathematically how water behaves physically when it passes through a particle of substance. The basic flow laws for transient as well as steady-state flow are covered in the software, along with examples of how these laws are expressed numerically. The mathematical formulae used in SEEP/W include Darcy's law, the partial differential flow of water equations, the finite element flow of water equations, temporal integrating, integrals, permeability matrix, mass matrix, flux boundary vector, and density-dependent flow. In this study, the phreatic line was traced through the physical model of earth dam to calculate the quantity of seepage through the anisotropic model and cheek the stability during rapid draw down using the GeoStudio program. The boundary condition used for the seepage analysis changes in head values over time for transient analysis purposes. The water level drops from 0.6 m to zero over a period of 30 minutes in order to simulate a rapid depletion of the upstream reservoir. Table 1 in which the time is exponentially expanded with a (36 sec) initial increment size, displays the time information for the ten phreatic lines of the numerical models. The fundamental components of numerical modeling using Seep/W and SLOPE/W are as follows:
1. The geometry of the dam, which includes its size, cross-section, location, and filter's dimensions, is one of the key basic elements of Seep/W of numerical modeling.
2. The properties of the material (permeability, pore water pressure, as well as water content).
3. The water levels at the boundary (U/S and D/S).
4. Discretization of the models.
5. The type of flow.
The following describes the steady state and transient seepage boundary condition:
a. Constant head of 0.6 m at upstream slope.
b. the downstream slope's constant head has been maintained as a zero seepage line.
c. For considering an impervious foundation, there is no discharge below the base.
d. The water level on the upstream slope drawdown over time through half hour for transition seepage condition.
Table 1. The time of phreatic lines from top to bottom
|
Phreatic Line Sequence |
Increment (sec) |
Elapsed |
|
1 |
36 |
36 sec |
|
2 |
54 |
54 sec |
|
3 |
78 |
78 sec |
|
4 |
115 |
115 sec |
|
5 |
170 |
170 sec |
|
6 |
250 |
250 sec |
|
7 |
370 |
370 sec |
|
8 |
544 |
544 sec |
|
9 |
802 |
802 sec |
|
10 |
1181 |
1181 sec |
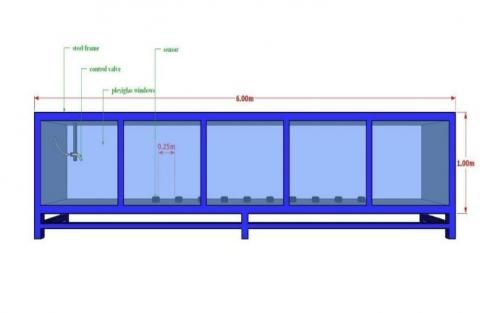
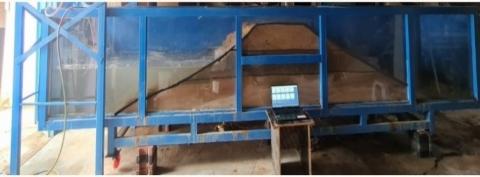
A laboratory channel model setup has been designed. It is made up of a number of major and minor components that work together to fulfill the device's intended function while adhering to the rules of physical modeling. A 6 m steel frame, sealed tank, slate raft to regulate the water level, plus Plexiglas windows (1.1 by 1 m) having dimensions of 1 m in depth and 0.8 m in width constitute the apparatus' essential components. The cross-section dimensions of the physical models have not been selected at random; all design requirements were taken into account when selecting the final size and material.
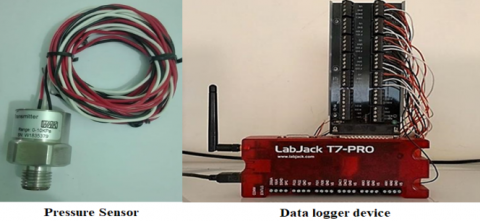
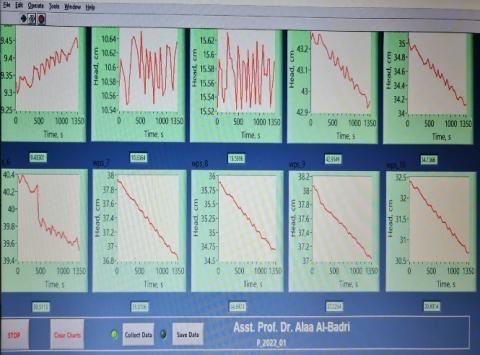
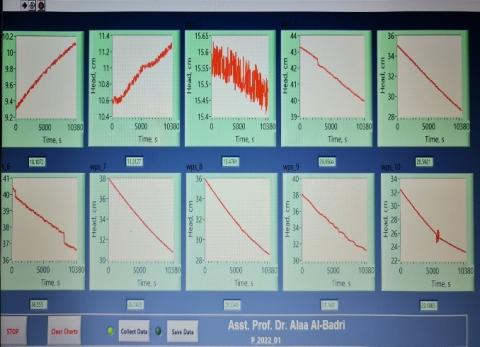
The dam's foundation is designed to be impenetrable, preventing any of seepage beneath the dam's body. The impervious foundation is strong enough to support the total weight of the earthen dam. Ten sensors have been suited to monitor and draw the phreatic line through measuring pore water pressure (the head of the water), it is a sensor created particularly for measuring water pressure by WNK Co., China, out of stainless steel with ceramic material. It has properties that prevent rusting. Model number WNK811, accuracy (0.5-1) %, thread size G1/4, in addition wire length 2 m are the details of these sensors. The measuring range is 10 kPa, and the power supply voltage is 5 V. Each pressure sensor was linked to a Lab Jack T7-PRO data logger, which sends electronic signals to the computer and utilizes Lab View software to extract the sensor readings (voltages). The data logger equipment and sensor are shown in Figure 4. The locations of the sensors are depicted in the schematic design of the mathematical model as illustrated in Figure 5.
Figure 4. The pressure sensor and data logger device
Figure 5. Schematic diagram of the principal components of the experimental flume
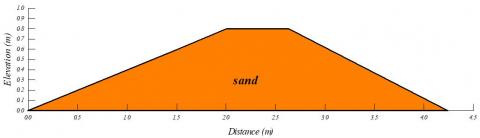
Physical models with slope (2.5:1 at U/S and 2:1 at D/S) has been constructed as a laboratory model with dimensions of 6 m in length and (0.8) m in height and width. The models were developed using ratios and equations that relate the dimensions of the dam to the stress placed on it; as a result, it is a physical model rather than a scale model or simulation of an existing dam. In accordance with the recommendations of Terzaghi and Strange, each requirement has been modified [18, 19], see Figure 6 and Figure 7.
Figure 6. Homogenous isotropy physical model
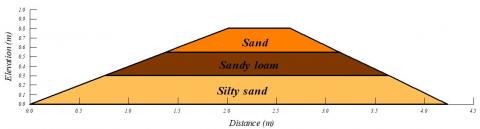
Figure 7. Anisotropy physical model
The first physical model was constructed using sand soil while the second physical model has been made of layers of varied soils which have varying levels of permeability; the first layer was (0.3 m) thick which was silty clay soil, while the latter two levels were both (0.25 m) deep for sand and sandy loam as illustrated in Figure 8 and Figure 9. Compaction is needed during the physical model's construction. The initial layer has been laid down at a thickness of 10 cm to meet the drainage's thickness. The next layers have been applied at every fifteen cm to guarantee efficient compaction.
Figure 8. Homogenous isotropy physical model
Figure 9. Anisotropy physical model
4.1 Hydraulic conductivity (K)
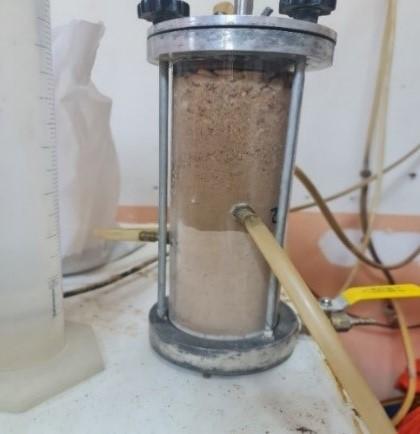
In this experiment, the constant and falling head methods were used to calculate the coefficient of permeability for three different types of soil as illustrated in Figure 10.
The results were confirmed in a lab to establish the samples' K value in line with ASTM D 2434. (3.41×10⁻⁴, 7.66×10⁻⁵, 1.38×10⁻⁷ m/sec) for sand, loamy sand, sandy clay loam respectively. The equation given by Darcy can be used to determine hydraulic conductivity:
$K=\frac{Q L}{h A}$ (8)
where, Q: discharge (ml/s), A: cross-section area of the tube (cm2), k: hydraulic conductivity (cm/s), L: length of sample (cm), h: hydraulic head (cm).
Figure 10. Permeability test for dam materials
4.2 Direct shear test
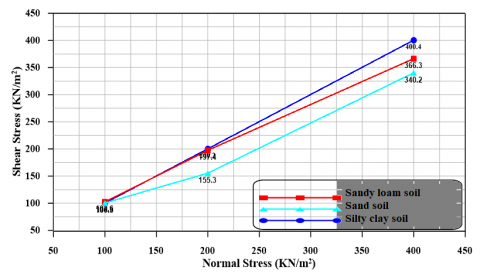
Utilizing a direct soil shear apparatus, the soil's shear force (internal friction angle) was calculated. The highest shear stress with regard to the vertical compressive stresses is shown for each test. By the shear stress plotted against the horizontal displacement, as shown in Figure 11, the optimum shear stress for the given vertical stress is computed. For soil (like sand) with c=0, the failure curve in the diagram can be roughly represented by a straight path (Moore's circle). The shear strength for any vertical force is computed using the following equation:
$\tau=c+\sigma_n \tan \emptyset$ (9)
Figure 11. Shear stresses versus the vertical compressive stresses
4.3 Moisture content test
By taking a sample of the soil and drying it in an electrical oven with 105℃ for 24 hours or until the weight is stabilized, it is possible to directly estimate the amount of moisture in the soil as illustrated in Table 2. This method turns the water that is already in the soil into water vapor that escapes from the sample, making it completely dry and free of all other types of moisture, see Figure 12. To determine the water content of the soil, apply the equation below:
$\theta_m=\frac{ { Mass\,\, of\,\, water }\left(M_w\right)}{ { Dry\,\, mass\,\, of\,\, soil }\left(M_s\right)}$ (10)
Table 2. Moisture content values
|
Details |
Soil No. 1 |
Soil No. 2 |
Soil No. 3 |
|
Can No. |
P1 |
P2 |
P3 |
|
Wt. Wet (soil+ can) g |
99.79 |
92.74 |
99.41 |
|
Wt. Dry (soil+ can) g |
90.26 |
85.56 |
89.46 |
|
Wt. can g |
22.51 |
22.45 |
22.38 |
|
Moisture content % |
14.06 |
11.37 |
14.83 |
Figure 12. Moisture content test
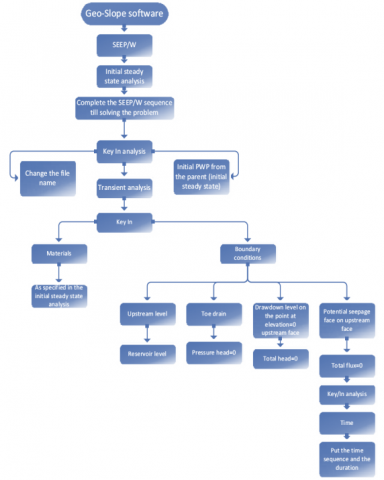
These properties were incorporated into the SEEP/W and SLOPE/W models as a boundary condition to simulate the physical models, as illustrated in Figure 13.
Figure 13. Rapid drawdown flow chart [20]
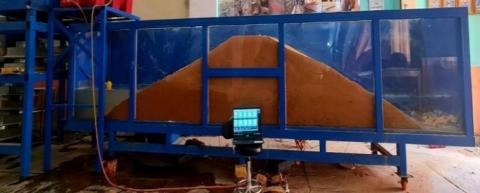
5.1 Physical modeling results
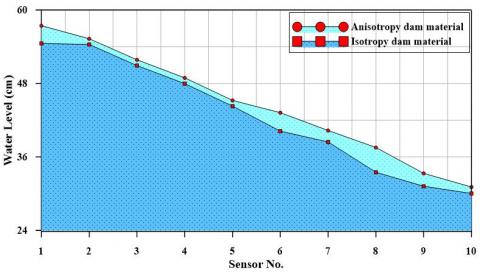
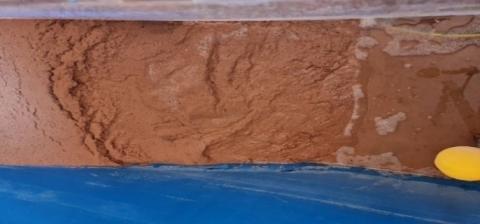
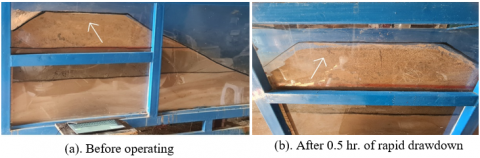
The constructed models described in Section 4 have been used in the tests, physical models saturate lasts 2-5 days and the phreatic line has been drawn depending on the water level in the sensor's indication, the sensors reading for the first model was reached t0 (6500 reading) while for the second reading was reached to (1150 reading) so the second model materials become saturated and seepage is proceeding at a steady rate longer than the isotropy model and seepage line as illustrated in Figure 14. Heterogeneous outcomes from the model no. 2 than the model no. 1 was obtained as we see that the seepage line in the model with anisotropy materials is higher and increased after sensor no. 5 when approaching to the downstream face dam, it has been cut the d/s at the second layer. comparing these findings with the model no. 1 the seepage rate was reaching (2.18×10⁻⁴ m3/sec/m) within 97 hours of the model's steady state condition while with isotropy dam the seepage was (3.91×10⁻⁵), see Table 2. Figure 15 shows how the phreatic line at the u/s and d/s sides gradually lowers when that reservoir level has been drawn down in the physical models after (30 min) for all experiments. As seen in Figure 16, the anisotropy model's u/s side has failed and eroded as a result of the sudden drawdown.
Figure 14. Phreatic line of dam models at water level (0.6m)
Figure 15. The drop of seepage line after rapid drawdown
Figure 16. Upstream slope erosion of anisotropy model dam after sudden draw down
It was observed that all layers underwent soil subsidence of about (1 cm) after rapid drawdown for (0.5 hr.), as shown in Figure 17, the internal pore water pressure and stresses are both affected by the reduction in reservoir level so seepage-induced pore pressure resulting from a transient water flow may generate changes in the pore pressure inside the dam so it causes subsidence of the soil layers.
Figure 17. Anisotropy dam strata experienced soil subsidence
5.2 Numerical modeling results
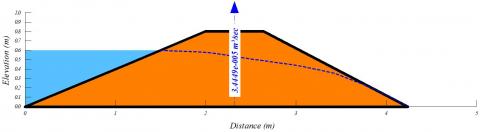
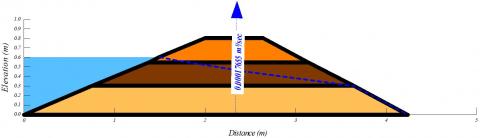
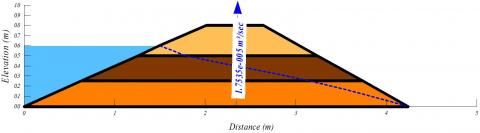
Numerical models’ experimental findings are shown in Figure 18, the anisotropy model has been reconstructed and the location of the layers was changed in SEEP/W, the phreatic line was not cut the d/s this would be explainable by the fact that the soil's higher permeability behaved as a drain as illustrated in Figure 18(c), periodically throughout the dam's operation, the reservoir's water level has to be changed. The upstream face's safety would be affected by this activity. The two impacts of the reservoir's level of water decreasing thus are included: the reduction of the external hydrostatic pressure stability and changing the interior pore water pressure.
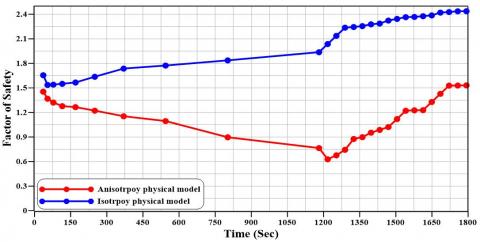
Rapid reservoir level drop causes a sudden change in all boundary conditions, which then impacts the stability of the u/s shell. The drawdown-induced failure regime that affects the u/s shell of a physical dam with a slope value of 1V:2.5H and anisotropic permeability characteristics is depicted in Figure 19, the water level is lowered from 0.6 m to zero over a period of 30 minutes in order to simulate a rapid depletion of the upstream supply of water. The Morgenstern pricing approach has been used to determine the safety factor, while for the first model with isotropy properties, the upstream shell was safe after rapid drawdown as illustrated in Figure 20.
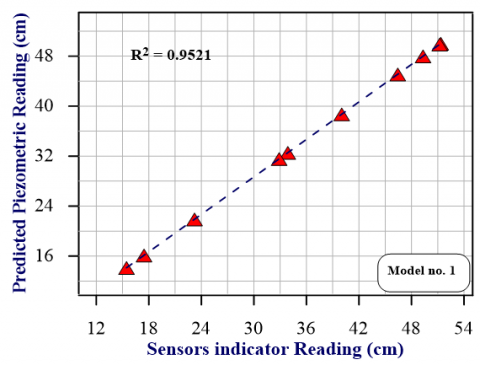
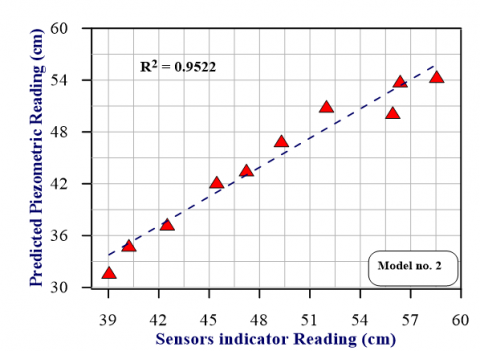
The vertical permeability of the shell decreased with an increase in anisotropy, when compared to the case of isotropic permeability, this leads to a greater resistance to the dissipating of the excess pore water pressure through shell. Based on the results, it can be indicated that numerical models can represent seepage via homogenous and anisotropic earth dams accurately, with a correlation between experimental alongside numerical models of more than 95%, as illustrated in Figure 21.
The seepage rate relative inaccuracy varied slightly, with the first model having an 11.67% value. Although the relative error increased by 19.01% in the second model, the presence of the pipes may have attributed to this relative error (Table 3).
(a) Isotropy dam materials
(b) Anisotropy dam materials
(c) Anisotropy dam materials with rearranging the location of the layers in SEEP/W
Figure 18. Phreatic line of numerical models additionally seepage
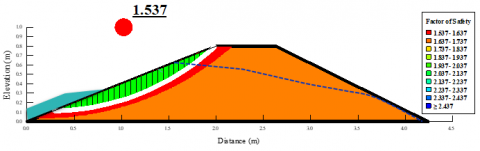
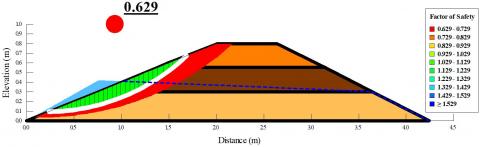
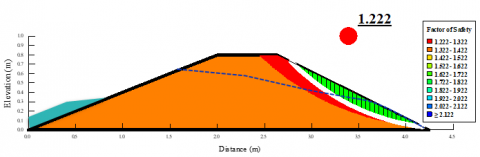
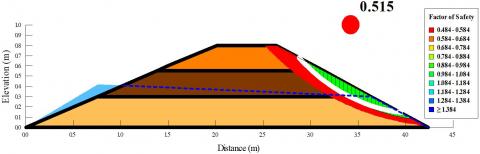
(a) Isotropy dam materials (u/s stability)
(b) Anisotropy dam materials (u/s stability)
(c) Isotropy dam materials (d/s stability)
(d) Anisotropy dam materials (d/s stability)
Figure 19. Upstream and downstream slope stability results
Figure 20. Factor of safety comparison for the two cases of slopes
Figure 21. Sensor’s indicator reading and piezo metric reading between physical and numerical homogenous and anisotropy dam models water level (0.6 m)
Table 3. Seepage flow rates between numerical and physical models
|
Models |
Seepage (q) (m3/s/m) |
|
|
Physical |
SEEP/W |
|
|
Model no. 1 Homogenous with isotropy dam materials |
3.91×10⁻⁵ |
3.4449×10⁻⁵ |
|
Model no. 2 with anisotropy dam materials |
2.18×10⁻⁴ |
1.7655×10⁻⁴ |
|
Model no. 3 with rearranging the location of the layers in SEEP/W |
- |
1.7535×10⁻⁵ |
5.3 Comparison of rapid and slow drawdown
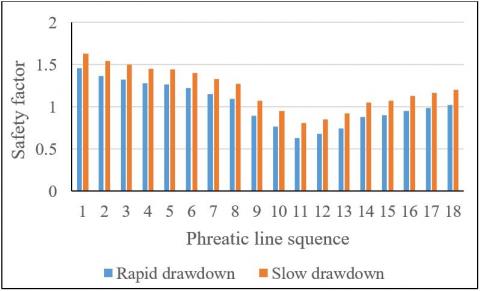
The time of drawdown has been increased to one hour than half hour in the second tests, the slow rate of depletion gives a sufficient period for the pore water pressure development in the upstream shells to dissipate. This avoids the decline in effective stress (as well as shear strength), formation of unbalanced forces, and destabilization of the upstream slope that might have otherwise occurred and the slope stability is shown to be little impacted by the material's anisotropic nature as depicted in Figure 22 which shows that the impact of rapidly drawdown is the most significant issue. Researchers and practitioners can readily analyze the scenarios that would argue for a more thorough analysis that includes the influence of anisotropic soils of geomaterials into account using the findings of this study.
Figure 22. Slope stability results for two cases rapid and slow drawdown
Using physical and numerical modeling, the main objective of this study is to investigate how anisotropic permeability affects seepage patterns and drawdown-related slope stability issues, more reliable model has been developed in this study by include anisotropic permeability ratios within normal limits for earth dam materials, when a reservoir suddenly discharges during the phenomena of rapid drawdown, unbalanced forces start to develop. This causes the upstream shell to fail. The following is a list of the study's findings:
1. The seepage rate for anisotropic model reached (2.18×10⁻⁴ m3/sec) within 48 hours of the model's steady state condition; this is exceeded by more than 75% in comparison to the homogeneous model.
2. The anisotropy dam model produced various results compared to the homogeneous model; the seepage line is higher and the downstream has been cut at the second layer of material (sandy loam soil).
3. Due to the influence of anisotropy, the internal pore water pressure and stresses are significantly affected by the reduction in reservoir level, seepage which induced pore pressure resulting from a transient water flow generate changes in the pore pressure inside the dam, as a result soil subsidence of about (1 cm) has been observed after 0.5 hour of rapid drawdown.
4. Anisotropy has a significant impact on the stability of upstream slope during sudden depletion and the factor of safety reduced more than 55%, so as the rate of drawdown increases, the impact of anisotropy increases.
5. The slope stability has been shown to be less affected by the material's anisotropy by about 11.72% than rapid drawdown as compared to slow drawdown due to a sufficient period for the pore water pressure development in the upstream shells to dissipate.
6. Physical model's progress to saturation and the period of time needed for reaching saturation has been twice as long as it takes an isotropic model to finally reach saturation.
Future prospects for the academic endeavor include the addition of more non-linear material to the analyses and developing of a safety chart that could be utilized by practicing engineers for the numerical evaluation of slopes in earth dam.
This work is supported by the National Center for Structural Laboratories in Baghdad/Iraq which perform soil experiments with the necessary precision. We acknowledge and are indebted to the publishers and authors that provided the references for allowing us permission to use their published works.
|
CPT |
dissipation test |
|
D/S |
downstream slope of the dam |
|
FS |
factor of safety |
|
k |
the hydraulic conductivity m/day |
|
kx |
horizontal permeability, m/day |
|
ky |
vertical permeability, m/day |
|
Q |
the discharge rate m3/sec |
|
T |
dimensionless parameter time factor |
|
U/S |
upstream slope of the dam |
[1] Pinyol, N.M., Alonso, E.E., Olivella, S. (2008). Rapid drawdown in slopes and embankments. Water Resources Research, 44(5). https://doi.org/10.1029/2007WR006525
[2] Berilgen, M.M. (2007). Investigation of stability of slopes under drawdown conditions. Computers and Geotechnics, 34(2): 81-91. https://doi.org/10.1016/j.compgeo.2006.10.004
[3] Duncan, J.M. (1996). State of the art: Limit equilibrium and finite-element analysis of slopes. Journal of Geotechnical Engineering, 122(7): 577-596. https://doi.org/10.1061/(ASCE)0733-9410(1996)122:7(577)
[4] Duncan, J.M., Wright, S.G., Wong, K.S. (1990). Slope stability during rapid drawdown. Proceedings of the H. Bolton Seed Memorial Symposium, BiTech Publishers Ltd, Vancouver, B.C., Canada, pp. 253-272.
[5] Chapuis, R.P., Gill, D.E., Baass, K. (1989). Laboratory permeability tests on sand: Influence of the compaction method on anisotropy. Canadian Geotechnical Journal, 26(4): 614-622. https://doi.org/10.1139/t89-074
[6] Clavaud, J.B., Maineult, A., Zamora, M., Rasolofosaon, P., Schlitter, C. (2008). Permeability anisotropy and its relations with porous medium structure. Journal of Geophysical Research, 113(B1): B01202. https://doi.org/10.1029/2007JB005004
[7] Biswas, N., Chakraborty, S., Mosadegh, L., Puppala, A.J., Corcoran, M. (2020). Influence of anisotropic permeability on slope stability analysis of an earthen dam during rapid drawdown. In Geo-Congress 2020, pp. 29-39. https://doi.org/10.1061/9780784482797.004
[8] Satter, A., Iqbal, G.M. (2016). Fundamentals of fluid flow through porous media. In Reservoir Engineering Elsevier, pp. 155-169. http://dx.doi.org/10.1016/B978-0-12-800219-3.00009-7
[9] Mitchell, J.K., Guzikowski, F., Villet, W.C.B. (1978). The measurement of soil properties in situ: Present methods & their applicability and potential. Berkley, California. https://doi.org/10.2172/5140085
[10] Robertson, P.K., Sully, J.P., Woeller, D.J., Lunne, T., Powell, J.J.M., Gillespie, D.G. (1992). Estimating coefficient of consolidation from piezocone tests. Canadian Geotechnical Journal, 29(4): 539-550. https://doi.org/10.1139/t92-061
[11] Khattab, A.A. (2010). Stability analysis of Mosul dam under saturated and unsaturated soil conditions. Al-Rafidain Engineering Journal (AREJ), 18(1): 13-27. https://doi.org/10.33899/rengj.2010.27983
[12] Khassaf, S.I., Abdul-Hameed, M.R, Shams Al-deen, N.N. (2013). Slope stability analysis under rapid drawdown condition and seismic loads of earth dam (Case study: Mandali dam). International Journal of Innovative Research in Science, Engineering and Technology, 2(12): 7114-7118.
[13] Fattah, M.Y., Omran, H.A., Hassan, M.A. (2017). Flow and stability of Al-Wand earth dam during rapid drawdown of water in reservoir. Acta Montanistica Slovaca, 22(1).
[14] Zedan, A.J., Faris, M.R., Abdulsattar, A.A. (2017). Seepage analysis through an earth dam (Khasa-Chai Dam) as a case study. Engineering and Technology Journal, 35(2). https://doi.org/10.30684/etj.2017.127329
[15] Casagrande, A. (1937). Seepage through dams. Journal of the New England Water Works Association June, Soil Mechanics Series, 5: 209
[16] Hofmann, J.R., Hofmann, P.A. (1992). Darcy's law and structural explanation in Hydrology. In PSA: Proceedings of the Biennial Meeting of the Philosophy of Science Association, pp. 23-35. https://doi.org/10.1086/psaprocbienmeetp.1992.1.192741
[17] Morgenstern, N.R., Price, V.E. (1965). The analysis of the stability of general slip surface. Geotechnique, 15(1): 79-93. https://doi.org/10.1680/geot.1965.15.1.79
[18] USBR. (2001). Training aids for dam safety evaluation of seepage conditions. U.S. Bureau.pdf.
[19] ICOLD. (2011). Small dams design, surveillance and rehabilitation. Bulletin N.
[20] GEO-SLOPE. (2012). Seepage Modeling with SEEP/W-An Engineering Methodology. GEO-SLOPE International Ltd, Canada. https://www.geoslope.com/.