Stability Analysis of Spread of Infectious Diseases COVID-19 Using SEIAR-V1V2Q Model for Asymptomatic Condition with Runge-Kutta Order 4

Erwin*![]() | Citra Dewi Hasibuan
| Citra Dewi Hasibuan![]() | Doni Aldo Samuel Siahaan
| Doni Aldo Samuel Siahaan![]() | Asima Manurung
| Asima Manurung![]() | Jonathan Liviera Marpaung
| Jonathan Liviera Marpaung![]()
© 2024 The authors. This article is published by IIETA and is licensed under the CC BY 4.0 license (http://creativecommons.org/licenses/by/4.0/).
OPEN ACCESS
The spread of infectious diseases in Indonesia has become a significant concern in health. COVID-19 contagious disease has difficulties in infection because some individuals are infected asymptomatically. Infectious diseases are modeled with a SEIR model modification with vaccinations 1 and 2, and Quarantine will produce a new approach by considering the variables and parameters of prevention so that it can suppress the rate of spread of the infectious disease COVID-19. The study will simulate a numerical analysis of the transmission model of contagious diseases solved using the Runge-Kutta order 4. The results achieved a new model with the SEIAR-V1V2Q modification, this model can predict the acceleration of the spread of the COVID-19 transmitted disease by considering asymptomatic conditions. Based on the research, modifying the SEIR model with 2-stage vaccination and quarantine measures can reduce the percentage of infection cases of susceptible individuals, especially cases of asymptomatic infection, which are cases of infected individuals without showing symptoms. Discipline in accelerating 2-stage vaccination will increase the formation of individual body immunity to strengthen unique antibodies to minimize infection with the COVID-19 virus. It can be a reference in similar cases requiring vaccination and Quarantine of infected individuals.
epidemiology, Runge-Kutta order 4, SEIR, stability, asymptomatic, Python
The increase in infectious diseases in Indonesia has become a significant focal point within public health. Indonesia, a nation comprised of islands inhabited by a population of over 270 million individuals, confronts the task of effectively managing and mitigating the transmission of infectious diseases that pose a significant risk to the general public's well-being. Various factors, including geography, demography, health infrastructure, population mobility, and public knowledge, influence the transmission of infectious illnesses within a country. Acute respiratory tract infections, such as influenza and pneumonia, are among Indonesia's most prevalent infectious diseases [1]. The 2019 coronavirus infection (COVID-19) pandemic is a problem faced in more than 200 countries worldwide. Indonesia has also been adversely affected by COVID-19, where the mortality rate reached 8.9% at the end of March 2020. The unpreparedness of the healthcare services and the great strides taken by the government might be changed to eradicate this infection [2]. The transmission of the disease can occur by airborne particles or through direct physical contact with an individual who is sick. The impact of humidity levels and the rainy season on disease transmission is significant since there is a tendency for peak instances to coincide with the onset of the rainy season.
Furthermore, within the context of Indonesia, there exists a significant level of concern around infectious diseases, namely tuberculosis (TB), malaria, diarrhea, and measles. In addition to their lesser prevalence, contagious disorders such as dengue fever, HIV/AIDS infection, and hepatitis are significant. The correlation between the prevalence of infectious diseases in Indonesia and the availability of sufficient healthcare services is substantial. Specific locations in Indonesia, particularly those on remote islands, experience restricted availability of healthcare facilities. The complexity associated with detecting and treating infectious diseases can be heightened.
Furthermore, the dissemination of infectious illnesses is influenced by the extent of public awareness regarding health and disease prevention endeavors. The dissemination of knowledge regarding the significance of hand hygiene, immunization, and adopting a health-conscious lifestyle within the public-school system can contribute to mitigating the transmission of infectious illnesses. Population mobility is a significant determinant in the transmission dynamics of infectious diseases in Indonesia. The major islands of Java, Sumatra, Kalimantan, and Sulawesi exhibit substantial mobility due to their dense population and concentration of economic activities. The phenomenon could expedite the transmission of infectious illnesses across different geographical areas. The recognition of the significance of preventing and controlling the transmission of contagious diseases has been acknowledged by the Indonesian government and other health organizations. Efforts have been undertaken to mitigate the prevalence of pain and mortality resulting from infectious diseases by implementing mass immunization initiatives and health awareness programs.
Furthermore, there have been efforts to enhance laboratory infrastructure and establish more robust epidemiological surveillance systems to expedite the detection and response to infectious disease epidemics. Nevertheless, persistent obstacles persist due to recent contagious ailments like the COVID-19 epidemic. Since the onset of 2020, Indonesia has been confronted with the COVID-19 pandemic, which has significantly impacted both the healthcare and economic domains. The Indonesian government has implemented many strategies to mitigate the transmission of the virus, encompassing measures such as imposing limitations on mobility, enforcing health norms, and executing large-scale vaccine initiatives. Given the prevalence of several infectious diseases, collaboration among governments, health institutions, and the general populace is increasingly paramount. All stakeholders must collaborate to enhance public consciousness regarding the significance of preventing, managing, and treating infectious diseases. Strengthening the health systems and infrastructure in geographically isolated regions is equally imperative to enhance the availability and accessibility of healthcare services. The dynamics of disease transmission in Indonesia are expected to undergo ongoing transformations as time progresses. Hence, it is imperative to continuously improve prevention, surveillance, and fast response initiatives to safeguard public health and alleviate the impact of infectious diseases inside the nation. This paper aims to address the issue of numerically solving the model of infectious disease transmission in human populations by employing the high-order Runge-Kutta method [3, 4].
The urgency of employing the Runge-Kutta order 4 method for the numerical solution of the transmission model of infectious diseases is substantiated by existing research. This urgency stems from the significant implications that accurate prediction and effective control of infection outbreaks, particularly those of a widespread or pandemic nature, can have on public health and the economy. By employing mathematical models and numerical techniques such as the Runge-Kutta order 4 method, researchers can make predictions regarding the propagation of diseases within a population and ascertain the efficacy of various control measures. This information holds significant importance for governmental bodies and health authorities, as it necessitates prompt action to mitigate its adverse consequences. Using the Runge-Kutta order 4 method in research enables the evaluation of the effects of adopted health policies, such as mass vaccination campaigns, movement restrictions, and the adoption of facial masks. The effectiveness of policies to prevent the spread of infectious illnesses can be assessed through simulations and experiments involving mathematical models. During a pandemic or epidemic scenario, there may be constraints on health resources, including hospital beds, medical personnel, and medical equipment. Numerical models facilitate enhanced resource planning to optimize utilization and mitigate the most severe consequences associated with disease transmission. The movement of populations can impact the transmission of infectious illnesses between different geographical areas. By utilizing numerical models that depict mobility, researchers can discern transmission patterns and gain insights into the influence of mobility on the propagation of diseases. The investigation of the numerical solution of the Susceptible-Exposed-Infectious-Recovered (SEIR) model using the Runge-Kutta order 4 method can yield valuable insights into diverse categories of infectious diseases. Various diseases exhibit distinct patterns of dissemination, and by employing this approach, we may adapt models to capture the unique traits associated with each disease accurately.
The mathematical representation of the COVID-19 virus propagation problem is formulated as a system of ordinary differential equations (ODEs) concerning time. This model elucidates the dynamics of virus transmission within the human body. The Susceptible-Exposed-Infectious Asymptomatic-Recovered (SEIAR)-VQ mathematical model has a series of seven equations that represent the variables involved, namely Susceptible in humans ($S_h$), Exposed in Humans ($E_h$), Infected in humans, Asymptomatic Infected in Humans ($A_h$), Recovered in Humans, Vaccinated in human, and Quarantine for human $Q_h$. The SEIAR-VQ model incorporates the occurrence of asymptomatic infected individuals who do not exhibit symptoms. This variable holds significant importance within the context of the spread model [5].
Implementing the Runge-Kutta order 4 method to solve the SEIAR-V1V2Q model numerically was an initial milestone in epidemiology and applied mathematical investigation. Subsequent investigations may encompass the utilization of more intricate models, which take into account variables such as vaccination rates, collective immunity, and more accurate representations of human mobility. Given the pressing and complex nature of contemporary global health issues, there is significant pertinence and significance in researching numerical solutions to the transmission model of infectious illnesses using the Runge-Kutta order 4 method. The research contribution would enhance comprehension of disease transmission patterns, aiding the public and governments in making informed decisions during future outbreaks and epidemics. This study uses the high-order Runge-Kutta method to conduct a numerical analysis of the model about the transmission of infectious diseases within the human population [6, 7].
1.1 Related works
Numerous prior investigations have employed the SEIR model to comprehend and evaluate the propagation of infectious ailments. This model has been utilized in the context of various diseases, including influenza, TB, HIV/AIDS, Ebola, COVID-19, and numerous others [8, 9]. The following examples illustrate pertinent research studies. The study on the transmission of influenza in human populations utilizing the SEIR model encompasses an examination of the dissemination of the flu within human communities by employing SEIR models to forecast infection rates and evaluate the effectiveness of interventions, such as vaccination campaigns and quarantine measures [10-12].
Using the SEIR model in tuberculosis research aims to comprehend tuberculosis transmission dynamics within a community and ascertain the various factors influencing its dissemination [13, 14]. The SEIR model is integrated with other epidemiological models in certain instances to facilitate a comprehensive examination. The SEIR model is a focal point of research concerning the utilization of SEIR models to comprehend the transmission dynamics of HIV/AIDS across diverse demographic cohorts while also discerning efficacious intervention approaches for disease control. The analysis of Ebola spread uses the SEIR Model to forecast the dissemination of Ebola outbreaks within a population and assess the effects of different preventative measures and countermeasures [15, 16]. The investigation of the transmission dynamics of COVID-19 utilizing SEIR models. Since the onset of the COVID-19 pandemic in 2019, numerous studies have employed the SEIR model to forecast the transmission of the virus, assess the magnitude of infections, and appraise the efficacy of preventive measures [17].
The research demonstrates the effectiveness of utilizing the SEIR model as a valuable instrument for comprehending the intricacies associated with transmitting infectious illnesses within populations, facilitating informed decision-making during outbreaks and epidemics. Mathematical models, such as the SEIR model, have shown to be valuable tools for scientists and researchers in enhancing our comprehension of infectious illnesses and devising more efficient prevention and management methods [10, 18, 19]. Nevertheless, it is crucial to bear in mind that this model relies on specific assumptions, and hence, the outcomes should be cautiously interpreted within the framework of pertinent empirical evidence.
1.2 Epidemic SEIR model
The SEIR epidemic model is one of the mathematical models used to model the spread of infectious diseases by the population. The SEIR abbreviation comes from four compartments considered in this model: Susceptible, Exposed, Infectious, and Recovered [20, 21]. This model divides the population into four groups based on the infection status and describes how individuals move from one group to another over time.
1-Susceptible (S): This group includes individuals exposed to infection.
2-Exposed (E): This group includes individuals exposed to the disease but have not shown symptoms and cannot transmit the disease to other individuals. The incubation period usually occurs during individuals in this group.
3-Infectious (I): This group includes actively infected people who can transmit disease to others. This period of infection lasts as long as individuals are in the group.
4-Recovered (R): These groups include individuals who recover from the infection and gain immunity against the disease. Once healed, this individual can no longer be infected and cannot transmit the disease.
The SEIR model uses a system of differential equations to describe the movement of individuals between these groups over time [22, 23]. In this model, several parameters affect the dynamics of disease spread, such as introductory reproduction rate (basic reproduction number/R0), transition rate from exposed to infected (α), and healing rate (γ).
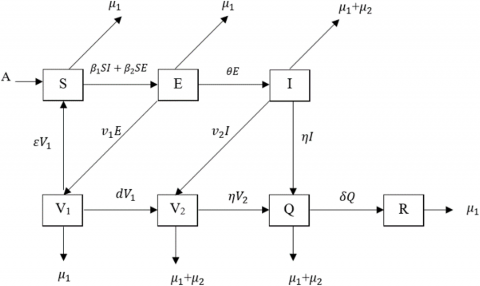
Figure 1. Modification of SEIAR-V1V2Q model
2.1 Modification of SEIR model
The disease spread model is subject to modification by including vaccine and quarantine treatment to assess the rate of change in disease transmission [24, 25]. Figure 1 shows the modified SEIAR model, and the variables used will be explained in Table 1.
Table 1. Variables and parameters on SEIAR-V1V2Q model modification
|
Symbol |
Information |
|
|
Variable |
S |
Number of susceptible individuals in the interval $t$ |
|
E |
Number of individuals exposed in the interval $t$ |
|
|
I |
Number of infected individuals in the interval $t$ |
|
|
V1 |
Number of individuals vaccinated 1 in the interval $t$ |
|
|
V2 |
Number of individuals vaccinated 2 in the interval $t$ |
|
|
Q |
The number of exposed individuals is quarantined in the interval $t$ |
|
|
R |
Number of individuals recovering from COVID-19 in the interval $t$ |
|
|
Parameter |
A |
Vulnerable population growth |
|
$\beta_1$ |
Rate of transmission of COVID-19 from infected individuals |
|
|
$\beta_2$ |
Rate of transmission of COVID-19 from exposed individuals |
|
|
$\theta$ |
The average rate at which individuals are exposed becomes infected individuals. |
|
|
$\mu_1$ |
Natural mortality rate |
|
|
$\mu_2$ |
Natural mortality rate caused by COVID-19 |
|
|
$\varepsilon$ |
The average rate of exposed individuals who are quarantined and have no symptoms who return to being vulnerable individuals. |
|
|
$\eta$ |
The average rate of infected individuals and stage 2 vaccination in Quarantine (isolation). |
|
|
$v_1$ |
The average rate at which individuals are exposed to vaccination 1. |
|
|
$v_2$ |
The average rate at which infected individuals perform vaccination 2. |
|
|
$\delta$ |
Average rate of recovery from COVID-19 |
|
|
d |
Rate of administration of phase 2 vaccine |
When there is a change in the entire variable over a certain time interval $\Delta t$, it is reasonable to suppose that,
$(S, E, I, R)(t+\Delta t)=(S, E, I, R)(t)$ (1)
where a change of value $(S, E, I, R)$ is a change susceptible, exposed, infectious, recovered that changes against a change $\Delta t$ then it can be written that,
$\begin{gathered}\frac{d S(t)}{d t}=A+\varepsilon V_1-\beta_1 S(t) I(t)-\beta_2 S(t) E(t)-\mu_1 S(t) \\ \frac{d E(t)}{d t}=\beta_1 S(t) I(t)+\beta_2 S(t) E(t) -v_1 E(t)-\theta E(t)-\mu_1 E(t) \\ \frac{d I(t)}{d t}=\theta E(t)-v_2 I(t)-\eta I(t)-\left(\mu_1+\mu_2\right)(t) \\ \frac{d V_1(t)}{d t}=v_1 E(t)-\varepsilon V_1(t)-d V_1(t)-\mu_1 V_1(t) \\ \frac{d V_2(t)}{d t}=d V_1(t)+v_2 I(t)-\eta V_2(t)-\left(\mu_1+\mu_2\right) V_2(t) \\ \frac{d Q(t)}{d t}=\eta V_2(t)+\eta I(t)-\delta Q(t)-\left(\mu_1+\mu_2\right) Q(t) \\ \frac{d R(t)}{d t}=\delta Q(t)-\mu_1 R(t)\end{gathered}$ (2)
The model of (2) is a model of disease spread with $\lim _{\Delta t \rightarrow 0} \frac{\Delta(S, E, I, V 1, V 2, Q, R)}{\Delta t}$. So that the form of the differential equation of the modification model can be obtained,
$\begin{gathered}\frac{d S(t)}{d t}=A+\varepsilon V_1-\beta_1 S I-\beta_2 S E-\mu_1 S \\ \frac{d E(t)}{d t}=\beta_1 S I+\beta_2 S E-v_1 E-\theta E-\mu_1 E \\ \frac{d I(t)}{d t}=\theta E-v_2 I-\eta I-\left(\mu_1+\mu_2\right) I \\ \frac{d V_1(t)}{d t}=v_1 E-\varepsilon V_1-d V_1-\mu_1 V_1 \\ \frac{d V_2(t)}{d t}=d V_1+v_2 I-\eta V_2-\left(\mu_1+\mu_2\right) V_2 \\ \frac{d Q(t)}{d t}=\eta V_2+\eta I-\delta Q-\left(\mu_1+\mu_2\right) Q \\ \frac{d R(t)}{d t}=\delta Q-\mu_1 R\end{gathered}$ (3)
where the total population N is a combination of all variables in the modified model,
$N=S+E+I+V_1+V_2+Q+R$ (4)
2.2 Analysis of SEIAR-V1V2Q model
In analyzing the modification model that has been formed, positivity analysis is carried out to determine the meaning of epidemic. The proof is done by proving the variable is a positive value where the value of each equation is positive for each $t>0$.
Theorem 1. Suppose then the solution of model (6) is positive for each
$\begin{align} & S(0)\ge 0,\text{ }E(0)\ge 0,\text{ }I(0)\ge 0,\text{ }{{V}_{1}}(0)\ge 0,{{V}_{2}}(0)\ge 0, \\ & Q(0)\ge 0,\text{ }R(0)\ge 0,\text{ }S(t),\text{ }E(t),I(t),\text{ }{{V}_{1}}(t),{{V}_{2}}(t), \\ & R(t),\text{ }t>0 \\\end{align}$
Proof. Known initial values will indicate the solution of each variable. If taken the
$\begin{align} & S(0)\ge 0,E(0)\ge 0,I(0)\ge 0,{{V}_{1}}(0)\ge 0,\text{ }{{V}_{2}}(0)\ge 0,\text{ } \\ & Q(0)\ge 0,\text{ }R(0)\ge 0,\text{ }t>0 \\\end{align}$
susceptible equation is as follows,
$\begin{aligned} & \frac{d S}{d t}=A+\varepsilon V_1-\beta_1 S I-\beta_2 S E-\mu_1 S \\ & \frac{d S}{d t}=A+\varepsilon V_1-S\left(\beta_1 I-\beta_2 E-\mu_1\right)\end{aligned}$
The equation can be written as,
$\frac{d S(t)}{d t}+p S(t)=A+S(t)=A+\varepsilon V_1$
where $p=\beta_1 I-\beta_2 E-\mu_1$.
By using the integral factor method, obtained:
$\begin{aligned} & \frac{d S(t)}{d t} \cdot e^{\int_0^t p d \theta}+p S(t) \cdot e^{\int_0^t p d \theta}=\left(A+\varepsilon V_1(t)\right) \cdot e^{\int_0^t p d \theta} \\ & \Leftrightarrow \frac{d}{d t}\left(S(t) \cdot e^{\int_0^t p d \theta}\right)=\left(A+\varepsilon V_1(t)\right) \cdot e^{\int_0^t p d \theta}\end{aligned}$
Further obtained the value that,
$S(t) \cdot e^{\int_0^t p d \theta}-S(0)=\int_0^t\left(A+\varepsilon V_1(t)\right) \cdot e^{\int_0^t p d \theta} d t$
$S(t)=S(0) e^{-\int_0^t p d \theta}+e^{-\int_0^t p d \theta}\left\{\int_0^t\left(A+\varepsilon V_1(t)\right) \cdot e^{\int_0^t p d \theta} d t\right\}>0, \forall t>0$ (5)
Using the same method will be obtained the value of $E(0)>0, I(0)>0, V_1(0)>0, V_2(0)>0, Q(0)>0, R(0)>0$, for each $t>0$.
2.3 Stability analysis R0
The base reproduction number, or $R_0$, is a population's average number of new infection cases. If value $R_0<1$, the spread of the disease is a controllable case and will not become an epidemic, so the non-endemic equilibrium point will be assigned K to be locally asymptotic stable. However, if $R_0>1$, then for every individual infected with COVID-19, it will spread the disease to vulnerable individuals in a population, impacting the occurrence of epidemics within a period t so that K is unstable. The equilibrium point for endemic cases occurs if an individual can infect another individual, especially in asymptomatic infectious conditions. Then, the endemic equilibrium point is,
$K^*=\left(S^*, E^*, I^*, V_1^*, V_2^*, Q^*\right)$ (6)
where and satisfy the system of equations:
$\begin{align} & {{S}^{*}}(0)\ne 0,{{E}^{*}}(0)\ne 0,{{I}^{*}}(0)\ne 0,V_{1}^{*}(0)\ne 0, \\ & V_{2}^{*}(0)\ne 0,{{Q}^{*}}(0)\ne 0 \\ \end{align}$
$\begin{gathered}A+\varepsilon V_1^*-\beta_1 S^* I^*-\beta_2 S^* E^*-\mu_1 S^*=0 \\ \beta_1 S^* I^*+\beta_2 S^* E^*-v_1 E^*-\theta E^*-\mu_1 E^*=0 \\ \theta E^*-v_2 I^*-\eta I^*-\left(\mu_1+\mu_2\right) I^*=0 \\ v_1 E^*-\varepsilon V_1^*-d V_1^*-\mu_1 V_1^*=0 \\ d V_1^*+v_2 I^*-\eta V_2^*-\left(\mu_1+\mu_2\right) V_2^* \\ \eta V_2^*+\eta I^*-\delta Q^*-\left(\mu_1+\mu_2\right) Q^*=0\end{gathered}$ (7)
The stability of the endemic equilibrium point is determined from the value $R_0<1$, and then the case is said to be asymptotic stable; otherwise, if $R_0<1$, the condition is assumed to be unstable.
3.1 Experimental simulation
The case of the spread of COVID-19 in North Sumatra, Indonesia, recorded that as of October 16, 2023, there were 6.811.945 cases infected with COVID-19, as many as 6.641.275 recovered, and 170.670 died due to COVID-19, Based on the formulation set out above Eqs. (6) and (7), we will be able to obtain the coefficients value of the equation as shown in Table 2.
By substituting the parameter values on the model will be obtained,
$\begin{aligned} & \frac{d S}{d t}=(5,9999)+\left(2,84 \times 10^{-8}\right) V_1-\left(2,84 \times 10^{-8}\right) S I-\left(8,24 \times 10^{-8}\right) S E-\left(0,2873 \times 10^{-5}\right) S \\ & \frac{d E}{d t}=\left(2,84 \times 10^{-8}\right) S I+\left(8,24 \times 10^{-8}\right) S E-\left(9,83 \times 10^{-3}\right) E-\left(5,23 \times 10^{-1}\right) E-\left(0,2873 \times 10^{-5}\right) E \\ & \frac{d I}{d t}=\left(5,23 \times 10^{-1}\right) E-\left(3,723 \times 10^{-14}\right) I-\left(4,71 \times 10^{-1}\right) I-\left(0,2873 \times 10^{-5}+0,1873 \times 10^{-3}\right) I \\ & \frac{d V_1}{d t}=\left(9,83 \times 10^{-3}\right) E-\left(2,84 \times 10^{-8}\right) V_1-\left(2,84 \times 10^{-8}\right) V_1-\left(0,2873 \times 10^{-5}\right) V_1 \\ & \frac{d V_2}{d t}=\left(2,84 \times 10^{-8}\right) V_1+\left(3,723 \times 10^{-14}\right) I-\left(4,71 \times 10^{-1}\right) V_2-\left(0,2873 \times 10^{-5}+0,1873 \times 10^{-3}\right) V_2 \\ & \frac{d Q(t)}{d t}=\left(4,71 \times 10^{-1}\right) V_2+\left(4,71 \times 10^{-1}\right) I-\left(8,5 \times 10^{-3}\right) Q-\left(0,2873 \times 10^{-5}+0,1873 \times 10^{-3}\right) Q\end{aligned}$
By using Python, experimental simulations are obtained from modified models SEIAR-V1V2Q.
Table 2. Coefficient result
|
Parameter |
Value |
|
$A$ |
5,99999 |
|
$\beta_1$ |
2,84×10⁻⁸ |
|
$\beta_2$ |
8,24×10⁻⁸ |
|
$\theta$ |
5,23×10⁻¹ |
|
$\mu_1$ |
2,873×10-6 |
|
$\mu_2$ |
1,873×10-4 |
|
$\varepsilon$ |
2,84×10⁻⁸ |
|
$\eta$ |
4,71×10⁻¹ |
|
$v_1$ |
9,83×10⁻³ |
|
$v_2$ |
3,723×10-14 |
|
$\delta$ |
8,5×10⁻³ |
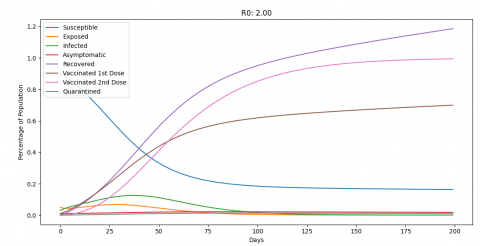
Figure 2. Model modification simulation SEIAR-V1V2Q
Based on Figure 2, it is known that the spread of infectious diseases with 2-stage vaccination treatment and Quarantine for infected cases can improve individuals' recovery process. If the 2-stage vaccination rate is increased, it will provide a pretty good representation of recovery, with exposed cases getting sloping, as in Figure 3.
Figure 3. Model modification simulation with 2-stage vaccination rate increase
Figure 4. Simulated model modification with descent S0
After the implementation of preventive measures of 2-stage vaccination of the entire population, which has implications for the decrease in the susceptibility rate, the reduction in cases will be swift. Figure 3 shows a simulated representation of model modification if the condition with S=0,2 a rate where S is the percentage of the susceptible rate.
Figure 4 shows that increasing the percentage of 2-stage vaccination rates and preventive measures or health protocols will reduce the number of susceptible cases.
Based on the research, modifying the SEIR model with 2-stage vaccination and quarantine measures can reduce the percentage of infection cases of susceptible individuals, especially cases of asymptomatic infection, which are cases of infected individuals without showing symptoms. Discipline in accelerating 2-stage vaccination will increase the formation of individual body immunity to strengthen unique antibodies to minimize infection with the COVID-19 virus.
If the individual is infected after the second vaccination, measures are taken to limit social interaction (social distancing) by isolating or quarantining until entering the recovery phase. The modified model SEIAR-V1V2Q can be a reference in similar cases requiring vaccination and quarantine measures of infected individuals.
This work was funded by Universitas Sumatera Utara scheme research program (Grant No.: 337/UN5.2.3.1/PPM/KP-TALENTA/R/2023).
[1] Kumar, P., Vellappandi, M., Khan, Z.A., Sivalingam, S.M., Kaziboni, A., Govindaraj, V. (2023). A case study of monkeypox disease in the United States using mathematical modeling with real data. Mathematics and Computers in Simulation, 213: 444-465. https://doi.org/10.1016/j.matcom.2023.06.016
[2] Setiati, S., Azwar, M.K. (2020). COVID-19 and Indonesia. Acta Medica Indonesiana, 52(1): 84-89.
[3] Javeed, S., Anjum, S., Alimgeer, K.S., et al. (2021). A novel mathematical model for COVID-19 with remedial strategies. Results in Physics, 27: 104248. https://doi.org/10.1016/j.rinp.2021.104248
[4] Adegbite, G., Edeki, S., Isewon, I., Emmanuel, J., et al. (2023). Mathematical modeling of malaria transmission dynamics in humans with mobility and control states. Infectious Disease Modelling, 8(4): 1015-1031. https://doi.org/10.1016/j.idm.2023.08.005
[5] DarAssi, M.H., Ahmad, I., Meetei, M.Z., Alsulami, M., Khan, M.A., Tag-eldin, E. M. (2023). The impact of the face mask on SARS-CoV-2 disease: Mathematical modeling with a case study. Results in Physics, 51: 106699. https://doi.org/10.1016/j.rinp.2023.106699
[6] Sweilam, N., Al-Mekhlafi, S., Shatta, S., Baleanu, D. (2022). Numerical treatments for the optimal control of two types variable-order COVID-19 model. Results in Physics, 42: 105964. https://doi.org/10.1016/j.rinp.2022.105964
[7] Sweilam, N.H., Al-Mekhlafi, S.M., Al-Ajami, T.M. (2022). Optimal control of hybrid variable-order fractional coronavirus (2019-nCov) mathematical model; numerical treatments. Ecological Complexity, 49: 100983. https://doi.org/10.1016/j.ecocom.2022.100983
[8] Chaudhary, R.K., Abbas, I.A., Singh, J. (2023). Numerical simulation of thermal response for non-linear multi-layer skin model subjected to heating and cooling. Thermal Science and Engineering Progress, 40: 101790. https://doi.org/10.1016/j.tsep.2023.101790
[9] Shen, Z.H., Chu, Y.M., Khan, M.A., Muhammad, S., Al-Hartomy, O.A., Higazy, M. (2021). Mathematical modeling and optimal control of the COVID-19 dynamics. Results in Physics, 31: 105028. https://doi.org/10.1016/j.rinp.2021.105028
[10] Sabir, Z., Asmara, A., Dehraj, S., et al. (2023). A mathematical model of coronavirus transmission by using the heuristic computing neural networks. Engineering Analysis with Boundary Elements, 146: 473-482. https://doi.org/10.1016/j.enganabound.2022.10.033
[11] Lv, W.J., Yang, Z.W., Liu, M.Z. (2007). Stability of Runge–Kutta methods for the alternately advanced and retarded differential equations with piecewise continuous arguments. Computers & Mathematics with Applications, 54(3): 326-335. https://doi.org/10.1016/j.camwa.2006.07.018
[12] Khader, M.M., Inc, M. (2021). Numerical technique based on the interpolation with Lagrange polynomials to analyze the fractional variable-order mathematical model of the hepatitis C with different types of virus genome. Chaos, Solitons & Fractals, 152: 111333. https://doi.org/10.1016/j.chaos.2021.111333
[13] Kumar, P., Erturk, V.S., Almusawa, H. (2021). Mathematical structure of mosaic disease using microbial biostimulants via Caputo and Atangana–Baleanu derivatives. Results in Physics, 24: 104186. https://doi.org/10.1016/j.rinp.2021.104186
[14] Dewiyanti, U., Noviantri, V., Rumagit, R.Y. (2023). Nonlinear system for cell population growth simulations in pulmonary tuberculosis infection. Procedia Computer Science, 216: 462-470. https://doi.org/10.1016/j.procs.2022.12.158
[15] Tulus, Rahman, M.M., Sutarman, Syahputra, M.R., Marpaung, T.J., Marpaung, J.L. (2023). Computational assessment of wave stability against submerged permeable breakwaters: A hybrid finite element method approach. Mathematical Modelling of Engineering Problems, 10(6): 1977-1986. https://doi.org/10.18280/mmep.100607
[16] Tulus, Marpaung, T.J., Marpaung, J.L. (2023). Computational analysis for dam stability against water flow pressure. Journal of Physics: Conference Series. https://doi.org/10.1088/1742-6596/2421/1/012013
[17] Mahdi, A.F., Asker, H.K., Al-Saiq, I.R. (2024). A deterministic mathematical dynamic system based on the PSITPS model for modeling the COVID-19 epidemic. Mathematical Modelling of Engineering Problems, 11(4): 872-882. https://doi.org/10.18280/mmep.110404
[18] Nainggolan, J., Ansori, M.F. (2024). Mathematical modeling and sensitivity analysis of COVID-19 and tuberculosis coinfection with vaccination. Mathematical Modelling of Engineering Problems, 11(1): 34-46. https://doi.org/10.18280/mmep.110104
[19] Chiquito, M., Clubley, S.K., Martinez-Almajano, S., Santos, A.P., Castedo, R., Lopez, L.M. (2023). Numerical and experimental study of unreinforced brick masonry walls subjected to blast loads. International Journal of Computational Methods and Experimental Measurements, 9(4): 296-308. https://doi.org/10.2495/CMEM-V9-N4-296-308
[20] Suwardi, A., Pratama, M.I., Rifandi, M., Sanusi, W., Side, S. (2020). Stability analysis and numerical simulation of SEIR model for pandemic COVID-19 spread in Indonesia. Chaos, Solitons and Fractals, 139: 110072. https://doi.org/10.1016/j.chaos.2020.110072
[21] Mahata, A., Paul, S., Mukherjee, S., Roy, B. (2022). Stability analysis and Hopf bifurcation in fractional order SEIRV epidemic model with a time delay in infected individuals. Partial Differential Equations in Applied Mathematics, 5: 100282. https://doi.org/10.1016/j.padiff.2022.100282
[22] Muñoz-La Rivera, F., Mora-Serrano, J., Oñate, E. (2023). Virtual reality for the creation of stories and scenarios for construction safety: Social distancing in the COVID-19 pandemic context. International Journal of Computational Methods and Experimental Measurements, 11(2): 105-114. https://doi.org/10.18280/ijcmem.110205
[23] Paul, S., Mahata, A., Mukherjee, S., Mali, P.C., Roy, B. Dynamical behavior of a fractional order SIR model with stability analysis. Results in Control and Optimization, 10: 100212. https://doi.org/10.1016/j.rico.2023.100212
[24] Waseel, F., Streftaris, G., Rudrusamy, B., Dass, S.C. (2024). Assessing the dynamics and impact of COVID-19 vaccination on disease spread: A data-driven approach. Infectious Disease Modelling, 9(2): 527-556. https://doi.org/10.1016/j.idm.2024.02.010
[25] Meng, X.Y., Cai, Z.Q., Si, S.B., Duan, D.L. (2021). Analysis of epidemic vaccination strategies on heterogeneous networks: Based on SEIRV model and evolutionary game. Applied Mathematics and Computation, 403: 126172. https://doi.org/10.1016/j.amc.2021.126172