Priyanka Tupe-Waghmare![]() | Sairam Vuppala Adithya
| Sairam Vuppala Adithya![]() | Navaneeth Bhaskar*
| Navaneeth Bhaskar*![]()
© 2024 The authors. This article is published by IIETA and is licensed under the CC BY 4.0 license (http://creativecommons.org/licenses/by/4.0/).
OPEN ACCESS
In this study, we have developed a multi-task model based on Convolutional Neural Network (CNN) to determine the isocitrate dehydrogenase (IDH) status and grade of gliomas brain tumours from T1-weighted (T1), T2-weighted (T2) and Fluid-Attenuated Inversion Recovery (FLAIR) images, both independently and utilizing stacked images. The study used information from the Cancer Genome Atlas (TCGA), which includes scans of grade III & IV tumours. Around 5546 MR images of individual modality and 1942 images of stacked modalities were processed from the original dataset. Popular CNN architectures like MobileNet, EfficientNetB0, EfficientNetB1, EfficientNetB2 and Xception models were implemented and used for the predictive analysis. A multi-task model has been developed to generate the grade and the IDH status from a single input image. Further, a user interface was developed using Python binding for Qt (PyQt) for checking the samples in real time without the help of medical experts. In comparison to all other models taken into account in this study, the EfficientNetB2 CNN model achieved the highest accuracy. For grade classification and IDH status classification on stacked images, the EfficientNetB2 CNN multi-task architecture achieved accuracy values of 99.4% and 99.6%, respectively. Accuracy scores of 99.7% and 99.8%, respectively, are obtained for grade classification and IDH status classification on individual images.
Convolutional Neural Network, deep learning, image processing, isocitrate dehydrogenase, gliomas, Magnetic Resonance Imaging, multi-task learning
The most common primary brain tumours are gliomas. Glial cells, which are supporting cells in the central nervous system, are the target for gliomas [1]. These tumours, which can be benign or malignant, can develop in different regions of the brain. The majority of adult brain tumours are gliomas. The pathophysiology of these tumours is exceedingly complex, and results are typically subpar despite extensive multimodal management that includes surgical resection, adjuvant radiation therapy, and chemotherapy with temozolomide [2]. Early tumour detection is crucial for the patient's survival as it helps to start the treatment at an early stage. One of the most significant recognized factors for predicting survival in glioma patients is the genotype of the enzyme isocitrate dehydrogenase (IDH) [3]. IDH is an enzyme that is important for cellular metabolism. Several malignancies, including gliomas and Acute Myeloid Leukaemia (AML), have been linked to mutations in the IDH genes. Gliomas are classified as low-grade (grade II) and high-grade (grade III and IV) gliomas based on their histological characteristics, prognosis, aggressiveness, and histological characteristics. Frequently occurring genetic changes in gliomas are the IDH mutations which is categorized as either positive (mutant) or negative (wildtype) for the various glioma subtypes.
Molecular testing techniques, such as Deoxyribonucleic Acid (DNA) sequencing or immunohistochemistry (IHC), are commonly used on tumour tissue samples to determine the IDH mutational status [4]. IHC is a technique that allows for the visualization and analysis of particular proteins or antigens present in tissue samples. These tests aid in determining whether or not particular IDH mutations are present, and they offer useful data for individualized treatment plans and prognosis analysis. These tests are considered the gold standard and assist in correct diagnosis by identifying the mutational status and the subtype. Despite being the gold standard, histopathology has some drawbacks, such as the potential for serious morbidity when the lesion occurs in the eloquent area [5]. Therefore, developing quantitative markers of genotype information from the patient's Magnetic Resonance Imaging (MRI) would not only allow for a non-invasive pre-operative prognosis of the mutational status, but would also enhance therapeutic intervention and allow for early patient-specific treatment planning.
Radiogenomics play an important role in noninvasively acquiring the molecular characteristics of the tumour from radio-phenotypical signatures extracted from the MR images. Radiomics features extracted from Fluid-Attenuated Inversion Recovery (FLAIR) hyperintense regions in addition to tumour magnitude and location have been usually employed to determine the status of IDH mutations [6]. Some popular radiomic features extracted from MRI and medical imaging in general include shape characteristics, volume characteristics, Gray Level Co-occurrence Matrix (GLCM), Gray Level Run Length Matrix (GLRLM), Gray Level Size Zone Matrix (GLSZM), Neighboring Gray Tone Difference Matrix (NGTDM) and Gray Level Dependence Matrix (GLDM) techniques. There are open-source tools like PyRadiomics which automate the process of radiomic feature extraction, aiding in medical imaging research.
IDH1 mutations are very common in grade II and III gliomas and are related to higher survival rates. Many studies have worked on delineating the IDH mutant from wildtype gliomas using several computational predictive measures on multimodal MRI and have delivered high accuracies of up to 95%. Furthermore, radiomics on diffusion kurtosis and fractional anisotropy-based diffusion models are also useful for identifying the mutational status. Significant results were demonstrated in the discrimination of Grade III and IV tumours using Antibody Drug Conjugate (ADC) modalities [7].
However, there are some issues observed with radiomics, and a critical one being the lack of interpretability. The radiomic features tend to have the least level of interpretability, which is highly in demand, especially in areas like healthcare. Also, the features are prone to noise and other variations in the input image [8]. Alternatively, automated feature extraction approaches like Convolutional Neural Networks (CNN) are robust to noise and provide interpretations (using explainable AI techniques), better than radiomics. This is one of the reasons for the research trend to transition into CNNs and other deep neural network architectures.
The field of healthcare has greatly benefited from artificial intelligence, particularly in the area of diagnosis. It serves as a tool for performing automated diagnoses and aiding physicians in strengthening their decisions. For this purpose, a number of machine learning and deep learning algorithms have been developed. CNNs in particular have demonstrated their potential and ability to automatically learn image features reducing the need for the time-consuming preliminary processing procedures required by radiomics-based approaches [9]. Several architectures of the CNN have been tested. One of the models with the highest level of stability is ResNet. Earlier studies using quantitative MRI-based analysis such as radiomics or CNNs although have illustrated great potential, have focused only on a single aspect, i.e., either grade, IDH mutation or other genotypes like Methylguanine Methyltransferase (MGMT) or 1p/19q codeletion [10].
The general challenge observed in research works related to glioma analysis are the usage of more MR imaging modalities and the need for multi-tasking. Many works focus on single tasks and use limited MR imaging modalities in their work. An efficient solution to this challenge is multi-task learning, which is the development of an algorithm that produces multiple outputs for provided inputs. This technique does multiple tasks parallelly, adding efficiency to the work. Some researchers have used this powerful technique to tackle the above-mentioned challenge in the area of glioma analysis. Chakrabarty et al. [11] developed a multi-task CNN model for the classification of IDH and 1p/19q code status from T1-weighted (T1), T2-weighted (T2) and FLAIR modality MRI images and achieved an accuracy of 0.925. Cheng et al. [12] developed a multi-task deep learning model for the segmentation of gliomas and classification of IDH status. Tupe-Waghmare et al. [13] worked on the development of a semi-supervised multi-task module for the classification of IDH, 1p/19q codeletion and MGMT status from T1, T2 and FLAIR MRI images and achieved 82.35% average test accuracies.
Inspired by these multi-task learning models, we have implemented a new deep learning multi-task CNN learning network for the automated classification of IDH status and grades of gliomas brain tumours from T1, T2 and FLAIR MRI images.
2.1 Subjects and dataset
The dataset consisted of T1, T2 and FLAIR images of 178 glioma cases from the Cancer Genome Atlas (TCGA) dataset [14]. This included 37 grade III (G3) scans with 28 IDH-mutant and 9 IDH-wildtype, and 34 grade IV (G4) scans with 4 mutant and 30 wildtypes. Our dataset included 24 adult patients with grade IV gliomas and 34 adult patients with grade III gliomas, confirmed via histology. The demographic information about the participant groups is given in Table 1.
Table 1. Demographical data of the subjects selected for the
|
Grade |
Age (years) |
Male:Female |
|
G3 (34) |
38.87 ± 10.98 |
21:13 |
|
G4 (24) |
48.8 ± 15.76 |
11:13 |
2.2 Pre-processing
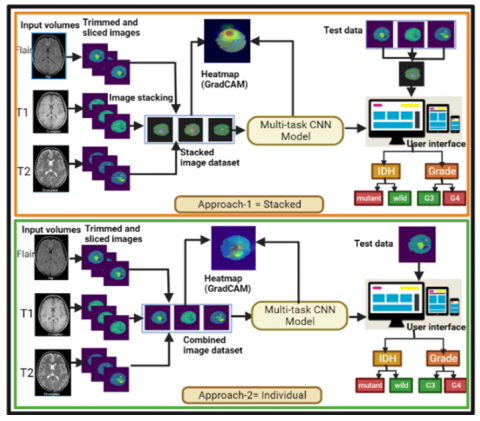
The volumes were obtained in the Neuroimaging Informatics Technology Initiative (NIFTI) format [15]. The open-source database comprises T1, T1-weighted contrast-enhanced (T1-CE), T2 and FLAIR modalities. From those, the T1, T2 and FLAIR modalities were considered for this work [16]. In order to focus on the areas with the tumour, the volumes were obtained and cropped. The volumes were then trimmed and converted to PNG images. The general workflow of the proposed work is shown in Figure 1. The two methodologies featured in the proposed study are stacking of the modalities and individual modalities. The T1, T2 and FLAIR modalities were put together into one dataset and in the other dataset a single image was created by stacking the T1, T2, and FLAIR images. The stacking operation was done using the NumPy library in Python. The total number of images used for each modality individually and for stacked modalities collectively is shown in Table 2.
Table 2. Details of the image dataset used in the work
|
Class/Modality |
Individual |
Stacked |
|
G3 mutant |
2496 |
832 |
|
G3 wild |
420 |
140 |
|
G4 mutant |
420 |
140 |
|
G4 wild |
2490 |
830 |
|
Total |
5466 |
1942 |
2.3 Model training and testing
In this work, a 7-layer multi-task CNN-based deep learning model is implemented to distinguish between Grade III and Grade IV glioma along with their IDH status. The multi-task model was designed with two different branches since there are two different tasks to be done. In this work, five CNN models - MobileNetV2, EfficientNetB0, EfficientNetB1, EfficientNetB2 and Xception were trained and implemented for making predictions [17, 18].
CNN generates an output that consists of the multiplication of one function and a shifted and reversed version of the other function [19, 20]. The core of the CNN layout is the convolution layer. The following equations describes how the kernel and the input are convoluted in CNN.
$f(n)=I(n) * k(n)$ (1)
$f_i(n)=\mathrm{I}(\mathrm{n}) \mathrm{k}(1)+\mathrm{I}(\mathrm{n}-1) \mathrm{k}(2)+\ldots+\mathrm{I}(0) \mathrm{k}(\mathrm{n})$ (2)
$f_i(n)=\sum_{l=-n}^n I(l+1) k(m-l+1)$ (3)
where, I represent the input signal, k represents the kernel, n and m represent the input signal and kernel lengths, and f represents the output signal.
Figure 1. Typical pipeline of the process workflow of the proposed work
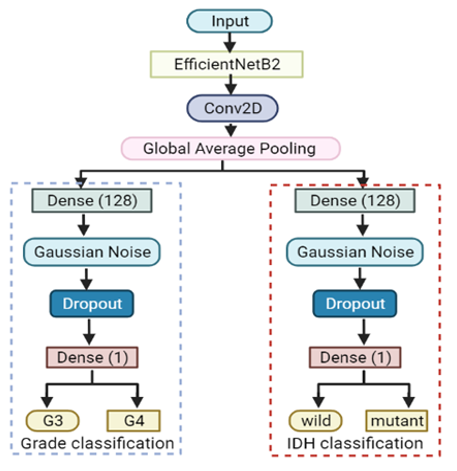
Figure 2. Architecture diagram of the proposed multi-task model
Along with the above-mentioned networks, a convolution layer with 32 neurons of size (1,1), and a global average pooling layer were added. Each unit comprises the dense layer with 128 neurons of Rectified Linear Unit (ReLU) activation function, the Gaussian noise layer with 0.15 standard deviation, the dropout layer with a drop rate of 0.15 and the output layer with 1 dense neuron of sigmoid activation function. Figure 2 represents the architecture diagram of the proposed deep learning multi-task model.
Choosing to employ a multi-task architecture is mostly based on efficiency. Due process efficiency is increased and time complexity is decreased by the network's simultaneous processing. The network branches, indicating that each task is decided upon individually, while the shared layers carry out the feature extraction. Training of the model is done on Nvidia GPU GTX 1060 processor board with 6 GB of internal memory. The convolutional operation in the initial layers of CNN captures primitive features such as edges and curves from the image. The latter layers learn to encapsulate complex features such as shapes and patterns yielding prediction probabilities for every class. To increase the robustness of the model and to prevent overfitting, augmentation methods involving rotating, flipping and shifting along height and width were used while training. Further, to gain insights into the most discriminative regions in the tumour slices, we have plotted activation maps using Gradient-weighted Class Activation Mapping (GradCAM) by calculating the gradients obtained from the last convolutional layer [21]. This operation results in the precise localization of the most distinguishing regions in the image.
The processed images were split into training and validation sets in the ratio of 80:20. The Adam optimizer along with binary cross entropy loss function were used to trained the multi-task network. The models were trained for 30 epochs using early stopping and ReduceLROnPlateu callbacks, and the batch size was set to 16 [22]. Based on how well the model performs on a validation set, ReduceLROnPlateau is designed to dynamically modify the learning rate while training.
2.4 Evaluation metrics
The model's performance was assessed using the test set's performance metrics. Model evaluation is one of the critical steps performed in the development of image classification systems. Major performance parameters like accuracy, precision, recall and Area under the Curve (AUC) values are calculated to evaluate the performance of the proposed multi-task model [23].
The accuracy, precision and recall are calculated using True Positive (TP), True Negative (TN), False Positive (FP) and False Negative (FN) values.
$Recall =\frac{T P}{T P+F N}$ (4)
$Precision =\frac{T P}{T P+F P}$ (5)
$Accuracy =\frac{T P+T N}{T P+F P+T N+F N}$ (6)
The most useful metric for assessing the performance of the classification model is accuracy. It is defined as the proportion of accurately predicted outcomes to all of the predictions. For every task and model, the Receiver Operating Characteristic (ROC) curves are also evaluated to analyze the performance [24].
In the studies pertaining to medical imaging, it is very crucial that the classifiers provide the clinical interpretability to the problem along with prediction with superior accuracy. The proposed study accounts for both the criterion. The performance metrics for the models on the training and testing sets for stacked images are shown in Tables 3 and 4, respectively. The performance values computed for training and testing sets for individual modalities are shown in Tables 5 and 6, respectively. Out of all models considered in this study, the most accurate prediction was made by the EfficientNetB2 model. Compared to other models, it has more layers and parameters, allowing it to recognize more intricate features and patterns in images.
Table 3. Training results for the multi-task model for stacked images
|
Sl. No. |
Model |
Task |
Accuracy |
Loss |
Precision |
Recall |
AUC |
|
1 |
MobileNetV2 |
Grade |
93.2 |
0.0069 |
95.4 |
92.4 |
0.97 |
|
IDH |
93.3 |
0.0064 |
94.6 |
93.1 |
0.97 |
||
|
2 |
EfficientNetB0 |
Grade |
95.4 |
0.0031 |
95.4 |
95.8 |
0.98 |
|
IDH |
95.6 |
0.0029 |
95.6 |
96.1 |
0.98 |
||
|
3 |
EfficientNetB1 |
Grade |
96.3 |
0.0023 |
97.65 |
97.1 |
0.99 |
|
IDH |
96.4 |
0.0020 |
98.14 |
98.4 |
0.99 |
||
|
4 |
Xception |
Grade |
98.7 |
0.0014 |
98.9 |
99.1 |
0.99 |
|
IDH |
98.3 |
0.0012 |
98.9 |
98.6 |
0.99 |
||
|
5 |
EfficientNetB2 |
Grade |
99.4 |
0.0022 |
99.8 |
99.5 |
1 |
|
IDH |
99.6 |
0.0023 |
99.75 |
99.9 |
1 |
Table 4. Testing results for the multi-task model for stacked images
|
Sl. No. |
Model |
Task |
Accuracy |
Loss |
Precision |
Recall |
AUC |
|
1 |
MobileNetV2 |
Grade |
93.8 |
0.0039 |
94.6 |
93.3 |
0.97 |
|
IDH |
93.5 |
0.0041 |
94.9 |
93.5 |
0.97 |
||
|
2 |
EfficientNetB0 |
Grade |
95.8 |
0.0026 |
96.2 |
96.3 |
0.98 |
|
IDH |
95.5 |
0.0027 |
96.4 |
95.9 |
0.98 |
||
|
3 |
EfficientNetB1 |
Grade |
96.9 |
0.0011 |
97.9 |
97.9 |
0.99 |
|
IDH |
96.7 |
0.0012 |
97.12 |
97.7 |
0.99 |
||
|
4 |
Xception |
Grade |
98.9 |
0.0011 |
100 |
100 |
1 |
|
IDH |
98.7 |
0.0009 |
100 |
100 |
1 |
||
|
5 |
EfficientNetB2 |
Grade |
100 |
0.0001 |
100 |
100 |
1 |
|
IDH |
100 |
0.0002 |
100 |
100 |
1 |
Table 5. Training results for the multi-task model for individual images
|
Sl. No. |
Model 3 |
Task |
Accuracy |
Loss |
Precision |
Recall |
AUC |
|
1 |
MobileNetV2 |
Grade |
94.9 |
0.0029 |
95.6 |
93.8 |
0.98 |
|
IDH |
94.95 |
0.0031 |
94.9 |
93.7 |
0.98 |
||
|
2 |
EfficientNetB0 |
Grade |
96.9 |
0.0016 |
98.2 |
97.9 |
0.99 |
|
IDH |
96.95 |
0.0017 |
98.4 |
96.2 |
0.99 |
||
|
3 |
EfficientNetB1 |
Grade |
97.5 |
0.0008 |
99.1 |
98.9 |
0.99 |
|
IDH |
97.7 |
0.0005 |
99.2 |
99.5 |
0.99 |
||
|
4 |
Xception |
Grade |
98.5 |
0.0008 |
99.8 |
99.8 |
0.99 |
|
IDH |
98.7 |
0.0005 |
100 |
100 |
1 |
||
|
5 |
EfficientNetB2 |
Grade |
99.8 |
0.00008 |
100 |
100 |
1 |
|
IDH |
99.9 |
0.00001 |
100 |
100 |
1 |
Table 6. Testing results for the multi-task model for individual images
|
Sl. No. |
Model 4 |
Task |
Accuracy |
Loss |
Precision |
Recall |
AUC |
|
1 |
MobileNetV2 |
Grade |
94.2 |
0.0059 |
94.4 |
92.7 |
0.98 |
|
IDH |
94.4 |
0.0054 |
94.6 |
93.3 |
0.98 |
||
|
2 |
EfficientNetB0 |
Grade |
96.2 |
0.0041 |
96.4 |
96.7 |
0.99 |
|
IDH |
96.3 |
0.0037 |
96.6 |
97.1 |
0.99 |
||
|
3 |
EfficientNetB1 |
Grade |
97.1 |
0.0023 |
98.9 |
99.1 |
0.99 |
|
IDH |
97.3 |
0.0021 |
98.1 |
98.3 |
0.99 |
||
|
4 |
Xception |
Grade |
98.1 |
0.0013 |
98.9 |
99.1 |
1 |
|
IDH |
98.3 |
0.0014 |
99.1 |
99.3 |
1 |
||
|
5 |
EfficientNetB2 |
Grade |
99.7 |
0.0019 |
99.8 |
100 |
1 |
|
IDH |
99.8 |
0.0024 |
99.8 |
100 |
1 |
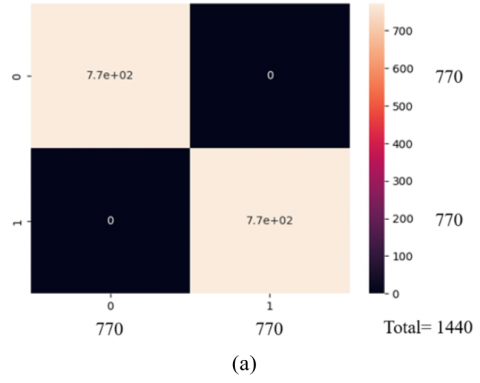
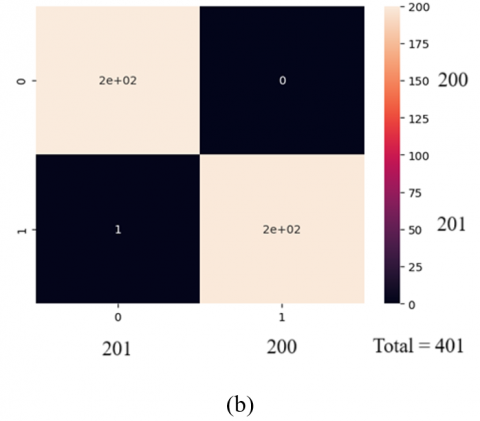
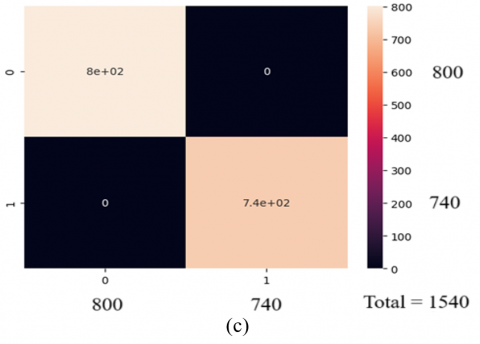
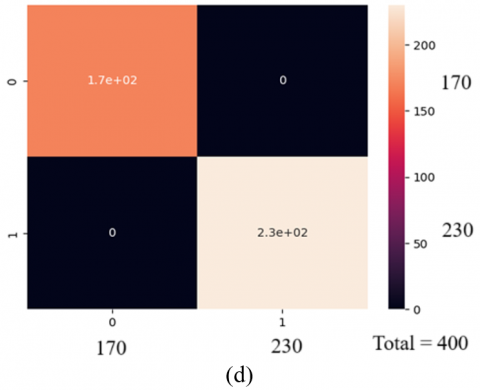
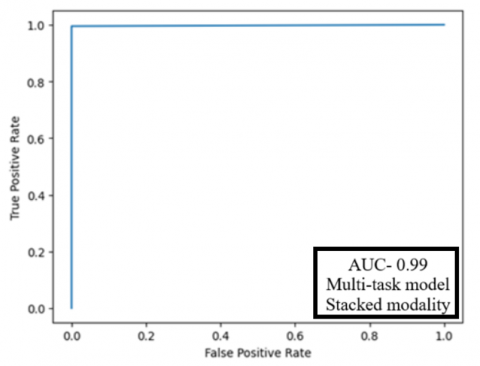
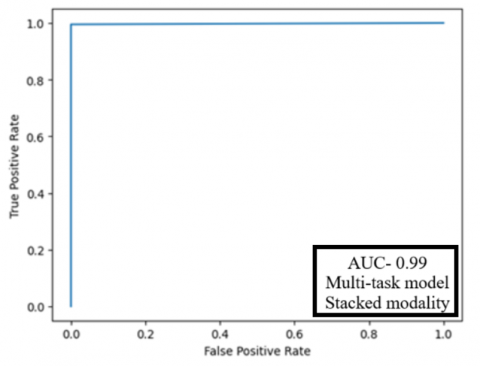
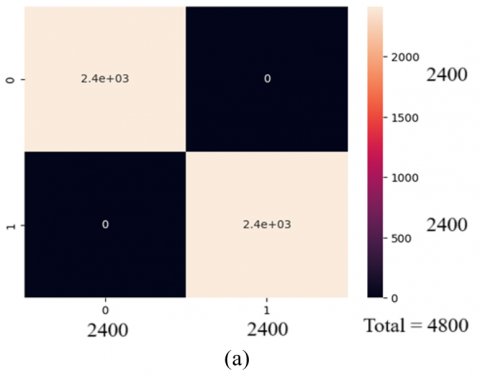
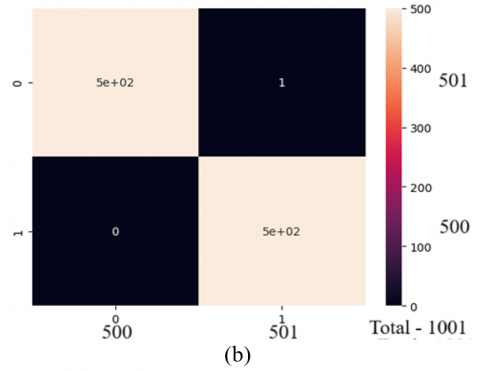
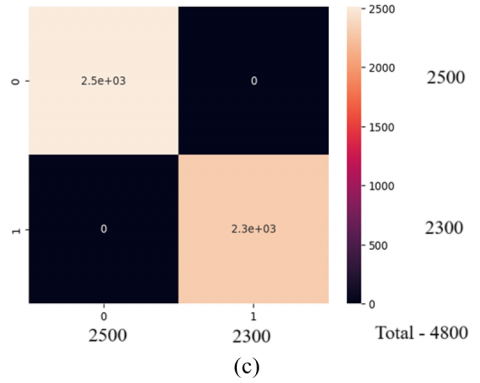
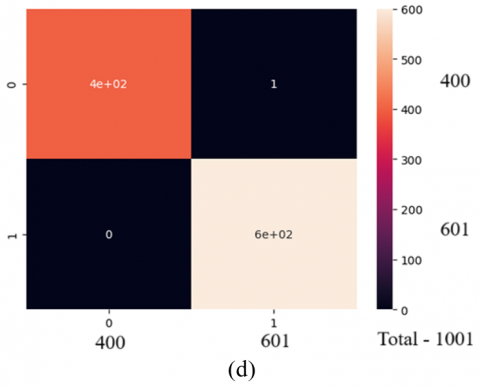
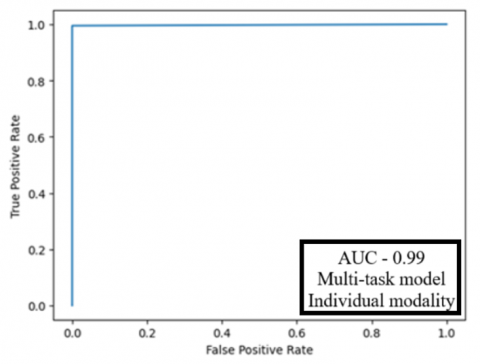
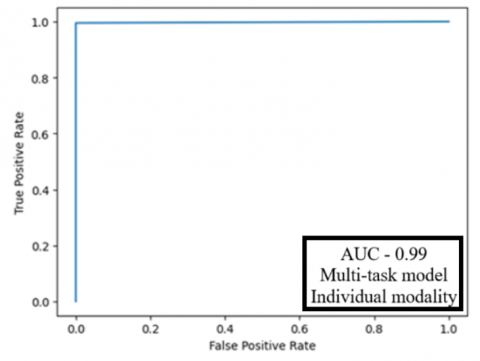
The confusion matrices produced for grade and IDH classification on the training and testing datasets for stacked modalities are shown in Figure 3. The AUC value, which is acquired by plotting the ROC curve, is evaluated in order to assess the model's performance. A greater value of AUC indicates better categorization performance, and it ranges from 0 to 1. Using the EfficientNetB2 model, we were able to classify grades and IDH for stacked modalities with AUC values of 0.9964 and 0.9972, respectively. Figure 4 displays the ROC curves for grade and IDH classification on the testing sets for stacked modalities. The confusion matrix generated for grade and IDH classification on training and testing sets for individual modality is displayed in Figure 5. The ROC curves for grade and IDH categorization on the testing sets for individual modalities are shown in Figure 6. The AUCs obtained for grade and IDH classification for individual modalities are 0.9986 and 0.9977, respectively. It is observed that the EfficientNetB2 architecture has performed the best out of all. One reason for its better performance can be the scaling convolutions present in its architecture, contributing to better training and generalization. Also, the model is light weight in comparison to others, accounting for less time and space complexities, making it ideal for deployment purposes.
Figure 3. Confusion matrices for grade and IDH classification on training and testing sets for stacked modalities: (a) Grade classification task on the training set; (b) Grade classification task on the testing set; (c) IDH classification task on the training set; (d) IDH classification task on the testing set
Figure 4. ROC curves for grade and IDH classification on training and testing sets for stacked modalities: (a) ROC curve for the grade classification task on the testing set; (b) ROC curve for the IDH classification task on the testing sets
Figure 5. Confusion matrices for grade and IDH classification on training and testing sets for individual modalities: (a) Grade classification task on the training set; (b) Grade classification task on the testing set; (c) IDH classification task on the training set; (d) IDH classification task on the testing set
Figure 6. ROC curves for grade and IDH classification on training and testing sets for individual modalities: (a) ROC curve for the grade classification task on the testing set; (b) ROC curve for the IDH classification task on the testing set
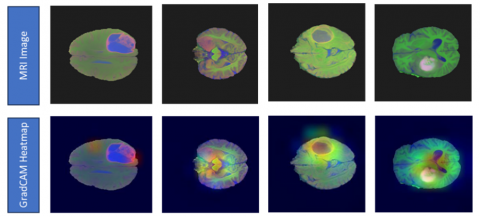
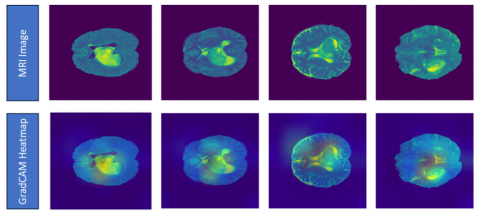
Activation mapping techniques are normally used in the medical field to visualize and analyze the activation patterns within the human body [25]. When an input image is fed to the model, the features are extracted and class activation maps are generated. These maps are used to understand where the model is focusing while classifying an image. In this study, we have used the GradCAM technique to enhance the visual explanation of CNN-based architectures. Feature information is extracted from the pre-max-pooling layers to generate an optimized class activation map. The gradients of the target class score concerning the feature maps of the last convolutional layer in the CNN are calculated using the GradCAM method. Relevant weights for each spatial position within the feature maps are then calculated using these gradients. A heat map that highlights the areas in the input image that are most important for the network's prediction is created by multiplying the feature maps by their respective weights and performing a global average pooling operation. Figures 7 and 8 show, respectively, the original MRI images and the matching heatmaps produced by the GradCAM technique using the EfficientNetB2 model for both stacked and individual modalities. On the heatmaps, it can be observed that red areas are the most focused and blue areas are the least concentrated.
Figure 7. Original MRI images and their corresponding heatmaps obtained through the GradCAM technique using the EfficientNetB2 model for stacked images
Figure 8. Original MRI images and their corresponding heatmaps obtained through the GradCAM technique using the EfficientNetB2 model for individual images
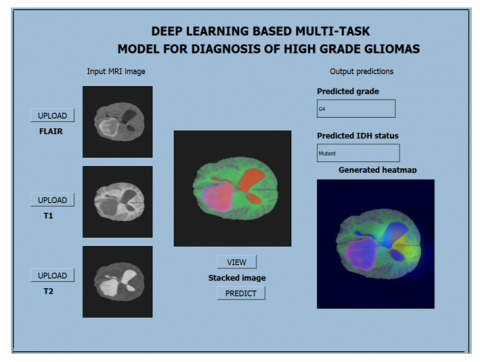
Additionally, a user interface is created to produce automatic predictions by processing and analyzing MR images. The interface provides tools and functionalities for uploading the image and checking the predictions. Real-time glioma diagnosis is made easier by the user interface. The user interface has been developed using the Python binding for Qt (PyQt) development tool [26]. The front end of the interface is developed using drag-and-drop options. The functions for the tools are written in Python in the backend. Two user interfaces have been developed in this work, where one is for the individual modalities and another is for the stacked modsalities. For individual modality, the user must provide an MRI image in their preferred modality (T1, T2, or FLAIR). The user must upload images for each of the three modalities for stacked modalities to work. After being uploaded, the images are automatically stacked, and the stacked image is then used as input by the trained model to forecast the results. Figure 9 displays a screenshot of the designed user interface, displaying the expected grade and IDH status. In our study, only 3 MRI modalities were utilized out of the 5500 images. Additionally, the network was trained only for the tasks of IDH prediction and grade. These factors will be taken into account in further work.
Figure 9. Screenshot of the user interface showing the predicted grade and IDH status
The goal of our work was to apply the advanced deep-learning CNN models with the highest prediction accuracy to categorize gliomas according to their grade and IDH status. The automated feature extraction of CNN alleviates the time-consuming pre-processing steps that are essential in radiomics-based methods. The developed multi-task classifier model has proven effective for the classification of high-grade gliomas. Out of all the backbones used in this work, the EfficientNetB2 backbone has produced the highest results. Our multi-task classifier model employed with EfficientNetB2 CNN demonstrated superior accuracy results of 99.4% for grade classification tasks and 99.6% for IDH status classification for stacked images, and 99.7% for grade classification and 99.8% for IDH status classification for individual images. The overall loss value for the stacked dataset was 0.0086 and 0.0043 for the individual dataset respectively. Also, the precision and recall values for the model on testing sets have reached 100% for both type of datasets. The developed model has produced very low loss values and very high accuracy, precision, recall and AUC values. The confusion matrices show that the model has not produced any false positive or false negatives, which is very important for medical tasks since the presence of false negatives in a medical diagnostic system can be detrimental. The ROC plots of the model are also good indicating that the model has not overfit. From the results of our studies, it is evident that the model's ability to learn the features of multiple tasks simultaneously can facilitate superior performance. Moreover, the class activation maps help in visualizing and interpreting the areas of an image that have the most impact on predictions. The designed user interface helps to carry out the task in real-time and can aid physicians in making predictions. The findings of this study are important as the prediction of IDH mutation and grade extracted from MRI images is crucial in the diagnosis and management of gliomas, as it provides important prognostic and predictive information. The proposed work can be useful for clinicians to rapidly and accurately identify the biomarker status (grade and IDH) from MR images, resulting in better glioma analysis and management. Future work may include the development of multi-modal neural network accepting multiple MRI modalities and producing multiple tasks. The proposed work has produced a generalized model with high accuracy and efficiency, resulting in a great computer aided diagnosis tool for clinicians in the area of glioma analysis.
[1] Liu, J., Chen, F., Pan, C., Zhu, M., Zhang, X., Zhang, L., Liao, H. (2018). A cascaded deep Convolutional Neural Network for joint segmentation and genotype prediction of brainstem gliomas. IEEE Transactions on Biomedical Engineering, 65(9): 1943-1952. https://doi.org/10.1109/TBME.2018.2845706
[2] Fiorica, F., Berretta, M., Colosimo, C., Stefanelli, A., Ursino, S., Zanet, E., Palmucci, T., Maugeri, D., Malaguarnera, M., Palmucci, S., Grasso, M., (2010). Glioblastoma in elderly patients: Safety and efficacy of adjuvant radiotherapy with concomitant temozolomide. Archives of Gerontology and Geriatrics, 51(1): 31-35. https://doi.org/10.1016/j.archger.2009.06.011
[3] Sun, Z., Wu, X., Tao, R., Zhang, T., Liu, X., Wang, J., Wan, H., Zheng, S., Zhao, X., Zhang, Z., Yang, P., (2023). Prediction of IDH mutation status of glioma based on terahertz spectral data. Spectrochimica Acta Part A: Molecular and Biomolecular Spectroscopy, 295: 122629. https://doi.org/10.1016/j.saa.2023.122629
[4] Zaha, D.C. (2014). Significance of immunohistochemistry in breast cancer. World Journal of Clinical Oncology, 5(3): 382-392. https://doi.org/10.5306/wjco.v5.i3.382
[5] Yang, Y., Chen, L., Ji, M. (2017). Stimulated Raman scattering microscopy for rapid brain tumor histology. Journal of Innovative Optical Health Sciences, 10(5): 1730010. https://doi.org/10.1142/S1793545817300105
[6] Berenguer, R., Pastor-Juan, M.D.R., Canales-Vázquez, J., Castro-García, M., Villas, M.V., Mansilla Legorburo, F., Sabater, S. (2018). Radiomics of CT features may be nonreproducible and redundant: Influence of CT acquisition parameters. Radiology, 288(2): 407-415. https://doi.org/10.1148/radiol.2018172361
[7] Leal, M., Sapra, P., Hurvitz, S.A., Senter, P., Wahl, A., Schutten, M., Shah, D.K., Haddish‐Berhane, N., Kabbarah, O., (2014). Antibody–drug conjugates: An emerging modality for the treatment of cancer. Annals of the New York Academy of Sciences, 1321(1): 41-54. https://doi.org/10.1111/nyas.12499
[8] Van Timmeren, J.E., Cester, D., Tanadini-Lang, S., Alkadhi, H., Baessler, B. (2020). Radiomics in medical imaging—“How-to” guide and critical reflection. Insights into Imaging, 11(1): 91. https://doi.org/10.1186/s13244-020-00887-2
[9] Navaneeth, B., Suchetha, M. (2019). PSO optimized 1-D CNN-SVM architecture for real-time detection and classification applications. Computers in Biology and Medicine, 108: 85-92. https://doi.org/10.1016/j.compbiomed.2019.03.017
[10] Takahashi, Y., Nakamura, H., Makino, K., Hide, T., Muta, D., Kamada, H., Kuratsu, J.I. (2013). Prognostic value of isocitrate dehydrogenase 1, O 6-methylguanine-DNA methyltransferase promoter methylation, and 1p19q co-deletion in Japanese malignant glioma patients. World Journal of Surgical Oncology, 11: 1-10. https://doi.org/10.1186/1477-7819-11-284
[11] Chakrabarty, S., LaMontagne, P., Shimony, J., Marcus, D.S., Sotiras, A. (2023). MRI-based classification of IDH mutation and 1p/19q codeletion status of gliomas using a 2.5 D hybrid multi-task Convolutional Neural Network. Neuro-Oncology Advances, 5(1): vdad023. https://doi.org/10.1093/noajnl/vdad023
[12] Cheng, J., Liu, J., Kuang, H., Wang, J. (2022). A fully automated multimodal MRI-based multi-task learning for glioma segmentation and IDH genotyping. IEEE Transactions on Medical Imaging, 41(6): 1520-1532. https://doi.org/10.1109/TMI.2022.3142321
[13] Tupe-Waghmare, P., Malpure, P., Kotecha, K., Beniwal, M., Santosh, V., Saini, J., Ingalhalikar, M. (2021). Comprehensive genomic subtyping of glioma using semi-supervised multi-task deep learning on multimodal MRI. IEEE Access, 9: 167900-167910. https://doi.org/10.1109/ACCESS.2021.3136293
[14] Cooper, L.A., Demicco, E.G., Saltz, J.H., Powell, R.T., Rao, A., Lazar, A.J. (2018). PanCancer insights from The Cancer Genome Atlas: The pathologist's perspective. The Journal of Pathology, 244(5): 512-524. https://doi.org/10.1002/path.5028
[15] Gorgolewski, K.J., Auer, T., Calhoun, V.D., et al. (2016). The brain imaging data structure, a format for organizing and describing outputs of neuroimaging experiments. Scientific Data, 3(1): 1-9. https://doi.org/10.1038/sdata.2016.44
[16] Xiong, Y., Khlif, M.S., Egorova-Brumley, N., Brodtmann, A., Stark, B.C. (2023). Neural correlates of verbal fluency revealed by longitudinal T1, T2 and FLAIR imaging in stroke. NeuroImage: Clinical, 38: 103406. https://doi.org/10.1016/j.nicl.2023.103406
[17] Mujeeb Rahman, K.K., Subashini, M.M. (2022). Identification of autism in children using static facial features and deep neural networks. Brain Sciences, 12(1): 94. https://doi.org/10.3390/brainsci12010094
[18] Moussafir, M., Chaibi, H., Saadane, R., Chehri, A., Rharras, A.E., Jeon, G. (2022). Design of efficient techniques for tomato leaf disease detection using genetic algorithm-based and deep neural networks. Plant and Soil, 479(1): 251-266. https://doi.org/10.1007/s11104-022-05513-2
[19] Olimov, B., Karshiev, S., Jang, E., Din, S., Paul, A., Kim, J. (2021). Weight initialization based‐rectified linear unit activation function to improve the performance of a Convolutional Neural Network model. Concurrency and Computation: Practice and Experience, 33(22): e6143. https://doi.org/10.1002/cpe.6143
[20] Bhaskar, N., Suchetha, M. (2019). An approach for analysis and prediction of CKD using deep learning architecture. In 2019 International Conference on Communication and Electronics Systems (ICCES), Coimbatore, India, pp. 1660-1664. https://doi.org/10.1109/ICCES45898.2019.9002214
[21] Shinde, S., Tupe-Waghmare, P., Chougule, T., Saini, J., Ingalhalikar, M. (2021). Predictive and discriminative localization of pathology using high resolution class activation maps with CNNs. PeerJ Computer Science, 7: e622. https://doi.org/10.7717/peerj-cs.622
[22] Iyer, S.G., Pawar, A.D. (2018). GPU and CPU accelerated mining of cryptocurrencies and their financial analysis. In 2018 2nd International Conference on I-SMAC (IoT in Social, Mobile, Analytics and Cloud) (I-SMAC) I-SMAC (IoT in Social, Mobile, Analytics and Cloud) (I-SMAC), 2018 2nd International Conference on, Palladam, India, pp. 599-604. https://doi.org/10.1109/I-SMAC.2018.8653733
[23] Sam, S.M., Kamardin, K., Sjarif, N.N.A., Mohamed, N. (2019). Offline signature verification using deep learning Convolutional Neural Network (CNN) architectures GoogLeNet inception-v1 and inception-v3. Procedia Computer Science, 161: 475-483. https://doi.org/10.1016/j.procs.2019.11.147
[24] Bhaskar, N., Bairagi, V., Boonchieng, E., Munot, M.V. (2023). Automated detection of diabetes from exhaled human breath using deep hybrid architecture. IEEE Access. https://doi.org/10.1109/ACCESS.2023.3278278
[25] Sivanandan, R., Jayakumari, J. (2021). A new CNN architecture for efficient classification of ultrasound breast tumor images with activation map clustering based prediction validation. Medical & Biological Engineering & Computing, 59: 957-968. https://doi.org/10.1007/s11517-021-02357-3
[26] Yang, X., Yang, D., Huang, C. (2021). An interactive prediction system of breast cancer based on ResNet50, chatbot and PyQt. In 2021 2nd International Seminar on Artificial Intelligence, Networking and Information Technology (AINIT), Shanghai, China, pp. 309-316. https://doi.org/10.1109/AINIT54228.2021.00068