Mahmood K. Al-Obaidi *![]() | Alaa H. Abed
| Alaa H. Abed![]()
© 2024 The authors. This article is published by IIETA and is licensed under the CC BY 4.0 license (http://creativecommons.org/licenses/by/4.0/).
OPEN ACCESS
Two-dimensional digital image analysis (DIA) considered a cost-effective method for characterizing the microstructure of asphalt mixtures. In this study, a more sophisticated method for defining the internal structure of aggregates was utilized to reveal performance-related properties that serve as quality indicators of mixtures. Software architecture-wise, Avizo19 is both modular and object-oriented has been used in this study. Modules and data objects are its key components. Metadata can be identified as or computational actions performed using modules. The study's goal is to assess the influence of laboratory vs. field compaction on the engineering qualities of several kinds of aggregates in different locations in central, northern, and southern Iraq including AlDoz, AlNibaa'e, Dyala, Jalawlaa, AlKut, AlSimawa, and Southern AlRumela quarries. Aviso analysis have been classified into two groups of parameters: geometric forms involving geometry, shape, and texture indicators, also the internal structure of aggregate interlocking, including orientation, anisotropy, homogeneity, and directional distribution of aggregate. The results of statistical comparisons of average, standard deviation (SD), and coefficient of variation (CoV) demonstrate the fact that the Roller compacting approach predicts the asphalt mixture formation indicators more significantly than the Marshall technique and is most effective within field compaction.
digital image analysis, two-dimensional, Marshall compaction, roller compaction, field compaction, orientation, internal structure, coefficient of variance
The components of asphalt concrete include aggregates, air voids, and asphalt binder, making it a highly heterogeneous material. Therefore, numerous elements, such as asphalt binder, aggregate morphology, and degree of compaction, affect the internal structure of AC material. Asphalt binder connects graded aggregate particles. Asphalt concrete mixes' physical and mechanical qualities rely on their ingredients' quantity and properties. Mixture performance depends on the aggregate shape, orientation, and gradation [1]. Angular particles stabilize HMA because to internal friction and aggregate interlock. HMA with round aggregate particles like natural sands and gravels is more workable and needs less compaction to obtain density. HMA microstructure impacts mixtures. Experimental microstructure characterization determines HMA macroscopic behavior. Quantify material macroscopic response's microstructure distribution effects [2].
The compaction process used during production may change several aspects that affect asphalt mix performance, including aggregate orientation and contact points. When two aggregate constituents are separated by a constant distance, a contact point may be established. Contact points affect mixture stiffness, which may lead to fractures, fatigue, and irreversible failure mode in hot mix asphalt's mechanical properties [3]. The relation between in-lab and on-site compaction techniques is always under study. Pavement experts have known for a long time that the density alone is not sufficient to describe asphalt mix performance since various laboratory compaction procedures produce volumetrically equivalent but structurally diverse specimens. There has been little progress toward a unified opinion over which laboratory technique most closely simulates field compaction. Scientists believe that the aggregate structure inside the compacted mixture is significantly influenced by the compaction approach [4].
Digital image analysis (DIA) uses advanced computer technology to gather important data. Several new civil engineering studies and fields utilize it. Current image analysis systems can quickly measure each feature's area, perimeter, length, and orientation, making DIA excellent for analyzing aggregate properties [5].
Imaging can describe asphalt mixture microstructure, according to research studies. Despite extensive study and technology advances for capturing digital photographs of asphalt mixes, various image processing method and technique challenges remain. Two-dimensional imaging is cheaper than three-dimensional (3-D) research for characterizing asphalt concrete. Simple indices like contact number and aggregation orientation were assessed using 2-D imagery [6, 7].
The objective of this study is to predict the influence of different compaction methods on aggregate parameters of asphalt mixtures using an advanced 2D digital image analysis technique. Samples were obtained from seven locations in Iraq and compacted using Marshall and Roller methods and compared to the field method. Software Aviso19 was utilized to derive parameters geometric forms, that includes geometry, shape, and texture evidence, and aggregate interlocking structure, including orientation, anisotropy, homogeneity, and directional distribution. to characterize the aggregates. Statistical analysis was performed to compare the results from the different compaction approaches.
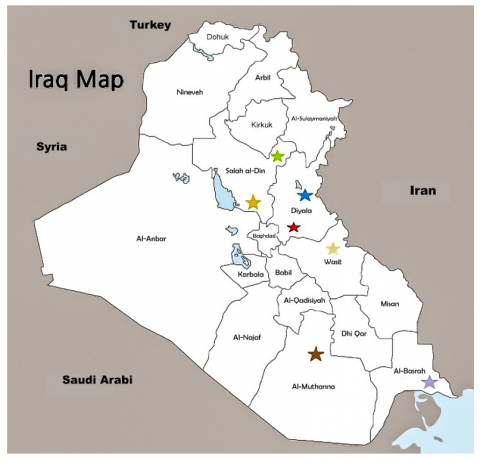
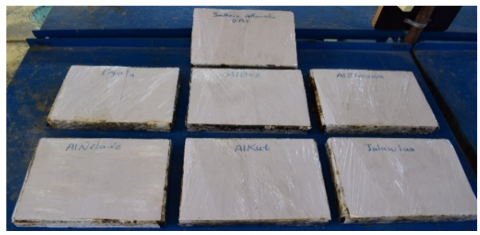
The paper's priorities are to characterize the aggregates brought from seven sources in Iraq as shown in Figure 1, used in the production of hot mix asphalt by, among other properties, describing the distribution of aggregate in asphalt mixes using DIA, intending to match laboratory compaction methods with those actually occurring in the field, and quantitatively realizing the 2D orientations of aggregate particles with a diameter greater than or equal to 2.36 mm. The following methodology in research was used to achieve this goal:
3.1 Materials
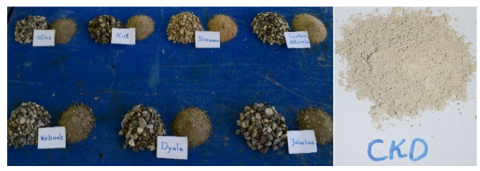
Crushed coarse and fine aggregates were obtained from various sources in Iraq. It comprises firm, stiff grains, free from loam and other harmful components. As indicated in Figure 1, seven queries have been used to finish this study. AlDoz, AlNibaa'e, Dyala, Jalawlaa, AlKut, AlSimawa, and Southern AlRumela quarries’ aggregate physical parameters are shown in Tables 1 and 2 and Figure 2. All parameter conducted to standards of the State Corporation of Roads and Bridges, SCRB (2003/R9) [8] and ASTM. The tests were conducted in National Centre for Construction Laboratories and Research (NCCLR) in Baghdad.
The Karbala cement manufacturing factory, a part of the French Lafarge company, provided the light grey cement kiln dust (CKD) as a filler as shown in Figure 2. It has attempted the dry process. The physical parameters are shown in Table 3. In this study, 7% of CKD filler is employed.
Figure 1. A map of Iraq displaying aggregate sources
Figure 2. Types of aggregates sources and the CKD filler
AlDaurah refinery supplied asphalt cement (AC) with a penetration grade of 40-50, which was utilized as a binder in the blends. After a series of tests, it was found to meet the requirements of the State Corporation of Roads and Bridges, SCRB (2003/R9) [8]. Asphalt cement's physical parameters are listed in Table 4.
Table 1. Physical parameters of quarries’ coarse aggregate
|
Parameter |
AlDoz |
AlNibaa'e |
Dyala |
Jalawlaa |
AlKut |
AlSimawa |
Southern AlRumela |
ASTM Standards |
|
Bulk Specific Gravity |
2.624 |
2.584 |
2.620 |
2.652 |
2.590 |
2.530 |
2.650 |
(≥2.5) C127-01 [11] |
|
Apparent Specific Gravity |
2.639 |
2.608 |
2.652 |
2.693 |
2.635 |
2.610 |
2.700 |
(≥2.6) C127-01 [11] |
|
Water Absorption, % |
0. 51 |
0.57 |
0.87 |
0.763 |
0.425 |
1.970 |
1.100 |
(≤2%) C127-01 [11] |
|
Los Angeles Abrasion, % |
12.16 |
13.08 |
18.18 |
19.00 |
17.60 |
26.00 |
13.08 |
(≤28%) C131-03 [12] |
Table 2. Physical parameters of quarries’ fine aggregate
|
Parameter |
AlDoz |
AlNibaa'e |
Dyala |
Jalawlaa |
AlKut |
AlSimawa |
Southern AlRumela |
ASTM Standards |
|
Bulk Specific Gravity |
2.635 |
2.604 |
2.753 |
2.541 |
2.647 |
2.630 |
2.600 |
(≥2.4) C128-04 [13] |
|
Apparent Specific Gravity |
2.645 |
2.664 |
2.764 |
2.702 |
2.670 |
2.680 |
2.650 |
(≥2.5) C128-04 [13] |
|
Water Absorption, % |
2.667 |
1.419 |
1.729 |
1.420 |
0.549 |
2.800 |
0.930 |
(≤3%) C128-04 [13] |
Table 3. Physical parameters of CKD filler
|
Parameter |
Results |
ASTM Standards |
|
Bulk Specific Gravity |
3.14 |
(≥2.6) ASTM D854 [9] |
|
Passing Sieve (No. 200), % |
96 |
(≥90) ASTM C117 [10] |
Table 4. Physical parameters of AC
|
Parameter |
Test Condition |
Results |
SCRB Limits |
ASTM Standards |
|
Penetration |
25℃, 100 gm, 5 sec, (0.1 mm) |
45 |
40 -50 |
D5 – 13 [14] |
|
Softening Point |
5℃/min |
49 |
- |
D36 – 95 [15] |
|
Ductility |
25℃, 5 cm/min |
+ 150 |
≥100 |
D113 – 07 [16] |
|
Specific Gravity |
25℃ |
1.04 |
- |
D70 – 08 [17] |
|
Flash Point |
- |
290 |
≥232 |
D92 – 16 [18] |
|
Rotational Viscometer, Pa.sec |
135℃ |
0.6 |
≤ 3 |
D4402 – 15 [19] |
|
Rotational Viscometer, Pa.sec |
165℃ |
0.144 |
- |
D4402 – 15 [19] |
|
After TFOT Properties D1754 – 97 |
||||
|
Retained Penetration of Residue, % |
25℃, 100 gm, 5 sec, (0.1 mm) |
60 |
≥55 |
D5 – 13 [14] |
|
Ductility of Residue, cm |
25℃, 5 cm/min |
85 |
≥25 |
D113 – 07 [16] |
|
Loss on Weight |
163℃, 50 gm, 5 hr |
0.3 |
- |
- |
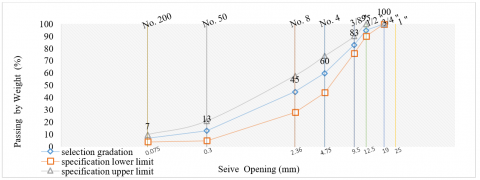
Figure 3. Limits of aggregate gradation with standards
The SCRB (2003) [8] standard for the aggregate gradation of wearing course (type ш A) with 12.5 (mm) NMAS was followed in this study. Figure 3 illustrates the aggregate gradation proportions that has been chosen, where the main mixes were employed which was a control mix that met the specification's midpoint.
3.2 Preparation of asphalt mixtures
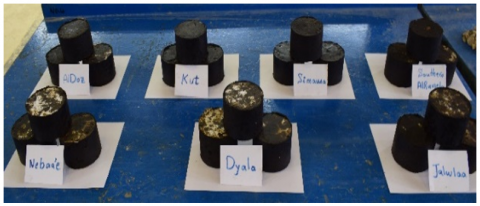
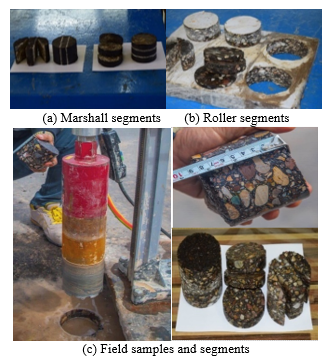
Using the Marshall mix design, 84 samples were prepared with 4, 4.5, 5, and 5.5% of asphalt content to establish the optimal amount of HMA mixes for all aggregate sources. The analysis of optimum asphalt contents illustrated in Table 5. Twenty-one asphalt samples (10 cm in diameter and 6.35 cm in thickness) were prepared using a Marshall compactor per AASHTO/R68 [20] in view of the fact that there is a high volume of traffic (75 blows per sample face) as shown in Figure 4. In addition, two distinct compaction procedures were used to create alternative asphalt specimens. To identify the impact of confinement on the morphological properties of aggregate and its orientations, seven slab specimens (40 by 30 cm) and (5cm in height) were also manufactured using a roller compactor per EN 12697-33 [21] as shown in Figure 5, with varying compaction energies using a vertical load of 5 kN and vibration at 10 bar and 1200 Nl/min of air supply to achieve the same density of Marshall samples. 58, 72, 64, 52, 62, 60, and 67 rollers’ cycles have been achieved for AlDoz, AlNibaa'e, Dyala, Jalawlaa, AlKut, AlSimawa, and Southern AlRumela aggregate. The cored samples shown in Figure 6.
Table 5. Physical parameters of Marshall samples
|
Property |
AlDoz |
AlNibaa'e |
Dyala |
Jalawlaa |
AlKut |
AlSimawa |
Southern AlRumela |
SCRB Standards [8] |
|
Stability, kN |
11.5 |
11.8 |
11.1 |
11.4 |
11.2 |
11.0 |
9.6 |
≥8 |
|
Flow, mm |
2.00 |
2.15 |
2.37 |
2.16 |
2.25 |
2.32 |
2.03 |
2-4 |
|
Bulk Density, gm/cm3 |
2.339 |
2.357 |
2.352 |
2.327 |
2.340 |
2.336 |
2.356 |
- |
|
AV, % |
3.6 |
4.0 |
3.9 |
4.0 |
4.5 |
4.4 |
3.0 |
3-5 |
|
VMA, % |
16.10 |
14.28 |
17.70 |
15.25 |
15.90 |
14.84 |
15.10 |
≥14 |
|
VFA, % |
77.5 |
72.0 |
78.0 |
74.0 |
72.0 |
70.0 |
81.0 |
70-85 |
|
OAC, % |
4.8 |
4.8 |
5.0 |
4.8 |
4.9 |
4.9 |
4.8 |
4-6 |
Figure 4. Prepared samples by Marshall compaction
Figure 5. Prepared slabs by roller compactor in lab
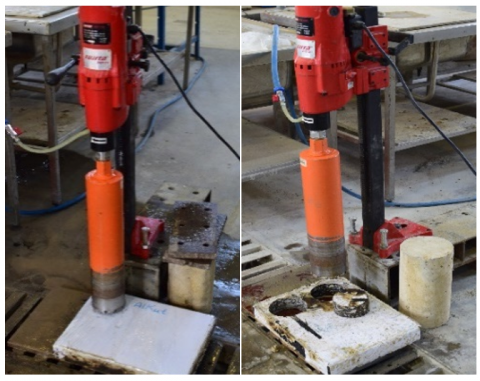
Figure 6. Pre-and post-coring samples in lab
In addition, field cores of the exact dimensions were supplied per ASTM D5361 [22] from a segment of roadway pavement in Baghdad-Alkut Highway that had been compacted using a conventional vibratory steel roller followed by a rubber-tire roller, so that the aggregate spatial of mixes could has been compared in related to the effect of compaction modes.
3.3 Procedure of digital image analysis (DIA)
DIA procedures can characterize and study random heterogeneous materials like asphalt mixes. A digitally transformed picture is a two-dimensional independent function, f(x, y), where f is the function of colour intensity and yields the image's colour intensity at that position (x, y). Each pixel's position and intensity value make up the digital picture [23]. Studies on asphalt mixture have often looked at it as either a two- or three-phase material [24-26]. Some of the first work on determining material attributes, including gradation, aggregate distribution, shape, and orientation from asphalt binders and mixes, was reported by Zhong et al. [27] utilizing DIA methods.
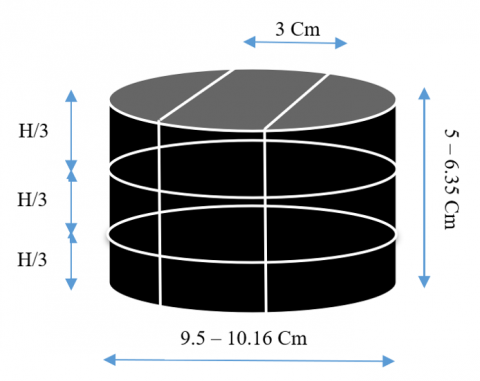
Figure 7. The proposed vertical and horizontal segments
3.3.1 Preparing and acquiring an image segment
All field cores and specimens in laboratory were prepared and segmented using a mechanical rotary saw vertically and horizontally into three parts, and images were taken on both sides of the middle part as shown in Figures 7 and 8. In this study, a Nikon D5300 camera with 24.1 megapixels and a 50 mm micro-lens was utilized in the DIA process. without making any adjustments for illumination.
The JPG. picture might be pixels or points. For the white, black, and colour prints (4000 by 6000 pixels (1 mm=34.8 pixels)), each pixel has three digital magnitudes denoting X, Y, and colour intensity or grey level. Imaging was done on a white background to better contrast mixed aggregate and background pixels. Medium-light was used for testing. AVISO software, was then utilized.
Figure 8. V-H segments (Different compaction methods)
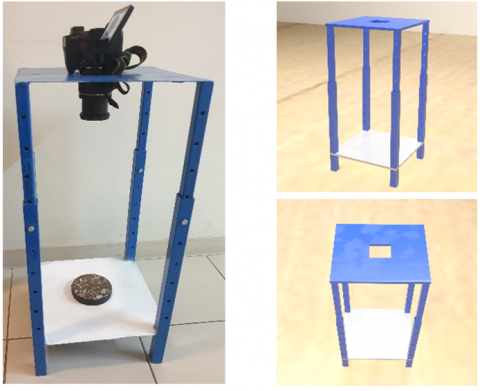
The manufactured frame as shown in Figure 9 consists of a top and a bottom plate made of steel. The top plate is a perfect square (30 cm×30 cm) with a hole cut out in the centre for the camera. The white base plate similarly measures 30cm by 30cm. The height scale starts at 0 cm and goes up to 50 cm, allowing the user to set and adjust the height at which the picture is captured. The equipment used to image the particles in this work was modified by placing the camera on a manufacturer's steel stand, and by adjusting the camera's height (50 cm) to provide adequate detection throughout the region of the separated aggregate.
Figure 9. Manufactured steel frame (Images calibration)
3.3.2 AVISO software and image analysis
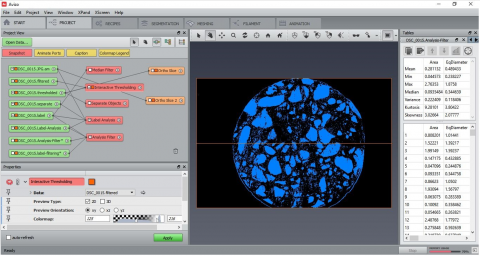
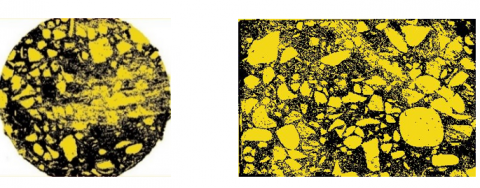
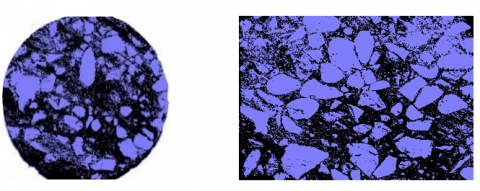
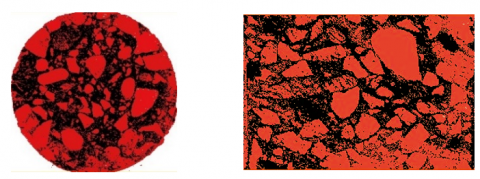
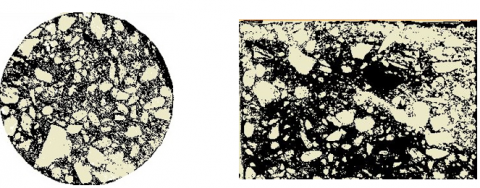
AVISO, a program which is used for processing and analysing photos. The German Climate Computing Centre originated and coordinates Avizo, a software that began in 2007 with a focus on physical sciences and industrial applications and has now been expanded to include earth science applications. It was used on every picture to determine what each one was worth and include. Conveying how evenly particles are dispersed in the sample region under study. The AVISO application, version 2019.1, was used to do an analysis on the obtained data. Figure 10 shows a screenshot of the AVISO program's backdrop, displaying the phases of the analysis process and the vertical and horizontal V-H segmentation for the actual and processed images from all of the study's sources taken separately. The four phases for quantitative analysis process as follows:
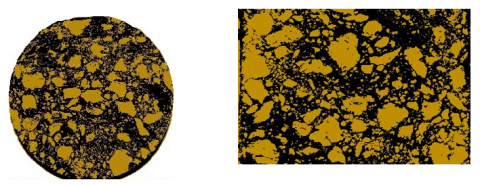
(a) The Screenshot displaying the process of DIA using AVISO software
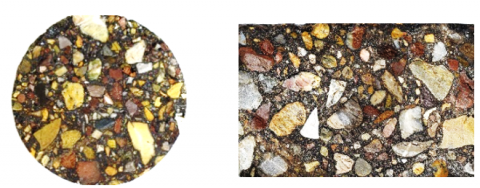
(b) Real images of horizontal and vertical segments
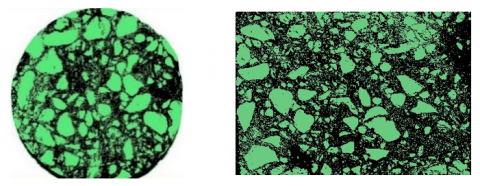
(c) Processed V-H segments for AlDoz Quarry
(d) Processed V-H segments for AlNibaa’e Quarry
(e) Processed V-H segments for Dyala Quarry
(f) Processed V-H Segments for Jalawlaa Quarry
(g) Processed V-H Segments for AlKut Quarry
(h) Processed V-H segments for AlSimawa Quarry
(i) Processed V-H segments for S. AlRumela Quarry
Figure 10. AVISO process and DIA results for different aggregate quarries
4.1 Aspects of aggregates’ geometric forms
4.1.1 Geometric indicators of aggregate
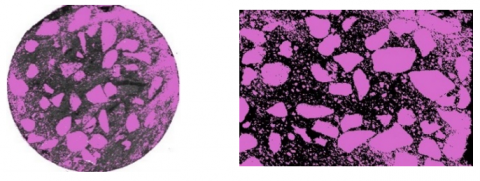
As mentioned earlier, the DIA could be used to quantify morphological indicators characterizing the geometry of an aggregate cross-sectional area. Numerous researches have examined the typical Area (Ac), Equivalent diameter (ED), and Feret Diameter (FD) [28-30]. In addition, a newly calculated Crofton Perimeter (CP) has been employed to assess this study's findings accurately. ED is the diameter of the disc of the same area, which is calculated as in Eq. (1):
$E_D=\sqrt{\frac{4 A_c}{\pi}}$ (1)
Figure 11. Analysis of aggregate’s geometric indicators
In all directions [0o-180o], Accurate CP, producing by an average value of 8 Var-Diameter measured as the product of intercepts by distance between interception nodes. FD can be estimated as the separation of two tangents of the particles that run parallel to one another. Based on Eqs. (2) and (3), the principles for the two indicators are shown in Figure 11.
$C_p=\propto a N_o+\left(\frac{\pi}{2}-\propto\right) b N_{90}+\frac{\pi}{4} c\left(N_{\infty}-N_{\pi-\alpha}\right)$ (2)
Cauchy's Formula is used to construct the aforementioned equation, where the N is the intercept count along the directions 0o, 90o, α, and α-π. a, b and c are the distances between horizontal, vertical, and diagonal lines as well.
$F_D=\frac{C_p}{\pi}$ (3)
AVISO characterizes aggregate two-dimensional morphology. Seven aggregate sources are specifically selected. The geometric indicators of their projected two-dimensional images are quantified, as shown in Table 6.
Geometric indices are often used as a start in specifying other characteristics. Because of differences in compaction conditions, the amount of the geometric indications may vary. Consequently, the coefficient of variation (CoV) is employed in the analysis to quantify the degree of dispersion of the average DIA findings of vertical and horizontal segmentation of various aggregate sources. Geometrical indicators were evaluated, and the results of the standard deviation and variation coefficient of the Ac, ED, CP, and FD were provided to investigate the correlation between the variability of the two-dimensional outline index of the different aggregates under various compaction approaches.
Compared to the Field compaction approach, all vertical segmentation parameters for Marshall compaction have decreased by 29, 17, 20, and 18%, respectively, and for Roller compaction by 32, 21, 12, and 15%. The CoV data revealed that Marshall compaction had a more significant degree of variability for the Ac and ED indicators than roller compaction. However, for the CP and FD indicators, Roller compaction had lower variations than Marshall compaction.
In contrast to the Field compaction method, all horizontal segmentation parameters for Marshall compaction have been increased by 31, 20, 1, and 10%, while Roller compaction has been raised by 6, 4%, and dropped by 4, 1%. According to the conclusions of the CoV, Marshall compaction has more considerable variability than roller compaction when all indicators are evaluated. Increasing the average portion of aggregate indicators increases the probability of contact points and interference between the aggregate during the compaction process.
The overall statistics of two segmentations and according to the preceding results, relying on roller compaction results, the AlNibaa'e, AlDoz, Southern AlRumela, Alsimawa, AlKut, Jalawlaa, and Dyala aggregate sources are considered in that sequence from the different kinds of aggregate sources due to their relative values that are closer to the average and possess a lower standard deviation. Even so, it is still challenging to describe the morphological aspects of the aggregate using only one parameter of the two-dimensional geometric index. Thus, additional complicated indices will be studied to guarantee the reliability of results.
Table 6. Geometric indicators for all quarries under different methods of compactions
|
Vertical Segmentation |
||||||||||||
|
Comp. Method |
Marshall |
Roller |
Field |
Marshall |
Roller |
Field |
Marshall |
Roller |
Field |
Marshall |
Roller |
Field |
|
Indicators |
Ac, cm2 |
ED, cm |
CP, cm |
FD, cm |
||||||||
|
AlDoz |
0.40 |
0.37 |
0.72 |
0.61 |
0.57 |
0.83 |
2.45 |
3.11 |
3.56 |
0.74 |
0.80 |
1.02 |
|
AlNibaa’e |
0.45 |
0.38 |
0.65 |
0.57 |
2.69 |
3.30 |
0.81 |
0.83 |
||||
|
Dyala |
0.38 |
0.46 |
0.58 |
0.64 |
2.41 |
2.98 |
0.73 |
0.83 |
||||
|
Jalawlaa |
0.52 |
0.49 |
0.70 |
0.66 |
2.88 |
3.15 |
0.75 |
0.87 |
||||
|
AlKut |
0.59 |
0.83 |
0.75 |
0.90 |
3.16 |
3.68 |
0.90 |
1.09 |
||||
|
AlSimawa |
0.67 |
0.46 |
0.81 |
0.64 |
3.28 |
2.76 |
1.03 |
0.82 |
||||
|
S. AlRumela |
0.56 |
0.43 |
0.73 |
0.62 |
2.99 |
3.01 |
0.87 |
0.82 |
||||
|
Average |
0.51 |
0.49 |
|
0.69 |
0.66 |
|
2.84 |
3.14 |
|
0.83 |
0.87 |
|
|
SD |
0.11 |
0.16 |
|
0.08 |
0.11 |
|
0.34 |
0.29 |
|
0.11 |
0.10 |
|
|
CoV, % |
21 |
32 |
|
12 |
17 |
|
12 |
9 |
|
13 |
12 |
|
|
Horizontal Segmentation |
||||||||||||
|
AlDoz |
0.58 |
0.43 |
0.42 |
0.73 |
0.61 |
0.60 |
3.07 |
3.39 |
3.24 |
0.95 |
0.82 |
0.83 |
|
AlNibaa’e |
0.60 |
0.46 |
0.76 |
0.64 |
3.22 |
2.90 |
0.91 |
0.85 |
||||
|
Dyala |
0.72 |
0.37 |
0.85 |
0.56 |
3.45 |
2.91 |
1.01 |
0.72 |
||||
|
Jalawlaa |
0.50 |
0.39 |
0.69 |
0.58 |
2.93 |
2.95 |
0.81 |
0.78 |
||||
|
AlKut |
0.41 |
0.53 |
0.60 |
0.68 |
2.81 |
3.39 |
0.77 |
0.89 |
||||
|
AlSimawa |
0.57 |
0.47 |
0.74 |
0.64 |
4.78 |
3.29 |
1.07 |
0.86 |
||||
|
S. AlRumela |
0.47 |
0.47 |
0.67 |
0.65 |
2.76 |
3.04 |
0.86 |
0.83 |
||||
|
Average |
0.55 |
0.45 |
|
0.72 |
0.62 |
|
3.29 |
3.12 |
|
0.91 |
0.82 |
|
|
SD |
0.10 |
0.05 |
|
0.08 |
0.04 |
|
0.70 |
0.22 |
|
0.11 |
0.06 |
|
|
CoV, % |
18 |
12 |
|
11 |
7 |
|
21 |
7 |
|
12 |
7 |
|
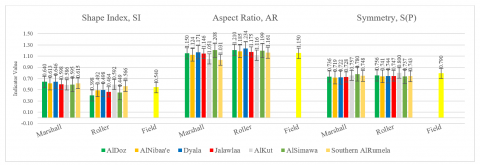
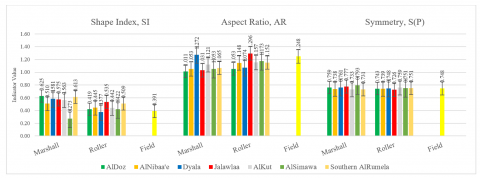
4.1.2 Shape indicators of aggregate
Three indicators have been employed to magnify their impact on the distribution of aggregates for assessing aggregate shape using the DIA analysis. Shape index (SI), Aspect Ratio (AR), and a new index measure the symmetrical property of aggregate called Symmetry (S(p)).
SI, as presented in Eq. (4), measures aggregate cross-section uniformity. Lines have a SI of 0, while perfect circles have 1. The more elongated the particle cross-section, the lower the shape index.
$S I=\frac{4 \pi A_c}{\left(C_p\right)^2}$ (4)
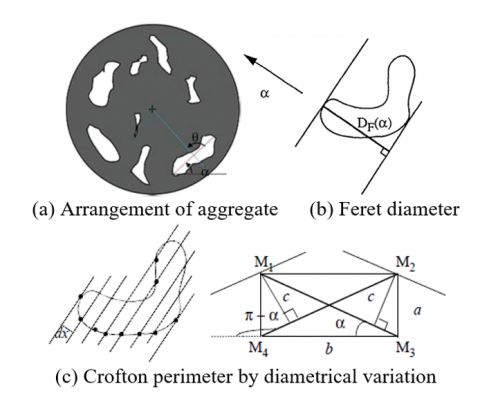
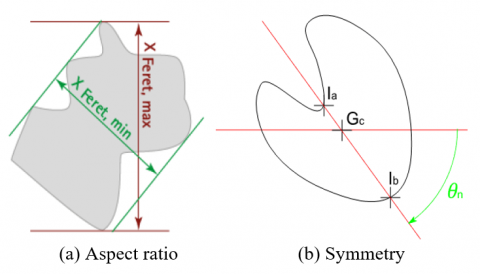
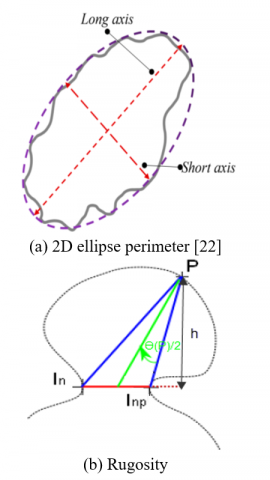
AR of the matched ellipse for the particle as shown in Figure 12(a) is found using the Eq. (5). It is defined as the proportion of the longer to the shorter feret axes [31].
$A R=\frac{X F_{\text {max }}}{X F_{\text {min }}}$ (5)
The measure of S(P) indicates whether or not a form is symmetric. It approaches 1 for symmetric shapes and declines with symmetry. It is reduced to 0.5 if the gravity centre is located outside the particle, as seen in the Figure 12 (b). Eq. (6) for aggregate particle P is used to calculate it.
$S(P)=\frac{1}{2}\left(1+M I N_n\left(\frac{R_{\min }}{R_{\max }}\right)\right)$ (6)
where, Rmin and Rmax are ${MIN}\left(\overline{I_a G_c}, \overline{I_b G_c}\right)$ and ${MAX}\left(\overline{I_a G_c}, \overline{I_b G_c}\right)$, respectively.
MINn is the minimum value operator over all the angles ϴn within [0, π].
Figure 12. Analysis of aggregate’s shape indicators
Aggregate performance in asphalt concrete is enormously affected by the aggregates' SI, AR, and S(P). The CP of a particle is compared to the perimeter of a circle of the same area using the SI. The particle's area is proportional to that of a circle. An orientation angle is required to characterize the spatial distribution of particles inside asphalt concrete when the AR is more significant than one. Another signifier that DIA uses to identify aggregate architecture is symmetry, and it has strong indications for values that fall within the range of more than 0.5 and less than 1 [32].
The SI of the aggregates on the two cross sections is between 0.273 and 0.640, as shown in Figures 13 and 14. Comparing the two compaction techniques to the Field, the findings for all sources indicate that Marshall compaction is valuable for vertical and horizontal segmentation, indicating that most aggregate particle cross sections tend to lay vertically and horizontally, respectively. In contrast, Roller compaction implies that the results are superior to Marshall's for two reasons. The first is associated with a reasonable variation in SI, which indicates an ideal aggregate orientation. In contrast, the second is closest to its average value from the Field compaction.
AR related to the effects of SI to limit the indications regarding the effects of compaction on the aggregate distribution and the orientation angles. All values of Marshall and Roller compaction recorded more than one. Still, the Roller method performed best in the vertical and horizontal segmentation. SI and AR provide better aggregate results for AlNibaa'e than other indices. The two indicators, as mentioned earlier, determine the S(P) indicator as a function of aggregate size and depending on the aggregate centre's eccentricity from the bally centre. All values are evaluated as more than 0.5 and less than 1. Roller compaction provides better indicators than Marshall for the two segmentations compared to the Field, even considering AlDoz source.
Figure 13. Analysis of aggregate’s shape indicators (Vertical segmentation)
Figure 14. Analysis of aggregate’s shape indicators (Horizontal segmentation)
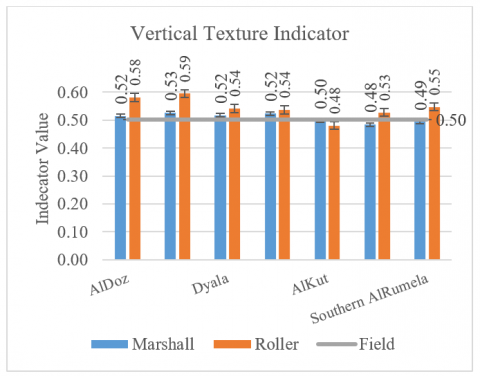
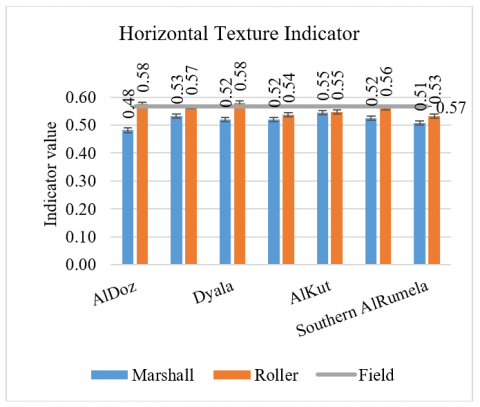
4.1.3 Texture indicator of aggregate
DIA using AVISO program provides quick and straightforward access to aggregate texture properties, which aids in developing more accurate and realistic parameters [33].
Rugosity (Ru(P)) is also known as ‘Spike Parameter’ is a factor determines if the contour of a shape is smooth or not. Its value close to 1 for an abrasive shape and decreases for smooth boundaries. It is given by using Eq. (7) where Ed is the mean operator over all the triangle bases d within [40, L/15]. The step length d represents the distance $\overline{I_n I_{n p}}$ as shown in Figure 15. L is defined as the shape perimeter in pixels. Rud (P) is defined as EN(run) where EN is the mean operator over all valid [ln, lnp] bases for the current d length, and run=cos(ϴ(n)/2). ϴ(n) is the angle associated to the point P maximizing the spike value cos(ϴ(P)/2)⋅h. The angle ϴ and the distance h are defined as in mentioned figure, with ϴ<2.9 rad. If ϴ≥2.9 rad the spike value is counted as 0.
$R u(P)=E_d\left(R u_d(P)\right)$ (7)
Figure 15. Analysis of aggregate’s texture indicator
The DIA quantifies texture as a function of rugosity by measuring particle boundary irregularity in high-resolution black-and-white images. Gray-level intensities from 0 to 255 show surface abnormalities. Surface texture is described with this term. A smooth particle has a minimal gray-level intensity variation, whereas a rough surface has a considerable variance. To determine how compaction variables affect the aggregate texture, it measured various aggregate sources under varied compaction conditions Compared to Field compaction as presented in Figures 16 and 17.
Marshall method has a noticeable influence on texture for vertical segmentation, while Roller compaction influences horizontal segmentation. This may be due to the direction of compaction and their ways of contributing to aggregate particle friction, a vital mix property that resists pavement deformation. Nevertheless, the Roller approach outperformed Marshall's impact, especially for AlNibaa'e, AlDoz, and Alsimawa aggregate sources.
Figure 16. Analysis of aggregate’s texture indicator (V.S.)
Figure 17. Analysis of aggregate’s texture indicators (H.S.)
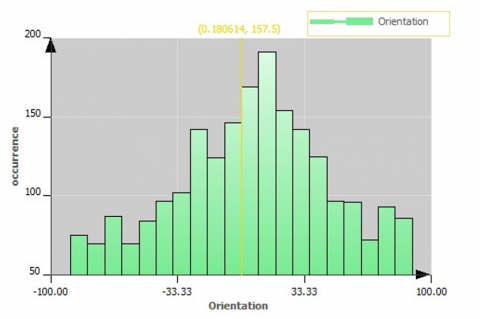
4.2 Internal structure of aggregates' interlocking
A comprehensive microstructural statistical analysis was performed to determine how many variables affect HMA specimens' interior structure. AVISO program as shown in Figure 18 divided the data into zones with equivalent diameters greater than or equal to 2.36mm. The data analysis allocates estimated findings into class intervals (CI) for all vertical and horizontal sample segmentations. The recent internal structure equations of the study depend on using 20 CIs of frequency distribution (approximately an average orientation angle of 10° per CI).
Figure 18. Frequency distribution of aggregate orientation
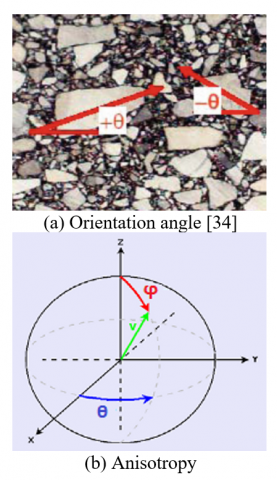
4.2.1 Orientation and anisotropy of aggregate
The orientation as shown in Figure 19 (a) is its principal inertia axis. Physical and mechanical particle qualities vary with orientation. The covariance matrix's biggest eigenvalue's eigenvector is (M). whereas its minor inertia axis is its secondary orientation. It is the covariance matrix's lowest eigenvector (M). With regard to the barycentre, the values reflect the shape's bounding box orientated along the associated eigenvector. the average of all particles' inclination angles assessed by the orientation angle as given in Eq. (8):
$\theta=\frac{\sum_1^{C I}\left|\theta_{C I}\right|}{C I}$ (8)
The $M$ matrix is defined as $\left[\begin{array}{cc}M_{2 x} & M_{2 x y} \\ M_{2 x y} & M_{2 y}\end{array}\right] M_{1 x}=1 / \mathrm{A}(\mathrm{X})$ $\sum_X M_i$, and $M_{1 y}=1 /(\mathrm{A}(\mathrm{X})) \sum_X M_i M_{2 x}=1 /(\mathrm{A}(\mathrm{X})) \sum_X\left(x_i-M_{1 x}\right)^2$, $M_{2 y}=1 /(\mathrm{A}(\mathrm{X})) \sum_X\left(y_i-M_{1 x}\right)^2$, and $M_{2 x y}=1 /(\mathrm{A}(\mathrm{X})) \sum_X\left(x_i-\right.$ $\left.M_{1 x}\right)\left(y_i-M_{1 y}\right)$, where, $A(X)$ is the area, $\left(x_i, y_i\right)$ is the points on particle, and $M_{1 x}, M_{1 y}, M_{2 x}, M_{2 y}, M_{2 x y}$ are the first and second moments of inertia, respectively.
Anisotropy depended on the particle orientation angle and measures the deviation of a region from a spherical shape. It describes the orientation, structure, and morphology of the particles. Anisotropic materials have directions-dependent characteristics. The percentage value of anisotropy as shown in Figure 19 (b) can be estimated using Eq. (9):
$Anisotropy =\left(1-\frac{ { Eigen \,Value }_{\max }}{ { Eigen \, Value }_{\min }}\right) * 100 \%$ (9)
Figure 19. Analysis of aggregate orientation and anisotropy
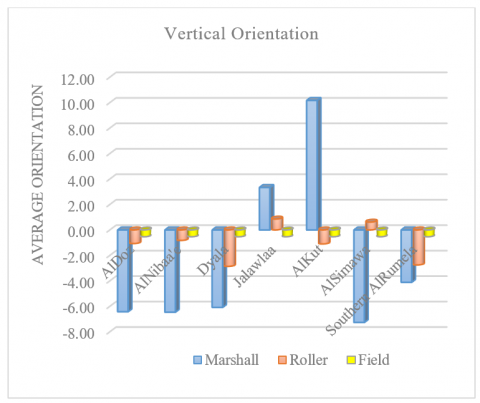
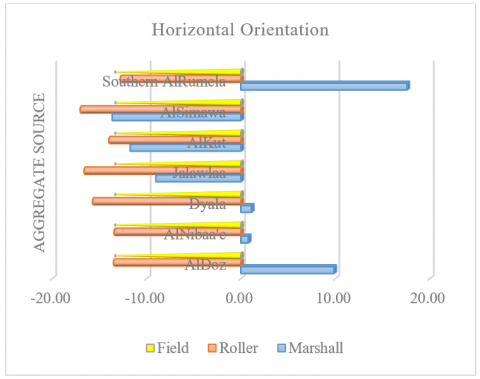
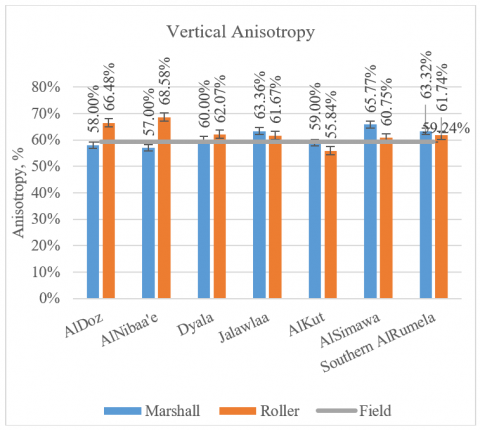
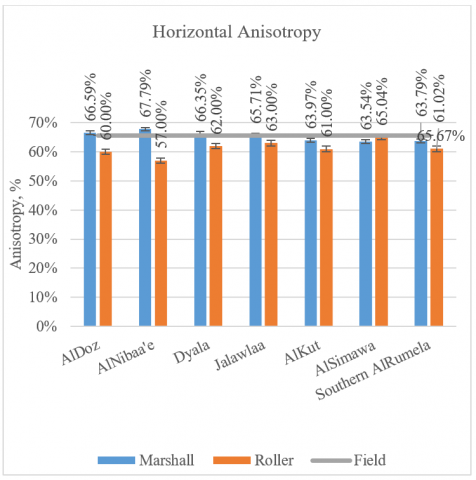
The DIA results of vertical and horizontal orientation angle and anisotropy are presented in Figures 20 to 23, respectively.
Figure 20. Analysis of aggregate orientation (V.S.)
Figure 21. Analysis of aggregate orientation (H.S.)
Figure 22. Analysis of aggregate anisotropy (V.S.)
Figure 23. Analysis of aggregate anisotropy (H.S.)
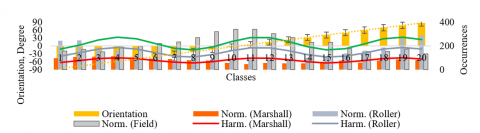
Figure 24. Analysis of aggregate orientation, normalized, and harmonic data (AlDoz quarry, V.S.)
Table 7. Amplitude ‘A’ values for aggregate quarries under different methods of compaction
|
Vertical Segmentation |
|||
|
Comp. Method |
Marshall |
Roller |
Field |
|
AlDoz |
147.54 |
145.50 |
|
|
AlNibaa’e |
159.24 |
147.68 |
|
|
Dyala |
78.04 |
54.29 |
|
|
Jalawlaa |
50.08 |
74.44 |
20.04 |
|
AlKut |
81.49 |
86.11 |
|
|
AlSimawa |
12.94 |
13.72 |
|
|
S. AlRumela |
40.78 |
39.66 |
|
|
Average |
81.44 |
80.20 |
|
|
SD |
50.37 |
47.24 |
|
|
CoV, % |
61.85 |
58.90 |
|
|
Horizontal Segmentation |
|||
|
AlDoz |
68.56 |
92.46 |
|
|
AlNibaa’e |
73.22 |
94.19 |
|
|
Dyala |
68.55 |
72.16 |
|
|
Jalawlaa |
33.92 |
70.47 |
71.86 |
|
AlKut |
64.06 |
74.90 |
|
|
AlSimawa |
95.92 |
65.58 |
|
|
S. AlRumela |
35.52 |
42.84 |
|
|
Average |
62.82 |
73.23 |
|
|
SD |
20.18 |
16.05 |
|
|
CoV, % |
32.13 |
21.91 |
|
It is required to assess the impact of various compaction processes on the orientation of contact and central lines from various aggregate sources. The average vertical and horizontal segmentation aggregate orientation is specified by 10° intervals from -90 to 90. It has been shown that the average vertical and horizontal orientations concentrate at -10 to 10 degrees and -20 to 20 degrees, respectively. Compared to the Field compaction, Marshall achieves better vertical orientation outcomes than the Roller compaction and vice versa for horizontal segmentation. The findings demonstrate a significant fluctuation in the negative and positive results of the Marshall technique, which may need to be more reliable in predicting the actual state. According to previous studies, the anisotropy is more significant in samples with 0° orientation and vice versa. The findings demonstrate that Marshall compaction provides strong recommendations for vertical segmentation. However, Roller compaction provides better results for horizontal segmentation than Marshall compaction, corresponding to lower percentages of aggregate anisotropy. The explanations also agree with the results of aggregate shape indicators and textures, particularly for the aggregate sources of AlNibaa'e, AlDoz, and AlKut, respectively.
4.2.2 Homogeneity of aggregate in HMA
Pavement deterioration begins with asphalt mixture inhomogeneity. Due to the difficulties of defining homogeneity using typical testing techniques, DIA has been used for field cores, and laboratory compacted specimens to define it directly, related to connection with the pavement performance. Instead of indirectly measuring asphalt mixture homogeneity by density, % air voids, and texture depth, DIA can directly define its morphological properties [35, 36]. Variation of homogeneity is essential to determine each aggregate orientation relative to the aggregate's major axis. Figure 24 displays a histogram for AlDoz aggregate sample presented by distributing an aggregate orientation into approximately 10° intervals. Perfectly, fitting normalized data to the harmonic occurrences considering a sinusoidal wave's function as shown in Eq. (10).
$\begin{gathered}\text { Harm. }=\text { Norm.* }\left(1+A_1 \operatorname{Cos}\left(2 \theta_{C I}\right)+\right. \left.2 B_1 \operatorname{Sin}\left(2 \theta_{C I}\right) \operatorname{Cos}\left(2 \theta_{C I}\right)-A_1 \operatorname{Sin}\left(2 \theta_{C I}\right)\right)\end{gathered}$ (10)
where, $A_1=\frac{2 \sum_1^{I I} \cos \left(2 \theta_C\right)}{C I}$, and $B_1=\frac{2 \sum_1^{C I} \sin \left(2 \theta_{C I}\right)}{C I}$.
The study fit determines the harmonic amplitude (A), which measures severity or variation from a uniform distribution. Horizontal line would have zero ‘A’ if aggregate orientation were uniform. Thus, orientation non-uniformity decreases with increasing ‘A’. The results of ‘A’ for all quarries of aggregate are presented in Table 7.
Comparing compaction modes' influence on aggregate homogeneity. The findings show that the compaction method significantly affects the computed harmonic amplitude (A). The comparison relies on evaluating ‘A’ for all aggregate sources and estimating the CoV range relating to the average value. The vertical segments indicated that the Marshall and roller compaction rates of ‘A’ are substantially higher than those of the field compaction, although the rate of CoV across aggregate types is around 60%, which may call into doubt the evaluation procedure. In the horizontal segments, the results process showed that the roller compaction with a rate of ‘A’ is most influential than it is in the Marshall method, compared to the field compaction with an approximated average CoV of 20% and less than it is in the Roller compaction, which implies that it has the highest tendency to orient the aggregate homogeneously to a particular angle. The AlNabai, AlDoz, and AlKut sources of aggregates were given priority since they produced the most significant results.
4.2.3 Directional distribution of aggregate
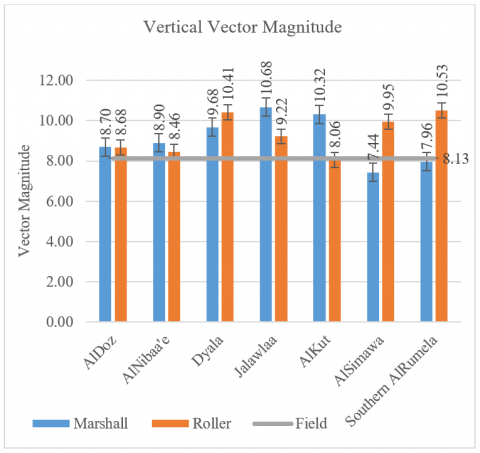
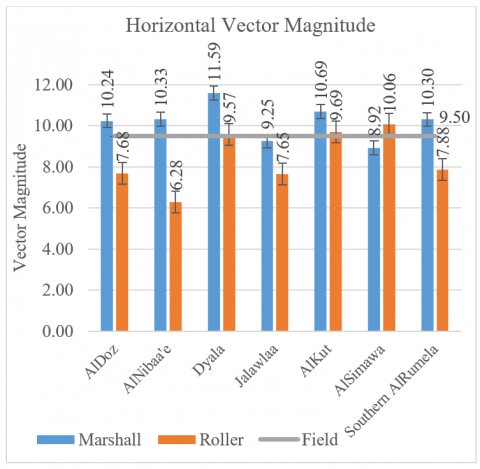
As indicated in Eq. (11), the vector magnitude (∆0), a statistical indicator, has been employed to characterize the directional distribution of aggregates. Each compaction energy is determined as the average of the values measured on the two segments of each specimen produced at that compaction level [37]. Marshall specimens were prepared using 75 blows, while Roller slabs were progressively applying with 5 kN load for a variable number of cycles to achieve the same Marshall density for each aggregate source. Conversely, the ∆0 improved with compaction until it reached a peak value, after which it began to decline when the compaction level was raised further. As a result, the aggregates' preferred orientation seemed more noticeable with compaction until an optimal value was realized. After that, aggregates tended to have randomized orientation.
$\Delta_0=\frac{100}{C} \sqrt{A_2{ }^2+B_2{ }^2}$ (11)
where, $A_2=\sum_1^{C I} \operatorname{Cos}\left(2 \theta_{C I}\right)$, and $B_2=\sum_1^{C I} \operatorname{Sin}\left(2 \theta_{C I}\right)$.
The average value of ∆0 range from 0% to 100% at any time. If the orientation is wholly distributed randomly, it will be 0%. However, if it is 100%, all observable orientations point in the same identical direction. Figures 25 and 26 show ∆0's vertical and horizontal segmentations.
Figure 25. ∆0 analysis of aggregate (V.S.)
Figure 26. ∆0 analysis of aggregate (H.S.)
The results demonstrated that Marshall and roller compaction had a higher ∆0 value in vertical segments than in situ compaction. For the horizontal segments, their importance in Marshall compaction remained virtually greater than in field compaction for most of the aggregate types while being lower in roller compaction. The Marshall and roller compactors tilt the aggregate, reducing fullness. Field compaction, whereas throughout the vertical segments, the vector magnitude of Marshall compaction is higher than roller compaction and with the average of an aggregate spreading percentage of 54 and 63%, respectively, since in the Marshall method, the stresses are perpendicular to the estimated area of the sample, which may well lead to the possibility of organizing the aggregates transversely and then tending to take a path towards the circumference of mould because of its small dimensions, maintaining somewhat the spreading process in the other direction. With the Roller technique, shear stresses affect the aggregate horizontally with a spread proportion more significant than Marshall, then stabilize may be due to the large size of the mould, resulting in more aggregate distribution randomization than Marshall, especially for AlNibaa’e, AlDoz, and Jalawlaa sources of aggregate.
As a result, the geometrical shapes aspects and internal structure of aggregates are considered for the assessment approach in this study. The conclusion summarized in the following points:
That is vital to point out that the analysis performed in this study depends on imaging of mixes before loading, which accurately reflects the asphalt mixtures' fundamental structure. The component of a mixture undergoes a process known as induced morphology when loaded. It is necessary to conduct further work on the induced features of the interior structure of asphalt mixes. In addition, the authors recommend studying the effect of different compaction methods on mix performance through mechanical testing. They can also recommend using 3D imaging to gain more insights into aggregate orientation.
The Ph.D. dissertation in Civil Engineering at Al-Nahrain University, College of Engineering, which is being supervised by Prof. Dr. Alaa H. Abed, includes this paper. Authors express their deepest gratitude for Engineering Faculty, especially Transportation Laboratory individuals for the encouragement to conduct this study. Even more, so grateful to Baghdad's National Centre for Construction Laboratories and Research (NCCLR) for testing the material.
[1] Obaidat, M.T., Ghuzlan, K.A., Alawneh, M.M. (2017). Analysis of volumetric properties of bituminous mixtures using cellular phones and image processing techniques. Canadian Journal of Civil Engineering, 44(9): 715-726. https://doi.org/10.1139/cjce-2017-0085
[2] Ghuzlan, K.A., Obaidat, M.T., Alawneh, M.M. (2019). Cellular-phone-based computer vision system to extract shape properties of coarse aggregate for asphalt mixtures. Engineering Science and Technology, An International Journal, 22(3): 767-776. https://doi.org/10.1016/j.jestch.2019.02.003
[3] Abed, M.A., Abed, A.H. (2020). Effect of compaction methods on the morphology of aggregates in hot mix asphalt. IOP Conference Series: Materials Science and Engineering, 671(1): 012119. https://doi.org/10.1088/1757-899X/671/1/012119
[4] Georgiou, P., Sideris, L., Loizos, A. (2016). Evaluation of the effects of gyratory and field compaction on asphalt mix internal structure. Materials and Structures, 49(1-2): 665-676. https://doi.org/10.1617/s11527-015-0528-3
[5] Hu, J., Liu, P., Wang, D., Oeser, M. (2018). Influence of aggregates’ spatial characteristics on air-voids in asphalt mixture. Road Materials and Pavement Design, 19(4): 837-855. https://doi.org/10.1080/14680629.2017.1279072
[6] Wang, L., Hoyos, L.R., Wang, J., Voyiadjis, G., Abadie, C. (2005). Anisotropic properties of asphalt concrete: characterization and implications for pavement design and analysis. Journal of Materials in Civil Engineering, 17(5): 535-543. https://doi.org/10.1061/(ASCE)0899-1561(2005)17:5(535)
[7] Tashman, L., Wang, L., Thyagarajan, S. (2007). Microstructure characterization for modeling HMA behaviour using imaging technology. Road Materials and Pavement Design, 8(2): 207-238. https://doi.org/10.1080/14680629.2007.9690073
[8] SCRB, State Commission of Roads and Bridges. (2003). Standard Specification for Roads and Bridges, Ministry of Housing and Construction, Iraq.
[9] American Society for Testing and Materials. ASTM D854. (2014). Standard Test Methods for Specific Gravity of Soil Solids by Water Pycnometer; American Society for Testing and Materials: West Conshohocken, PA, USA.
[10] American Society for Testing and Materials. ASTM D854. (2020). Standard Test Method for Materials Finer than 75-μm (No. 200) Sieve in Mineral Aggregates by Washing; American Society for Testing and Materials: West Conshohocken, PA, USA.
[11] American Society for Testing and Materials. ASTM C127. (2001). Standard Test Method for Density, Relative Density (Specific Gravity), and Absorption of Coarse Aggregate; American Society for Testing and Materials: West Conshohocken, PA, USA.
[12] American Society for Testing and Materials. ASTM C131. (2001). Standard Test Method for Resist to Degradation of Small-Size Coarse Aggregate by Abrasion and Impact in the Los Angeles Machine; American Society for Testing and Materials: West Conshohocken, PA, USA.
[13] American Society for Testing and Materials. ASTM C128. (2001). Standard Test Method for Density, Relative Density (Specific Gravity), and Absorption of Fine Aggregate; American Society for Testing and Materials: West Conshohocken, PA, USA.
[14] American Society for Testing and Materials. ASTM D5. (2019). Standard Test Method for Penetration of Bituminous Materials; American Society for Testing and Materials: West Conshohocken, PA, USA.
[15] American Society for Testing and Materials. ASTM D36. (2014). Standard Test Method for Softening Point of Bitumen (Ring-and-Ball Apparatus); American Society for Testing and Materials: West Conshohocken, PA, USA.
[16] American Society for Testing and Materials. ASTM D113. (2014). Standard Test Method for Ductility of Asphalt Material; American Society for Testing and Materials: West Conshohocken, PA, USA.
[17] American Society for Testing and Materials. ASTM D70. (2003). Standard Test Method for Density of Semi- Solid Bituminous Materials (Pycnometer Method); American Society for Testing and Materials: West Conshohocken, PA, USA.
[18] American Society for Testing and Materials. ASTM D92. (2004). Standard Test Method for Flash and Fire Points by Cleveland Open Cup Tester; American Society for Testing and Materials: West Conshohocken, PA, USA.
[19] American Society for Testing and Materials. ASTM D4402. (2013). Standard Test Method for Viscosity Determination of Asphalt at Elevated Temperatures using a Rotational Viscometer; American Society for Testing and Materials: West Conshohocken, PA, USA.
[20] AASHTO Guide Specifications for Highway Construction. (2020). American Association of State Highway and Transportation Officials. Tenth Edition, Washington DC, USA.
[21] BS. EN 12697 – 33. (2007). Bituminous Mixtures - Test Methods for Hot Mix Asphalt - part 33: Speci¬men prepared by Roller Compactor, European Com¬mittee for Standardization.
[22] American Society for Testing and Materials. ASTM D5361. (2000). Standard Practice for Sampling Compacted Asphalt Mixtures for Laboratory Testing; American Society for Testing and Materials: West Conshohocken, PA, USA.
[23] Falchetto, A., Moon, K., Wistuba, M. (2014). Microstructural analysis and rheological modeling of asphalt mixtures containing recycled asphalt materials. Materials, 7(9): 6254-6280. https://doi.org/10.3390/ma7096254
[24] Abbas, A.R., Papagiannakis, A.T., Masad, E.A. (2004). Linear and nonlinear viscoelastic analysis of the microstructure of asphalt concretes. Journal of Materials in Civil Engineering, 16(2): 133-139. https://doi.org/10.1061/(ASCE)0899-1561(2004)16:2(133)
[25] Wang, L., Wang, X., Mohammad, L., Wang, Y. (2004). Application of mixture theory in the evaluation of mechanical properties of asphalt concrete. Journal of Materials in Civil Engineering, 16(2): 167-174. https://doi.org/10.1061/(ASCE)0899-1561(2004)16:2(167)
[26] Li, Y., Metcalf, J.B. (2005). Two-step approach to prediction of asphalt concrete modulus from two-phase micromechanical models. Journal of Materials in Civil Engineering, 17(4): 407-415. https://doi.org/10.1061/(ASCE)0899-1561(2005)17:4(407)
[27] Zhong, Q.Y., Bekking, W., Morin, I. (1995). Application of digital image processing to quantitative study of asphalt concrete microstructure. Transportation Research Record, 1492.
[28] Cepuritis, R., Garboczi, E.J., Jacobsen, S., Snyder, K.A. (2017). Comparison of 2-D and 3-D shape analysis of concrete aggregate fines from VSI crushing. Powder Technology, 309: 110-125. https://doi.org/10.1016/j.powtec.2016.12.037
[29] Bessa, I.S., Branco, V.T.F.C., Soares, J.B., Neto, J.A.N. (2015). Aggregate shape properties and their influence on the behavior of hot-mix asphalt. Journal of Materials in Civil Engineering, 27(7). https://doi.org/10.1061/(ASCE)MT.1943-5533.0001181
[30] Merkus, H.G. (2009). Particle Size Measurements: Fundamentals, Practice, Quality (Vol. 17). Springer Science & Business Media.
[31] Chen, J., Wang, H., Li, L. (2017). Virtual testing of asphalt mixture with two-dimensional and three-dimensional random aggregate structures. International Journal of Pavement Engineering, 18(9): 824-836. https://doi.org/10.1080/10298436.2015.1066005
[32] Wang, L., Yao, Y., Li, J., Tao, Y., Liu, K. (2022). Review of visualization technique and its application of road aggregates based on morphological features. Applied Sciences, 12(20): 10571. https://doi.org/10.3390/app122010571
[33] Bessa, I.S., Castelo Branco, V.T.F., Soares, J.B. (2012). Evaluation of different digital image processing software for aggregates and hot mix asphalt characterizations. Construction and Building Materials, 37: 370-378. https://doi.org/10.1016/j.conbuildmat.2012.07.051
[34] Li, W., Wang, D., Chen, B., Hua, K., Su, W., Xiong, C., Zhang, X. (2022). Research on three-dimensional morphological characteristics evaluation method and processing quality of coarse aggregate. Buildings, 12(3): 293. https://doi.org/10.3390/buildings12030293
[35] Sun, P., Zhang, K., Han, S., Liang, Z., Kong, W., Zhan, X. (2022). Method for the evaluation of the homogeneity of asphalt mixtures by 2-dimensional image analysis. Materials, 15(12): 4265. https://doi.org/10.3390/ma15124265
[36] Zhang, K., Sun, P., Li, L., Zhao, Y., Zhao, Y., Zhang, Z. (2021). A novel evaluation method of aggregate distribution homogeneity for asphalt pavement based on the characteristics of texture structure. Construction and Building Materials, 306: 124927. https://doi.org/10.1016/j.conbuildmat.2021.124927
[37] Roohi Sefidmazgi, N., Bahia, H.U. (2014). Effect of compaction conditions on aggregate packing using 2-dimensional image analysis and the relation to performance of HMA. Materials and Structures, 47(8): 1313-1324. https://doi.org/10.1617/s11527-014-0275-x