Jasrina Jaffar*![]() | Raja Norashikin Raja Shamsudin
| Raja Norashikin Raja Shamsudin![]() | Wan Mustafa Wan Sulong
| Wan Mustafa Wan Sulong![]() | Khairul Hamzani Hamid
| Khairul Hamzani Hamid![]() | Engku Adam Syauqi Engku Faizul
| Engku Adam Syauqi Engku Faizul![]()
© 2025 The authors. This article is published by IIETA and is licensed under the CC BY 4.0 license (http://creativecommons.org/licenses/by/4.0/).
OPEN ACCESS
The growing demand for sustainable and efficient energy has led to the emergence of Photovoltaic Thermal (PV/T) systems as a promising approach to enhance solar energy utilization. These hybrid systems simultaneously convert solar energy into electrical and thermal energy, offering advantages over standalone Photovoltaic (PV) and solar thermal systems. However, high operating temperature is a major barrier that limits the efficiency of PV/T systems, particularly in tropical regions. This paper proposes a novel chilled water-based PV/T system that integrates a highly efficient cooling system with a PV system. The outdoor experiments investigated a 100 W PV/T system integrated with a chilled water circulation loop, which was conducted at the University of Kuala Lumpur (UniKL, MFI) under solar irradiance ranging from 400 to 1,200 W/m² and flow rates of 2.5, 3.0, and 3.5 LPM. Results drawn prove that the optimal 3.0 LPM flow rate effectively reduced PV module surface temperature by 10℃ to 20℃ compared to a single PV module, with the system achieving peak electrical, thermal, and overall efficiencies of 19.32%, 57.22%, and 76.54%, respectively. A further break-even analysis revealed that a single module of a 1 HP chiller resulted in negative net efficiency. In contrast, larger arrays (N = 5-10) achieved net efficiencies above 50%, approaching the gross efficiency (~76.5%).
Photovoltaic Thermal (PV/T), chilled water, electrical, thermal, efficiency improvement
Since the 1970s, Photovoltaic Thermal (PV/T) systems have evolved to combine electrical and thermal energy generation, improving overall energy utilization and space efficiency [1-3]. In particular, PV efficiency decreases by ~0.5% for every 1℃ rise in cell temperature, making temperature control crucial for PV collector performance [4] and proportionally increases in solar irradiance intensity [5]. Furthermore, Photovoltaic (PV) collectors utilize only 15% to 20% of the incoming solar energy into electricity [6], with the rest being converted into heat [7]. Correspondingly, power efficiency can be improved by a medium that effectively absorbs the heat energy from the PV collector, ranging from 12% to 13% and thermal efficiencies up to 65% under specific conditions [7, 8].
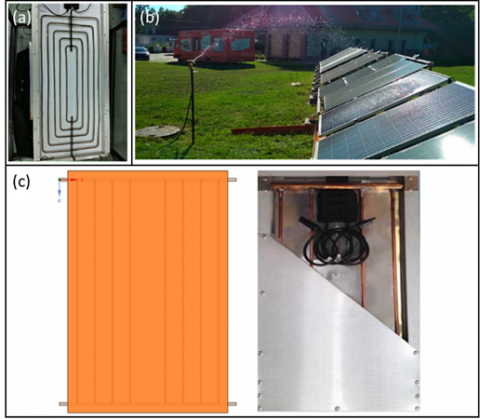
Despite numerous cooling techniques, Phase Change Materials (PCMs) and active methods such as water circulation and spraying water on both sides of the panel can increase electrical efficiency to 16.3% by lowering the cell temperature from 54℃ to 24℃ [3, 9]. Accordingly, a thermal collector can be installed beneath the PV collector to dissipate heat energy to flowing water [10, 11] and absorb thermal energy [3] to produce hot water [12], thereby being fully utilized for domestic applications [5]. The various types of PV/T systems with cooling water are displayed in Figure 1 [13, 14].
Some studies emphasize the benefits of nanofluids and PCMs, while others highlight limitations such as PCM leakage, increased pumping power requirements [4, 15], and evaluated the performance of PV/T water [6, 12, 16-19]. For example, Bashir et al. [17] found that the temperature of c-Si modules with cooling was 13.6 % lower, and that of p-Si modules 7.2 % lower, than those without cooling [4, 15].
According to Abdullah et al. [18], the PV panel's efficiency increased by 3% for 300 l/h flow rates compared to the panel without water-cooling. Meanwhile, Sornek et al. [19] developed a water-cooling system effectively, with a temperature rise leading to a decrease in PV panel performance by approximately 12.0%. In line with this, Shahsavar et al. [12] proved that the exergy efficiency of 4% of water-based PV/T units varies depending on design and operating conditions, and the PV panel's temperature should be below 47℃ [20]. A summary of these observations is tabulated in Table 1.
Previous studies have highlighted that water-based cooling systems enhance electrical efficiency and recover excess heat for domestic or industrial use [21, 22]. This makes it efficient, reliable, and sustainable solar energy solutions. However, a limited number of studies have explored the use of chilled water for effective thermal management in PV/T by active cooling [18, 23]. This is particularly evident in terms of its influence on heat extraction rates and overall system efficiency in hot climates. On the other hand, its major disadvantages are corrosion, maintenance, and pumping power consumption.
This research presents the design and experimental performance evaluation of a water-cooled PV/T collector integrated with chilled water maintained at approximately 7℃. Moreover, the use of low-temperature fluid optimizes thermal regulation, reduces PV module temperature, and enhances overall energy conversion efficiency, with only a minor impact from auxiliary power consumption.
Table 1. The impact of varying cooling methods
|
No. |
Cooling Method |
Temp. Reduction |
Efficiency Gain |
Key Note |
Ref. |
|
1 |
Split-flow water cooling |
< 45℃ |
ηth > 57% |
Impact of flow |
[14] |
|
2 |
Water cooling with an absorber collector |
↓50.76℃-46.2℃ |
13.01% - 13.81% |
Absorber type effect |
[17] |
|
3 |
Back surface water cooling |
13.6% (c-Si), 7.2% (p-Si) |
13% (c-Si), 6.2% (p-Si) |
Cooling reduces temp. |
[18] |
|
4 |
Finned air PV/T |
↓14.9℃ |
+ 0.42% ηel |
Performance assessed |
[6] |
|
5 |
Back-panel copper pipe |
44°C (cooled), 60℃ (uncooled) |
+ 3% |
Flow effect |
[19] |
|
6 |
Underground water |
↓11.7℃ |
+ 27.62% vs uncooled |
Subsurface cooling |
[4] |
|
7 |
Forced/natural circulation |
Maintained 40℃ |
+ 10.3% |
Circulation type |
[16] |
|
8 |
Nanofluids (helical channel) |
Non stated |
19.4%–22.6% |
Exergy varies |
[13] |
|
9 |
Direct water cooling |
↓24 K |
+ 1.2% - 13% |
Temp rise effect |
[20] |
|
10 |
Copper fin (cylindrical & rectangular) |
< 47℃ |
ηexergy 64% |
Geometry effect |
[21] |
Figure 1. The various types of PV/T systems (a) PV/T cooling with split flow absorber design [13]; (b) Water cooling by sprinkling on the PV plate; (c) Effect of water-cooling using copper pipe [14]
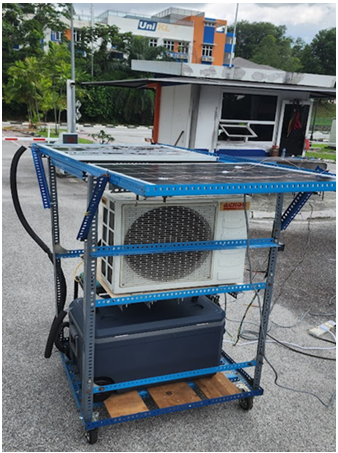
The experimental setup is primarily composed of two identical PV modules: A PV/T module attached to the chilled water-cooling system, and a conventional PV module without a cooling system. Particularly, the chilled water created with the cooling process flows via a closed-loop cooling system and cools the PV modules directly. A 100 W PV/T panel (Model: SF100-18V, E-Ten), with dimensions of 770 mm × 671 mm × 25 mm and a surface area of 0.52 m2.
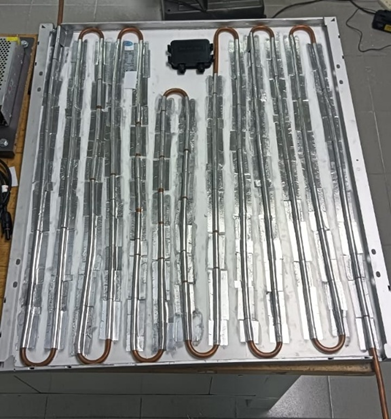
This PVT system features an insulation sheet to minimize heat loss between the thermal collector and the PV panels, thereby enhancing overall system efficiency. Meanwhile, the cooling system consists of one spiral copper flow tube to distribute the flow evenly and provide uniform cooling to the PV module [22, 24, 25], as illustrated in Figures 2 and 3.
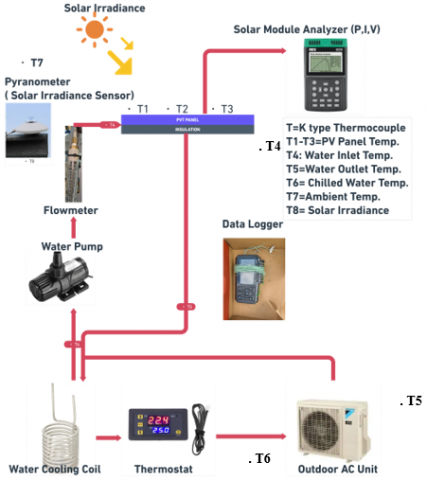
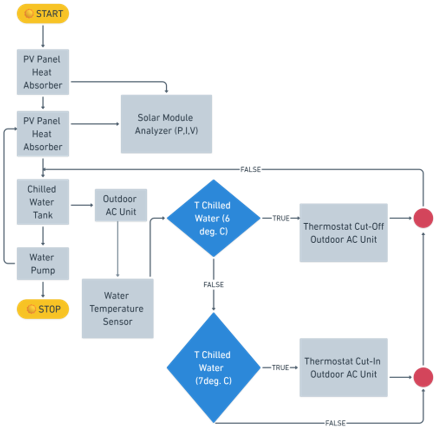
An outdoor Air Conditioning (AC) unit (1 HP) functions as a chiller with a cooling capacity of 60 W, operating on the refrigeration cycle to absorb heat from circulating water [26-28], which then releases absorbed heat to the external environment. Subsequently, this cooled water is circulated back to the PV/T panel by a water pump, with a thermostat regulating the water temperature to maintain the setpoint. In Figure 4, the system begins by harnessing solar irradiance, which is absorbed by the PV panel heat absorber. Simultaneously, a solar module analyzer monitors the electrical performance of the PV system. The heat generated by the PV panel is dissipated through a chilled water tank, which is cooled using an outdoor AC unit.
Figure 2. PV/T systems with a copper tube at the back of the absorber
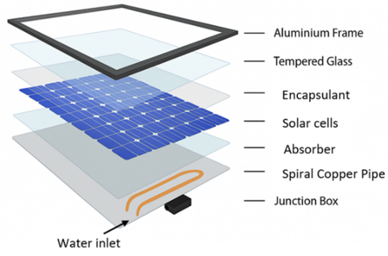
Figure 3. Technical illustration of 3D PV/T
Figure 5 presents the cooling mechanism, centered around a thermal collector, circulating water through its channels. A pump regulates water flow, and a liquid flowmeter (SHLLJ-LZM-40G) to ensure optimal flow, with a measuring range of 0~5 LPM. This flowmeter features an acrylic body, Acrylonitrile Butadiene Styrene (ABS) fittings, and a stainless-steel float, operating at ≤ 1 MPa pressure with a temperature range of 0~65℃ with ± 4% accuracy, customizable specifications, and is ideal for precise liquid flow measurement in various applications. Accordingly, heated water is directed to a chilled water tank, where the cooling process is controlled by a thermostat and supported by the outdoor AC unit. The system operates based on specific temperature thresholds, indicating that if the chilled tank water drops below 6℃, the AC unit cuts off, and oppositely, if it exceeds 7℃, the AC unit reactivates.
Figure 4. The schematic diagram for the experiment
Figure 5. The PV/T water-cooling setup
The flowchart in Figure 6 illustrates the operational process of a PV/T system integrated with a chilled water-cooling mechanism and an outdoor AC unit.
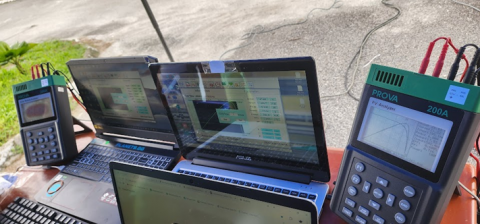
A water pump circulates the water between the tank and the system components, maintaining efficient heat transfer and thermal regulation [29]. Note that the maximum power consumption of the pump is 60 W, providing a flow rate of 1 m3/h. Correspondingly, the data was collected using a module analyzer and a data logger, as displayed in Figure 7.
The electrical characteristics of the PV module and PV/T cooling module, along with the rear surface temperatures, are studied for two days. At the same time, the inlet and outlet temperatures of the PV/T are measured to analyze the thermal characteristics of the proposed PV/T module. The readings of voltage, current, inlet, and outlet temperatures are recorded from 8 AM to 5 PM with 6~15 min intervals. The same procedure is repeated the next day, and the data collected is used to conduct performance analysis.
Figure 6. Flow chart of PV/T chilled water
Figure 7. A module analyzer and a data logger for data collection
2.1 Auxiliary power consumption
The auxiliary power consumption of the cooling system was included in this study. In particular, the auxiliary energy demand of the system consisted of a 60 W water pump (≈ 0.3 kWh/day) and a 1 HP AC unit rated at 800 W (≈ 4.0 kWh/day for 5-hour operation). Similar to previous studies, the power required for pumps or chillers can significantly influence the net balance of low-capacity PV systems [15, 19, 30]. These additional loads must be considered to determine net efficiency by deducting auxiliary power consumption from the gross electrical and thermal outputs, providing a more realistic measure of system performance [27].
The methodology included comprehensive data analysis to evaluate the energy output and efficiency of both the PV/T chilled water systems and conventional [1, 31] PV panels under similar environmental conditions. The study evaluates both electrical and thermal efficiencies of the PV/T and PV systems. The electrical efficiency, ηelec, is calculated using the temperature-corrected reference method [32]:
$\eta_{\text {elec }}=\eta_r\left(1-\beta\left(T_{P V}-T_{S T C}\right)\right)$, (1)
where, $\eta_r$ is reference efficiency under Standard Test Conditions (STC), β for temperature coefficient at 0.004℃ of efficiency around 0.4% and $T_{S T C}$ as reference temperature at 25℃. Meanwhile, the collector efficiency factor, $\eta_C$ is determined from the following formula using these components in the solar thermal collector:
$\eta_C=\frac{\left[\frac{1}{\epsilon_L}\right]}{\left\{\frac{1}{\epsilon_L\left[D_o+F(S)\right]}+\frac{1}{\pi D_i h_f}\right\}}$, (2)
where, $\epsilon_L$ is the overall heat loss in $\mathrm{W} / \mathrm{m}^2 \mathrm{~K}, D_o, D_i$ is the tube outer and inner tube diameter, $F$ is the fin efficiency factor, and $h_f$ is the fluid heat transfer coefficient. Thermal efficiency (ηth) is assessed using the heat gain equation:
$\eta_{t h}=F_R\left\{(T \propto)-\frac{U_t\left(T_i-T_a\right)}{G}\right\}$ (3)
In this equation, ηth represents the ratio of useful thermal energy gained to the total incident solar energy. $F_R$ denotes the heat removal factor. Moreover, the product $T \propto$ represents the transmittance absorptance product, indicating the fraction of solar radiation that successfully reaches and is absorbed by the collector plate.
The second term $\frac{U_t\left(T_i-T_a\right)}{G}$, represents the thermal losses to the ambient environment, where $U_t$ is the top loss coefficient, $T_i$ is the inlet fluid temperature, $T_a$ is the ambient temperature, and G is the solar irradiance.
The overall total efficiency of PV/T ($\eta_{\text {total }}$) is calculated as the sum of thermal efficiency $\left(\eta_{t h}\right)$, and electrical efficiency ($\eta_{\text {elec }}$) of a PV panel. The equation is expressed as follows:
$\eta_{\text {tot }}=\eta_{\text {th }}+\eta_{\text {elec. }}$ (4)
Multiple experiments were performed at different flow rates of 2.5 LPM, 3.0 LPM, and 3.5 LPM, with 3.0 LPM proving to be an optimal result. Building on this, results were analyzed for electrical performance in terms of voltage, current, and power despite a temperature differential, and total system efficiency.
The net efficiency analysis is expressed with auxiliary electricity used by the cooling system (water pump and outdoor AC unit), which is defined as:
$\eta_{\text {net }}=\frac{E_{\text {usefull }}-E_{\text {aux }}}{E_{\text {solar }}}$, (5)
where, $E_{\text {useful }}=\eta_{\text {gross }} E_{\text {solar }}$ is the total useful energy of thermal and electrical, $E_{\text {aux }}$ is the auxiliary energy drawn by the pump and the outdoor AC unit, and $E_{\text {solar }}$ is the incident solar energy on the collector area, A.
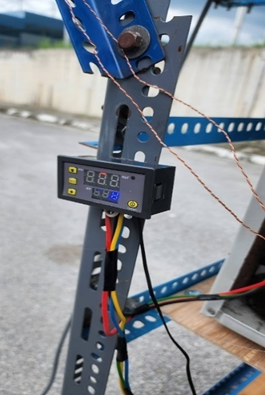
The experimental analysis of the PV/T collector integrated with a chilled water-cooling system was conducted under Malaysian climate at the University of Kuala Lumpur (UniKL) MFI, Bangi (2.9702° N, 101.7562° E). The performance evaluation was conducted under variable solar irradiance ranging between 400 and 1,200 W/m², with a fixed water flow rate of 2.5 LPM, 3.0 LPM, and 3.5 LPM (liters per minute). Consistent with this, the inlet temperature of the chilled water was maintained at approximately 7℃, using a thermostat-controlled chiller system, as displayed in Figure 8.
Figure 8. Thermostat-controlled chiller system to fix the inlet temperature
The results of the laboratory tests indicated that the PV/T system power was able to increase 10% of power efficiency with an inlet volumetric flow rate of 3.0 LPM and a temperature reduction of 10℃. Upon achieving satisfactory results from the laboratory tests, an outdoor test rig is prepared to analyze the electrical and thermal performance of the novel PV/T module outdoors.
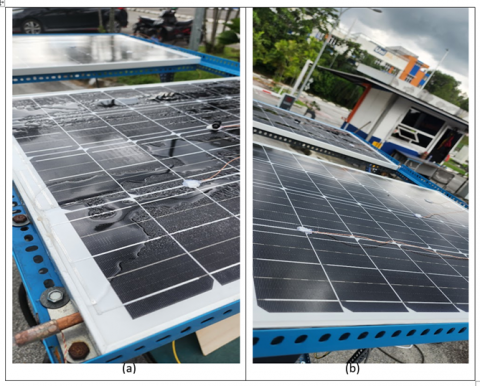
The PVT system with chilled water cooling significantly outperformed the standard PV in thermal regulation and electrical performance module, as displayed in Figures 9(a) and 9(b). Remarkably, the use of active chilled water as a coolant significantly enhanced heat extraction due to a higher temperature gradient between the PV surface and the coolant, which facilitated effective convective heat transfer. This cooling mechanism is consistent with the findings of Bashir et al. [17], who reported a 13.6% reduction in module temperature using water-cooled systems. Notably, our system achieved this with a lower flow rate of 3.0 LPM compared to the study by Abdullah et al. [18], which only demonstrated a 3% improvement at a much higher flow rate of 3.0 LPM. This underscores the efficiency of chilled water in thermal regulation.
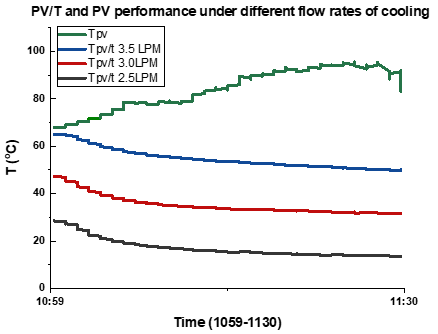
Figure 10 compares the module temperatures for a standard PV panel and PV/T systems at 2.5 LPM, 3.0 LPM, and 3.5 LPM. At an optimal flow rate of 3.0 LPM, the module temperature was consistently reduced by 10℃ to 20℃, thereby enhancing the power output by approximately 10%. The results indicate that PV/T cooling achieves a lower temperature and outperforms a standard PV module.
Figure 9. The PV/T and PV systems: (a) PV/T cooling with spiral flow absorber design, (b) Standard PV module
Figure 10. PV/T and PV performance under different flow rates of cooling
The rationale behind varying the water flow rate of 2.5 LPM, 3.0 LPM, and 3.5 LPM lies in optimizing the trade-off between cooling effectiveness and pumping energy consumption [18]. While increased flow rates enhance heat removal through greater fluid contact and turbulence, they also raise energy demands for active pumping, potentially diminishing overall system efficiency. Therefore, 3.0 LPM was identified as the optimal point offering significant temperature reduction and electrical gains with minimal additional energy burden.
4.1 PV surface temperature reduction
The cooling system effectively reduced the surface temperature of the PV module, where a PV/T temperature reduction by 10℃ to 20℃ was consistently observed throughout the day. Compared to the uncooled PV module, which converts only 15% to 20% of power into electricity, the excessive heat causes a temperature increase [7].
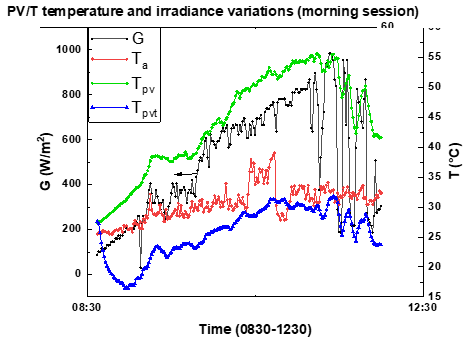
The relationship between solar irradiance (G), ambient temperature (Ta), PV temperature (Tpv), and PV/T temperature (Tpvt) is illustrated in Figure 11 (morning), Figure 12 (noon), and Figure 13 (full day). During the morning time (0830 to 1230), the Tpv module temperature demonstrates a proportional increase up to 50℃, while Tpvt exceeded 55℃ due to heat accumulation within the integrated thermal collector for irradiance ~200 W/m² to ~1,000 W/m². Furthermore, the ambient temperature (Ta) increased gradually (23℃ to 32℃), reflecting a slower atmospheric thermal response. In addition, the significant temperature rise from the average 28℃ reflects direct radiative heating and limited thermal dissipation without active cooling [33].
Figure 11. PV/T temperature and irradiance variations (morning session)
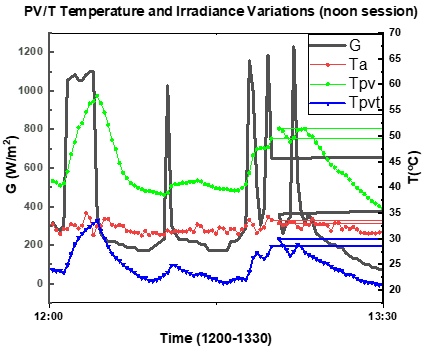
Figure 12. PV/T temperature and irradiance variations (noon session)
At noon (1200-1330), as illustrated in Figure 12, irradiance peaked at ~1,200 W/m² with temperatures of Tpv and Tpvt, reaching up to 56℃ and 62℃, respectively, due to cloud cover. Conversely, ambient temperature (Ta) remains stable between 31℃ and 34℃, indicating limited atmospheric response compared to the rapid surface heating of modules.
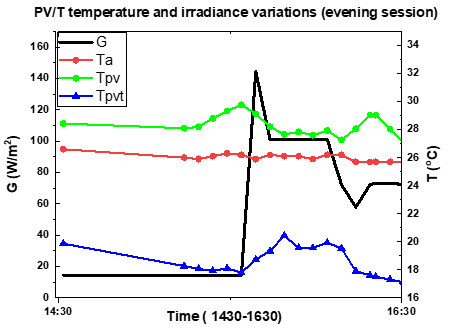
From the irradiance and temperature for the evening session (1430-1630), as displayed in Figure 13, the irradiance declined below 140 W/m², resulting in reduced thermal activity. The Tpv module stabilized at ~28℃ to 30℃ and Tpvt at ~29℃ to 31℃. However, Tpvt remained slightly higher, indicating persistent heat retention and weakness of solar irradiance. Surprisingly, these trends confirm that PV/T modules respond to active cooling with chilled water, effectively managing excess heat and supporting both electrical and thermal performance across varying irradiance conditions.
Figure 13. PV/T temperature and irradiance variations (evening session)
Figure 14. Temperature difference and electrical efficiency of PV and PV/T
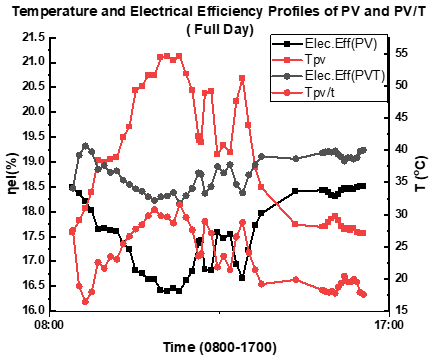
The temperature and electrical efficiency profiles of PV and PV/T systems are presented in Figure 14. The PV temperature (Tpv) increases from ~20℃ to 55℃ in the morning, while the PV/T temperature (Tpvt) remains at a lower temperature (~35℃). This confirms findings by Chaichan et al. [4] and Farhan et al. [20], that cooling techniques can reduce PV surface temperature by 10℃ to 20℃. Meanwhile, the thermal and electrical efficiency behavior illustrates that Tpv exceeded 55℃. This, in turn, leads to a steady decline in electrical efficiency from 18.5% to 16.5% due to the elevated PV cell temperature in the afternoon, which increases internal electrical resistance and decreases open-circuit voltage (Voc), reducing power conversion efficiency. In contrast, the Tpvt remains between 30℃ and 40℃, resulting in an electrical efficiency decreasing from 19.2% to 18.5%. This, ultimately, highlights the effectiveness of PV/T cooling in dissipating thermal losses and sustaining better electrical performance during the afternoon period compared to the conventional PV system.
4.2 Water temperature and heat transfer
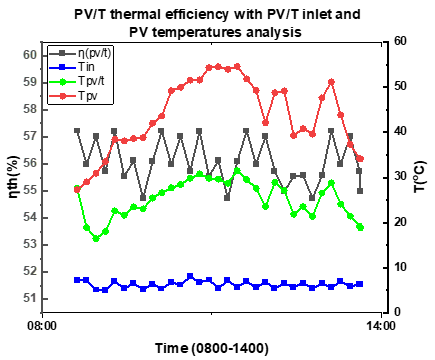
Figure 15 illustrates the relationship between PV/T inlet temperature and thermal efficiency range 0800 to 1400, with an inlet temperature maintained around the average of 6.9℃ to enhance the temperature gradient between the Tpv surface and the fluid. Notably, the highest thermal efficiency is observed in the afternoon when the inlet temperature exceeds 7℃. At the same time, the evening exhibits the lowest performance, resulting in cooler fluid in the inlet temperature that impacts the thermal absorption.
Figure 15. PV/T thermal efficiencies and inlet temperature analysis
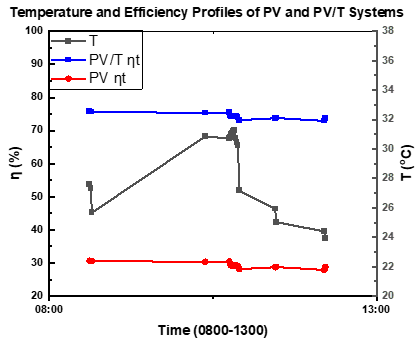
Figure 16. Temperature and efficiency profiles of PV and PV/T systems
Figure 16 presents a PV/T system that demonstrates a higher overall efficiency result compared to the PV module throughout the observation period. This improvement evidences the lower operating temperature maintained in the PVT system. Notably, the thermal management in PV/T systems effectively mitigates heat accumulation on the panel surface, thereby reducing thermal losses and enhancing electrical performance. Consequently, the PV/T configuration improves instantaneous electrical output and contributes to prolonging the long-term operational stability of the module.
4.3 System efficiency
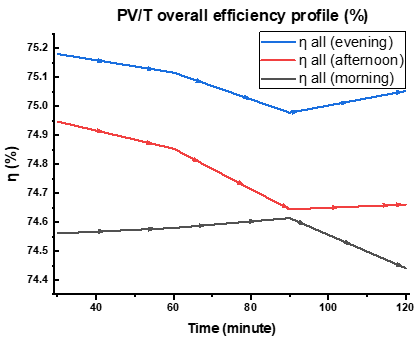
The PV/T system's overall efficiency varies throughout the day due to environmental and operational factors. In the afternoon, the system efficiency reached 75.5%. However, it presented a steady decline over time. Conversely, in the morning, the efficiency improved due to favorable starting conditions. Nevertheless, it declined sharply after 90 minutes, possibly due to thermal buildup and system fatigue. In the evening periods, efficiency declines are attributed to cooler temperatures and low irradiance. Nonetheless, a slight recovery later indicates system adaptation. Thus, to improve this performance, a strategy such as thermal load balancing, real-time control adjustments, and energy storage integration should be considered to maintain optimal efficiency throughout the day. The overall efficiency profile is portrayed in Figure 17.
Figure 17. PV/T overall efficiency profile
4.4 Net efficiency analysis
A net efficiency analysis was conducted for the auxiliary electricity employed by the cooling system for a 60 W water pump (≈ 0.3 kWh/day) and a 1 HP AC unit rated at 800 W (≈ 4.0 kWh/day for 5-hour operation), offering a total load of 4.3 kWh/day.
Table 2. Performance metrics of various photovoltaic thermal (PV/T) system designs
|
$G_{avg}$ (W/m2) |
$E_{solar}$ (kWh) |
$\boldsymbol{\eta}_{gross}$ |
$E_{a u x}$ (kWh) |
$\eta_{net}$ |
|
800 |
2.067 |
0.7654 |
4.30 |
–131.5% |
|
1000 |
2.583 |
0.7654 |
4.30 |
–89.9% |
|
1200 |
3.100 |
0.7654 |
4.30 |
–62.2% |
Table 3. Net efficiency of PV/T system for different numbers of modules (N)
|
N (modules) |
$\eta_{net}$ (800 W/m2) |
$\eta_{net}$ (1000 W/m2) |
$\eta_{net}$ (1200 W/m2) |
|
1 |
-131.5% |
-89.9% |
-62.2% |
|
5 |
34.9% |
43.3% |
48.8% |
|
10 |
55.7% |
59.9% |
62.7%% |
|
50 |
72.4% |
73.2% |
73.8% |
*Note: Break-even occurs at N ≈ 2–3 modules depending on irradiance.
In addition, with average solar irradiance of 800, 1,000, and 1200 W/m² over 5 hours, the total solar irradiance ranged between 2.1 and 3.1 kWh, resulting in a gross efficiency of 76.54%. Meanwhile, the useful energy gain was 1.6 to 2.4 kWh after the auxiliary consumption of 4.3 kWh was deducted. In line with this, the net efficiency for a single module was reported to be negative, as summarized in Table 2, as the energy yield of one PV/T panel is insufficient to offset the demand of a 1 HP chiller.
Furthermore, when the chiller load is distributed across multiple panels, the system achieves a positive net efficiency exceeding 50% [34]. Additionally, a break-even analysis was performed by varying the number of PV/T modules (N) sharing the same auxiliary load. Table 3 presents that the break-even point was reached at N ≈ 2-3 modules, where the useful output is equal. Accordingly, systems with larger arrays (N = 5-10) achieved positive net efficiencies exceeding 50%, and for very large systems (N ≥ 50), the net efficiency approached the gross value (~76.5%).
These findings indicate that net system performance is strongly dependen0t on scale and auxiliary power management, particularly when integrating larger collector arrays into the cooling system.
4.5 Previous studies comparison
It is observed that the present experiment achieved a significant improvement in overall efficiency, reaching 76.54%. This is compared to 62.96%, as reported by Jin et al. [13], representing an enhancement of more than 13%. The overall comparative results of the present study and previous works are summarized in Table 4.
Table 4. Performance metrics of various photovoltaic thermal (PV/T) system designs
|
Author |
Project |
Electrical Eff% |
Thermal Eff.% |
Overall Eff.% |
|
*This study |
PV/T Chill Water System |
19.32 |
57.22 |
76.54 |
|
[13] |
PV/T Water Collector Experiment Study |
5.96 |
57 |
62.96 |
|
[15] |
PV/T Water System Cooling Techniques |
10.25 |
- |
- |
|
[17] |
PV/T with Back Surface Water Cooling |
13 |
30 |
43 |
|
[35] |
PV/T System Collector Area Fully Covered with PV Cells |
10 |
45 |
55 |
The electrical efficiency of 19.32% is integrated higher than the 6% to 13% range typically reported for conventional water-cooled PV/T systems [17, 18]. This improvement of chilled water maintained at ~7℃ enhanced the temperature gradient and effective heat extraction from the panel compared to ambient water application. Furthermore, this present work also evaluated the negative impact on net efficiency due to the excessive load of a 1 HP chiller relative to the collector area. This auxiliary power consumption provides a more realistic assessment of PV/T system feasibility under the Malaysian climate with high solar potential.
Nevertheless, several limitations and challenges were identified during the experimental investigation in tropical climates when employing chilled-water loops. Potential issues include surface condensation on the panel or piping due to high humidity and frequent rainfall, copper corrosion accelerated by warm, humid, and wet conditions, and bio-fouling within the water loop if microbial growth is not controlled. Note that these factors could affect system durability and long-term performance. Hence, mitigation strategies such as insulation, protective coatings, or corrosion inhibitors, and periodic biocidal treatment should be incorporated in future designs.
This study experimentally investigated the thermal and electrical performance of a PV/T system with active chilled-water cooling, maintaining the inlet temperature at 7℃ under typical Malaysian weather conditions. The results reveal a PV surface temperature reduced by 10℃ to 20℃, electrical, thermal, and overall efficiencies of 19.32%, 57.22%, and 76.54%, respectively. Moreover, the performance parameters are achieved by regulating the inlet temperature of the cooling system with a chiller.
The novelty of chilled water cooling (~7℃) and the interior design of the cooling system avoid fast-changing thermal gradients compared to a non-cooled PV module in Malaysian climates. Additionally, the auxiliary power consumption effect was relatively minor compared to the cooling benefit, though optimization remains necessary for practical applications.
Additionally, the net efficiency analysis revealed that a single PV/T module could not offset the auxiliary demand of a 1 HP chiller, resulting in negative net efficiency. Furthermore, the cooling load distributed across multiple modules was break-even for two to three modules, and larger arrays (N = 5-10) achieved positive net efficiencies exceeding 50%, approaching the gross efficiency (~76.5%). These findings highlight that system scalability and integration with larger arrays or existing Heating, Ventilation, and Air Conditioning (HVAC) infrastructure are essential for practical feasibility.
Potential operational challenges were identified, including condensation on panel surfaces, copper corrosion in warm and humid conditions, and bio-fouling within the water loop. Thus, addressing these issues through proper insulation, protective coatings, and water treatment will be crucial for ensuring long-term system reliability.
In line with this, further research into this study is recommended due to significant improvements in thermal and electrical efficiency. Future work can involve Computational Fluid Dynamics (CFD) based simulations to optimize heat transfer and fluid flow, as well as exploring alternative cooling techniques such as heat pipes, PCMs, and bi-fluid cooling. Additionally, conducting long-term durability testing in tropical climates will be necessary. On a similar note, a payback period and economic feasibility analysis are recommended to evaluate the stability, cost-effectiveness, and real-world potential of chilled-water PV/T systems.
The authors are thankful to UniKL. The study is funded by the Fundamental Research Grant Scheme (Grant numbers: FRGS/1/2022/TK08/UNIKL/02/15), Ministry of Higher Education, Malaysia.
[1] Kang, Z., Lu, Z., Song, G., Yao, Q. (2022). A numerical study of dual-inlet air-cooled PV/T solar collectors with various airflow channel configurations. Sustainability, 14(16): 9897. https://doi.org/10.3390/su14169897
[2] Kazem, H.A., Al-Waeli, A.A., Chaichan, M.T., Sopian, K., Ahmed, A.A., Roslam, W.I.W.N. (2023). Enhancement of photovoltaic module performance using passive cooling (Fins): A comprehensive review. Case Studies in Thermal Engineering, 49: 103316. https://doi.org/10.1016/j.csite.2023.103316
[3] Mourshed, M., Masuk, N.I., Nguyen, H.Q., Shabani, B. (2022). An experimental approach to energy and exergy analyses of a hybrid PV/T system with simultaneous water and air cooling. Energies, 15(18): 6764. https://doi.org/10.3390/en15186764
[4] Chaichan, M.T., Kazem, H.A., Alnaser, N.W., Gholami, A., Al-Waeli, A.H., Alnaser, W.E. (2021). Assessment cooling of photovoltaic modules using underground water. Arab Gulf Journal of Scientific Research (AGJSR), 39(2): 151-169. https://doi.org/10.51758/AGJSR-02-2021-0016
[5] Roshanzadeh, B., Premer, L.R., Mohan, G. (2022). Developing an advanced PVT system for sustainable domestic hot water supply. Energies, 15(7): 2346. https://doi.org/10.3390/en15072346
[6] Arslan, E., Tuncer, A.D., Koşan, M., Aktaş, M., Dolgun, E.C. (2020). Designing of a new type air-water cooled photovoltaic collector. Tehnički Glasnik, 14(1): 41-45. https://doi.org/10.31803/tg-20190227095246
[7] Sharma, S., Prakash, R., Tiwari, S., Tiwari, A.K. (2020). Study of a water-based hybrid solar photovoltaic thermal collector. In Proceedings of International Conference in Mechanical and Energy Technology: ICMET 2019, India, pp. 519-527. https://doi.org/10.1007/978-981-15-2647-3_47
[8] Arslan, E., Can, Ö.F., Koşan, M., Demirtaş, M., Aktekeli, B., Aktaş, M. (2023). Numerical and experimental assessment of a photovoltaic thermal collector using variable air volume. Thermal Science and Engineering Progress, 39: 101735. https://doi.org/10.1016/j.tsep.2023.101735
[9] Alexa, M., Ţăranu, N., Hudişteanu, S.V., Cherecheş, N. C., Ţurcanu, F.E., Hudişteanu, I. (2023). Theoretical analysis of water cooled photovoltaic thermal panels. International Journal of Manufacturing Economics and Management, 3(2): 6-18. https://doi.org/10.54684/ijmem.2023.3.2.6
[10] Boumaaraf, B., Touafek, K., Ait-cheikh, M.S., Slimani, M.E.A. (2020). Comparison of electrical and thermal performance evaluation of a classical PV generator and a water glazed hybrid photovoltaic–thermal collector. Mathematics and Computers in Simulation, 167: 176-193. https://doi.org/10.1016/j.matcom.2018.09.003
[11] Rao, V.T., Sekhar, Y.R., Pandey, A.K., Said, Z., Prasad, D.R., Hossain, M.S., Selvaraj, J. (2022). Thermal analysis of hybrid photovoltaic-thermal water collector modified with latent heat thermal energy storage and two side serpentine absorber design. Journal of Energy Storage, 56: 105968. https://doi.org/10.1016/j.est.2022.105968
[12] Shahsavar, A., Alwaeli, A.H., Azimi, N., Rostami, S., Sopian, K., Arıcı, M., Afrand, M. (2022). Exergy studies in water-based and nanofluid-based photovoltaic/thermal collectors: Status and prospects. Renewable and Sustainable Energy Reviews, 168: 112740. https://doi.org/10.1016/j.rser.2022.112740
[13] Jin, G.L., Yusof, M., Othman, H., Ruslan, H., Sopian, K. (2013). Photovoltaic thermal (PV/T) water collector experiment study. Latest Trends in Renewable Energy and Environmental Informatics, pp. 117-124.
[14] Shojaeefard, M.H., Sakran, N.B., Sharfabadi, M.M., Hussein, O.A., Mohammed, H.A. (2023). Experimental and numerical investigation of the effect of water cooling on the temperature distribution of photovoltaic modules using copper pipes. Energies, 16(10): 4102. https://doi.org/10.3390/en16104102
[15] Malaiyappan, P., Kumar, P.N., Devi, G.R. (2022). Experimental investigation of water cooled solar photovoltaic thermal collector. IOP Conference Series: Earth and Environmental Science, 1100(1): 012002. https://doi.org/10.1088/1755-1315/1100/1/012002
[16] Fudholi, A., Sopian, K., Yazdi, M.H., Ruslan, M.H., Ibrahim, A., Kazem, H.A. (2014). Performance analysis of photovoltaic thermal (PVT) water collectors. Energy Conversion and Management, 78: 641-651. https://doi.org/10.1016/j.enconman.2013.11.017
[17] Bashir, M.A., Ali, H.M., Amber, K.P., Bashir, M.W., Ali, H., Imran, S., Kamran, M.S. (2018). Performance investigation of photovoltaic modules by back surface water cooling. Thermal Science, 22(6): 2401-2411. https://doi.org/10.2298/TSCI160215290B
[18] Abdullah, W.A.F.B.W., Ping, C.S., Radzuan, R.N.B., Mokhtar, A.S.N.B. (2021). The improvement on the efficiency of photovoltaic module using water cooling. IOP Conference Series: Earth and Environmental Science, 721(1): 012001. https://doi.org/10.1088/1755-1315/721/1/012001
[19] Sornek, K., Goryl, W., Figaj, R., Dąbrowska, G., Brezdeń, J. (2022). Development and tests of the water cooling system dedicated to photovoltaic panels. Energies, 15(16): 5884. https://doi.org/10.3390/en15165884
[20] Farhan, A.A., Al-Shamani, A.N., Hawas, M.N. (2025). Experimentally investigation of exergy analysis of Photovoltaic-Thermal (PVT) water cooling. International Journal of Heat & Technology, 43(2): 771-781. https://doi.org/10.18280/ijht.430236
[21] Nižetić, S., Čoko, D., Yadav, A., Grubišić-Čabo, F. (2016). Water spray cooling technique applied on a photovoltaic panel: The performance response. Energy Conversion and Management, 108: 287-296. https://doi.org/10.1016/j.enconman.2015.10.079
[22] Luboń, W., Pełka, G., Janowski, M., Pająk, L., Stefaniuk, M., Kotyza, J., Reczek, P. (2020). Assessing the impact of water cooling on PV modules efficiency. Energies, 13(10): 2414. https://doi.org/10.3390/en13102414
[23] Suzuki Valenzuela, M.F., Sánchez Soto, F., Armendáriz-Ontiveros, M.M., Sosa-Tinoco, I.M., Fimbres Weihs, G.A. (2021). Improving thermal distribution in water-cooled PV modules and its effect on RO permeate recovery. Water, 13(2): 229. https://doi.org/10.3390/w13020229
[24] Erol, H., Uçman, M., Kesilmiş, Z. (2021). Water cooled PV panel efficiency in Osmaniye environment. International Advanced Researches and Engineering Journal, 5(1): 8-13. https://doi.org/10.35860/iarej.787168
[25] Hussein, H.A., Numan, A.H., Abdulrahman, R.A. (2017). Improving the hybrid photovoltaic/thermal system performance using water-cooling technique and Zn-H2O nanofluid. International Journal of Photoenergy, 2017(1): 6919054. https://doi.org/10.1155/2017/6919054
[26] Sultan, S.M., Tso, C.P., N, E.E.M. (2018). A thermal performance study for different glazed water based photovoltaic thermal collectors. AIP Conference Proceedings, 2030(1): 020307. https://doi.org/10.1063/1.5066948
[27] Delač, B., Pavković, B., Grozdek, M., Bezić, L. (2022). Cost optimal renewable electricity-based HVAC system: Application of air to water or water to water heat pump. Energies, 15(5): 1658. https://doi.org/10.3390/en15051658
[28] Kim, J.H., Kim, S.M., Kim, J.T. (2021). Experimental performance of an advanced air-type photovoltaic/thermal (PVT) collector with direct expansion air handling unit (AHU). Sustainability, 13(2): 888. https://doi.org/10.3390/su13020888
[29] Salem, M.R., Elsayed, M.M., Abd-Elaziz, A.A., Elshazly, K.M. (2019). Performance enhancement of the photovoltaic cells using Al2O3/PCM mixture and/or water cooling-techniques. Renewable Energy, 138: 876-890. https://doi.org/10.1016/j.renene.2019.02.032
[30] Nižetić, S., Jurčević, M., Čoko, D., Arıcı, M. (2021). A novel and effective passive cooling strategy for photovoltaic panel. Renewable and Sustainable Energy Reviews, 145: 111164. https://doi.org/10.1016/j.rser.2021.111164
[31] Ţăranu, M.A.N., Hudişteanu, S.V., Cherecheş, N.C., Ţurcanu, F.E. (2022). Cooling methods of photovoltaic/thermal panels. State-of-the-Art Review. Buletinul Institutului Politehnic Din Lasi. Sectia Constructii, Arhitectura, 68(1): 71-88. https://doi.org/10.2478/bipca-2022-0006
[32] Michael, J.J., Iniyan, S. (2015). Performance analysis of a copper sheet laminated photovoltaic thermal collector using copper oxide–water nanofluid. Solar Energy, 119: 439-451. https://doi.org/10.1016/j.solener.2015.06.028
[33] Hoseinzadeh, S., Sohani, A., Samiezadeh, S., Kariman, H., Ghasemi, M.H. (2021). Using computational fluid dynamics for different alternatives water flow path in a thermal photovoltaic (PVT) system. International Journal of Numerical Methods for Heat & Fluid Flow, 31(5): 1618-1637. https://doi.org/10.1108/HFF-02-2020-0085
[34] Awad, M.M., Ahmed, O.K., Ali, O.M., Daoud, R.W. (2022). A comparison study of PV/thermal collector performance using air and water cooling. AIP Conference Proceedings, 2660(1): 020128. https://doi.org/10.1063/5.0124223
[35] Furbo, S., Perers, B., Dragsted, J., Gomes, J., Gomes, M., Coelho, P., Kaliasas, R. (2021). Best practices for PVT technology. In SWC 2021: ISES Solar World Congress pp. 420-429. https://doi.org/10.18086/swc.2021.22.04