Ouf A. Shams*![]() | Samir A. Amin
| Samir A. Amin![]() | Haneen M. Jaber
| Haneen M. Jaber![]() | Mustafa A.S. Mustafa
| Mustafa A.S. Mustafa![]()
© 2025 The authors. This article is published by IIETA and is licensed under the CC BY 4.0 license (http://creativecommons.org/licenses/by/4.0/).
OPEN ACCESS
This study focused on the effects of welding speed and power intensity on distortion and corrosion resistance for alloy steel T-joint weldments. The research was theoretical but also included practical experiments to identify thermodynamic characteristics. The study focuses on the alterations in microstructure and the ability of the weld metal to resist corrosion. Three interconnected modeling operations included structural and thermal evaluations in calculating the microstructure and the deformation of the weld joint. The heat effect zone (HAZ) width in welding speed is 5mm/sec, about 47 mm in the Y direction and 60 mm in the X direction. For 6 mm/sec welding speed, the HAZ was 25 mm in the Y direction and 29 mm in the X direction, and finally, the HAZ width for weldment with 7.5 mm/sec welding speed was 21 mm in the Y direction and 26 mm in the X direction. The highest deformation with 1.08 mm was calculated when welding with lower welding speed and the highest source power. While 0.57 mm deformation was recorded when welding with the highest welding speed and lowest source power intensity. Samples of the weld metal were tested to monitor their weightlessness and corrosion level. The results showed that the size of the HAZ increased with increasing intensities of power. Results reveal that the distortion of weld joint varies inversely with welding velocity and directly relates to power intensity. A microstructural analysis shows that the weld metal has acicular interlocking, polygonal ferrite, and side plates. Acicular ferrite amount influenced weld metal corrosion resistance decreased as power intensities increased. The microstructure of the HAZ is significantly influenced by the intensity of the welding power, which in turn affects the microhardness of the HAZ.
acicular ferrite (AF), corrosion resistance, distortion, heat-affected zone (HAZ), polygonal ferrite (PF), T joint welding, welding input heat, Widmannstetter ferrite
Arc welding establishes an electric current between the electrode and base metals. It is often used in the manufacturing industry. The highly intensive localized heat source, the arc, heats base metals, and that filler wire forms a molten pool similar to their interface [1]. A joint will form between base metals when the weld pool has solidified. Out of the various types of energy used in manufacturing, the electrical power needed to run this process is massive. Controlling the energy flow within the workpiece may minimize this amount. To do this, we can raise the maximum temperature below the heat source and decrease heat loss to the surroundings through base metal [2]. A thorough investigation of thermal-energy transfer in the welding process is necessary to ascertain energy usage. Heat transport, fluid flow, and the work piece's electromagnetic field should all be part of such an analysis. The best way to reduce energy consumption during arc welding is by doing a series of computations that adjust the arc power and speed. This is not new; in the early 1940s, Rosenthal published some work on thermal energy transfer in welding procedures [3]. Research has developed an analytical model for moving heat sources. Still, the research ignored the end effects of starting and stopping in automated welding because it assumed the temperature field was steady in moving coordinates. Outside of the region where the welding pool is located, the anticipated temperature field is satisfactory, even though Rosenthal's model ignores a point heat source, convection, phase change, and heat removal from the workpiece.
Dauod et al. [4] studied the impact of welding parameters on the workpiece temperature field and colleagues. The factors in question were travel speed and energy input. Their findings demonstrated a nearly linear connection between the energy input and the weld peak temperature. Furthermore, it was shown that the welding parameters substantially impacted the fusion zone and heat-affected zone shapes. The model does not account for the convection of fluids in the molten weld pool. The weld's geometry and heat distribution in the workpiece are impacted by fluid flow in the weld pool.
With a consistent ratio of arc power to travel speed, the energy consumption of welding procedures is the same. This is because the energy spent per unit length of material is directly proportional to arc power and inversely proportional to the torch's travel speed [5]. This study uses ANSYS and SOLIDWORKS finite-element software to computationally simulate the impact of welding source power intensity and welding speed on alloy steel T joint weldment distortion and corrosion resistance. The source power controls the welding heat, which affects the weldment elastic yield and can limit mismatch strain due to the welding heating and cooling, which causes the joint components to expand and contract locally due to uneven temperature distribution and large thermal gradients between workpiece parts [6]. Plastic deformation of the element occurs at sufficiently large mismatch strains and significantly affects processing residual stress [7].
Furthermore, as the working life of the workpiece is affected by deformation, cracks, creep damage, and other adverse effects, the mechanical properties of the workpiece connection are altered due to tremendous tensile residual stresses generated by the environment's constraints on the intermediate zone during high temperature melting and cooling solidification [8]. Much research was conducted to adjust various welding parameters, including source power, welding input heat, welding speed, and weld bead dimension effects. The results showed that by selecting optimized parameters, the maximum deformation and residual stress could be reduced, elements at the joint distributed more evenly, thermal properties improved, and the quality of the workpiece weld greatly enhanced. When a heat source is moved over a surface, FE is a valuable tool for predicting the component's thermal history, residual stresses, and deformation [9, 10]. When simulating residual stresses and distortion, the FE constraint is crucial. Several studies used single-point restrictions to forecast the components' residual stress. The residual stress the components experience is becoming more affected by the limitations. It is crucial to pick the proper limits to manage component distortion in real-world applications. Studies and analyses of the impact of constraints take much work to come by in the literature [11].
It is generally known that welding metal cools slower when more heat is applied during welding. This cooling significantly affects the microstructure of weld metal, which in turn affects the local corrosion resistance of the welding joints [12]. Weld metal corrosion resistance varies depending on the variation of welding heat input, and varied cooling speeds result in different microstructures. Welding technique, steel makeup, amount of heat input, and weld cooling rate are all influencers in creating the ferrite during the forming cycle [13]. For instance, acicular ferrite (AF), grain boundary ferrite GBF, polygonal PF, and Widmannstetter.
Nonetheless, acicular ferrite and grain boundary ferrite significantly affect weld metal corrosion resistance [14]. The amount of acicular ferrite and grain boundary ferrite typically affects the corrosion resistance of weld metal. Despite progress in studying the microstructure and mechanical characteristics of acicular ferrite, there remains a lack of knowledge on its impact on corrosion behavior. This is due to the research focus on iron's nucleation and growth process [15]. Compared to allotriomorphic and Widmannstetter ferrite, the acicular ferrite structure offers poorer corrosion resistance; Deen et al. [16] researched the microstructure and electrochemical corrosion behavior of SA516 weld joints. The electrochemical behavior of weld metal is determined by the volume fraction ratio of grain boundary ferrite to acicular ferrite, which examined the effects of microstructure and composition on the electrochemical behavior of A516 steel weldment. Input heat applied during welding significantly impacts the acicular ferrite and grain boundary ferrite.
According to the above literature review, the welding heat input, directly related to the source power intensity and the welding travel speed, strongly correlates to the welding metal's corrosion performance in different situations. Therefore, it is crucial to establish the connection between welding heat input and corrosion performance. Nevertheless, how exactly welding heat input affects the corrosion resistance of carbon steel weld metal is still unknown. Hence, this study compared the effects of various source power intensities and welding speeds on welding deformation and corrosion resistance of carbon steel weld metal's microstructural changes.
This study, therefore, offers novel insights pertaining to the optimization of HAZ dimensions, joint distortion, and improvement in corrosion resistance by informatically integrating computational simulations with experimental validations. Originality and significance may be related to this work because the present research has comprehensively investigated the interplay that exists between welding speed and power intensity on some critical aspects of T-joint weldments in alloy steel. This work originally correlates the welding parameters with those of microstructural evolution and illustrates how controlled changes in welding speed and power intensity can lead to improved thermal and mechanical properties. The obtained results are of great significance in the development of precision welding technologies, especially in those industrial branches where structural integrity and corrosion resistance are of prime importance.
2.1 Generation of computational model
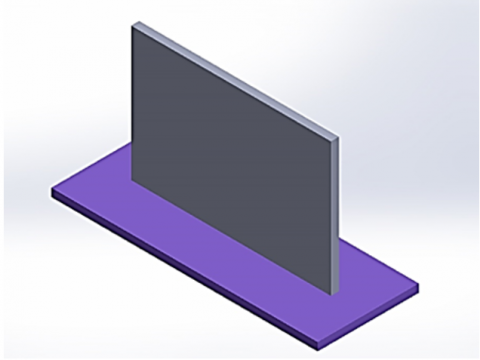
The ANSYS moving heat source analysis extension was used for welding simulation. The technique of shielded metal arc welding was employed in this investigation. The dimensions of the base plate were 200 × 75 × 6 mm, and those of the vertical plate were 150 × 100 × 6 mm, as seen in Figure 1.
Figure 1. SOLIDWORKS T-joint model design
Tables 1 and 2 list the chemical analyses and mechanical parameters of the alloy steel material that was utilized in the FEM simulation, which was initiated once the SOLIDWORKS model was exported to the ANSYS environment for further analysis. The exported model is prepared for meshing and simulation by integrating thermal and structural attributes.
Table 1. Chemical composition of low alloy steel
|
Component |
Value |
|
C |
0.2 |
|
Mn |
1.1 |
|
P |
0.04 |
|
S |
0.04 |
|
Si |
0.27 |
|
Cu |
0.3 |
|
Cr |
0.65 |
|
Mo |
0.45 |
|
V |
0.14 |
|
Ni |
1.1 |
|
Fe |
balance |
Table 2. Mechanical properties of low alloy steel
|
Property |
Value |
|
UTS |
510 (MPa) |
|
Yield tensile |
255 (MPa) |
|
Elongation |
23% max. |
|
Modulus of Elasticity |
200 (GPa) |
|
Bulk Modulus |
160 (GPa) |
|
Poisson's Ratio |
0.29 |
|
Shear Modulus |
80 (GPa) |
2.2 Meshing criteria
Multi-zone meshing carried out in this model allows finer elements to be applied in areas with excessive gradients (e.g., Heat-affected zones, weld pool regions) and coarser elements in areas with lower gradients. This localized refinement ensures that critical thermal and mechanical modifications are captured with high precision. Using finer meshes only where necessary, multi-area meshing reduces the overall range of elements, minimizing computational resources and time whilst retaining accuracy in key areas.
Smaller elements and better node density near weld zones make certain accurate thermal and structural predictions. The number of elements and nodes is optimized to keep stability between computational divergence and simulation accuracy. With 39288 nodes, 6884 elements, and a 3 mm element size, the model was meshed using ANSYS software, as seen in Figure 2.
Figure 2. ANSYS T-joint model mesh
2.3 Boundary conditions and assumptions
An ANSYS moving heat source extension mimics the heat generated by the electrode tip arc. The moving heat source parameters of the three simulation models generate varying source power intensities by adjusting the welding speeds. Table 3 lists the parameters of the three models' moving heat sources. The deformation of the weld joint was calculated using coupled simulation procedures involving structural and thermal evaluations. The simulation model was securely fastened to its base, and each model underwent deformation on one side of the welding process.
Table 3. The parameters of the moving heat sources in three models
|
Model No. |
1 |
2 |
3 |
|
Velocity (mm/s) |
5 |
6 |
7.5 |
|
Radius of beam (mm) |
5 |
5 |
5 |
|
Source power intensity (W/mm2) |
18.6 |
5.5 |
12.4 |
|
Total welding time (s) |
30 |
25 |
20 |
|
Melting temp. (℃) |
1432 |
1432 |
1432 |
2.4 Thermal modeling governing equations
A voltage differential U between the electrode and the base metal is produced by an electrical source during electric arc welding. This difference then forms an electric arc. Radiation and convection inside the electrodes and weldments dissipate energy throughout the process. Therefore, there has to be a variable for power efficiency (represented by the symbol $\eta$) since only a percentage of the energy is used for material melting. Since this is the case, the following formula accurately represents the weld heat input:
$Q=\mathrm{\eta} \cdot U \cdot I$ (1)
The ANSYS thermal model evaluated the joint thermal gradient in X, Y, and Z directions using the heat flux equation illustrated in Eq. (2). This study used moving heat source energy-based balance on control volume within the specified study area. Thermophysical characteristics of the materials strongly impact the item and show a clear relationship with temperature, leading to non-linear heat transmission [17].
$\begin{gathered}\rho(T) c(T) \frac{\partial T}{\partial t}=Q+\frac{\partial}{\partial x}\left[k_x(T) \frac{\partial T}{\partial x}\right]+\frac{\partial}{\partial y}\left[k_y(T) \frac{\partial T}{\partial y}\right]+\frac{\partial}{\partial z}\left[k_z(T) \frac{\partial T}{\partial z}\right]\end{gathered}$ (2)
The heat inputs Q, specific heating c, and densities ρ are provided by the Eq. (2). Conductivity coefficients in directions $k_x,\ k_y$, and $k_z$ in $x,\ y$, and $z$, respectively, are among the other factors. Various things influence the temperature. Welding power is the overall energy consumed in the welding process measured by its units, called Watts. This can be calculated based on the diameter or radius to ascertain what is known as a cross-sectional area of arc welding spot. The following formula could be used to calculate the arc area:
$arc\ area=\pi \times(electrode\ dia./ 2)^2$ (3)
Consequently, the following formula may be used to determine the power intensity:
$Power\ intensity = Welding\ power / arc\ area$ (4)
For arc welding processes, the formula can be derived into the following form:
$power\ intensity=\frac{(\mathrm{\eta} \times V \times A)}{\pi \times(electrode\ dia./ 2)^2 \times S}$ (5)
where, $\eta$ is welding process efficiency, $V$ is the arc voltage, $A$ is the current, and $S$ is the welding velocity.
Moreover, this equation shows that power intensity is proportional not only to voltage and current but also to efficiency, whereas it is oppositely related to electrode radius and velocity. As a result, the output of high-power intensity will be highest upon higher voltage $V$, current $A$, and efficiency $\eta$.
2.5 Simulation process
Many assumptions were made while developing the coupled thermo-mechanical model. The minor effect of stress deformation heat on the temperature field is ignored since it is so tiny compared to the transient thermal field's dominating impact on mechanical properties. Nothing in the temperature or stress field pertains to the latent heat of phase shift or the weak phase transition resulting from stress. Additionally, the effect of the body's gravitational pull on the fluid's flow inside the melt pool must be addressed. The two-stage solution approach used in numerical simulations is known as indirect coupling. The first step is performing a moving heat source thermal analysis on the fusion zone and the surrounding area to determine the dynamic thermal distribution and evolution. Afterward, a linear static stress analysis is carried out. Mechanical elastic-plastic calculations rely on the node temperature distribution derived from a thermal load used in stress analysis. Mechanical computing makes use of boundary restrictions to prevent inflexible body movement. The finite element (FE) model is fixed at the T-joint base of the weldment. The total simulation time was 30 sec., and the simulation was done by using (a moving heat source) ANSYS ACT.
3.1 Weld metal microstructure
The weld metal and HAZ specimens were physically polished to 1000 grit, cleaned with deionized water, and degreased in acetone before being subjected to optical examination. A 4% (volume fraction) nitric alcohol solution, made of analytical grade chemicals and deionized water to mimic the water generated from oil and gas, was used to etch the test solution. To observe and analyze the microstructure of the weld metal and HAZ at varied source power intensities, optical microscopy (OM, Leica Qwin500) was utilized.
3.2 Microhardness test
Metallographic specimen across the welding joint and HAZ used to microhardness survey with Vickers microhardness testing machine working with 100 gf load and 500 µm period between marks to test the alteration of power intensity on the weld joint, HAZ, and base metal microstructure mechanical properties.
3.3 Corrosion test
Weight loss and depth tests measure the weld metal's corrosion rate. Three samples were cut from the welding zone after various welding with different source power intensities. The samples were rinsed, dried, and weighed. Experimental conditions included a 10-day incubation period at 20℃ in a 3.5 wt.% NaCl solution. Three comparable samples were utilized for every source power condition to maintain experimental reproducibility. Welding samples were cleaned from the rust by Immersing the corroded objects in a solution of 50 mL hydrochloric acid, 6 g hexamethylenetetramine, and 50 mL deionized water for 3-5 minutes. Subsequently, we proceeded to dry them once again. The calculation for reducing sample weight may be determined using the following equations:
$v_1=\frac{w_0-w_1}{A \times t}$ (6)
$v_1=\frac{w_0-8.75}{\rho}$ (7)
In these equations, $\mathrm{v}_1$ denotes corrosion rate, $\mathrm{w}_0$ and $\mathrm{w}_1$ denote the initial and final sample weights, $A$ and $t$, respectively, represent the exposed surface area and corrosion duration, and $\rho$ refers to the density.
4.1 Heat distribution analysis
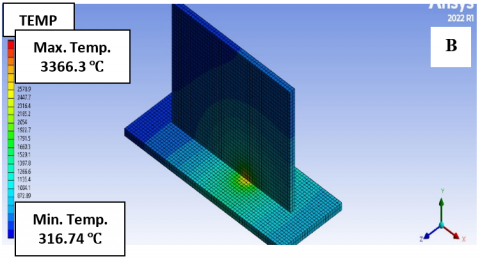
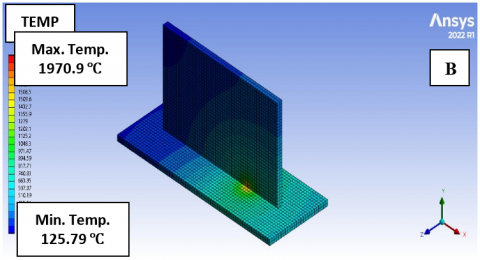
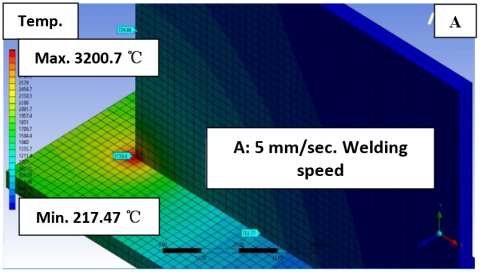
Temperature data is obtained from different locations about every 5 seconds. Three models with different source power intensities were tested experimentally to find the heat-affected zone fusion zone's computed temperature distributions and size and how these variables changed over time. Figures 3, 4, and 5 show the welding temperature distribution as a function of time at different locations inside the weldment. The figures also illustrate the dimension of the HAZ in the x, y, and z directions for the three experimental models. The results show that the HAZ stretched to the end of the base plate in the Z direction parallel to the welding zone, as illustrated in Figure 3(A), (B), (C), and (D) after 1, 11, 20 and 30 sec, respectively with 5 mm/s welding speed. The maximum fusion zone temperature is found when welding with 5 mm/sec welding speed; this result agrees with the mathematical Eq. (5); according to this equation, the source power intensity is inversely proportional to the welding speed, that is, mean when welding with lower welding speed the welding zone will be exposed to higher power intensity which resulted in raising the fusion zone temperature and even evaporated the molten metal inside it.
In the Initial Stages, at 1 sec, heat is quite concentrated near the welding arc, as predicted due to the localized welding power input. The temperature distribution is steep, with great gradients surrounding the heat source. As the welding manner progresses for 11 seconds, the heat spreads outward from the weld line, creating an extra uniform temperature distribution along the X and Y guidelines. The HAZ starts to take form, defined with the aid of its increased temperatures compared to the base metal; however, it decreases than the weld pool [18]. The heat has propagated to a wider location with the remaining level (20-30) sec, with the maximum temperature nonetheless concentrated in the fusion region. The fusion region's length and temperature distribution are prompted with the aid of the welding speed and source power intensity. Lower welding speeds, as in this version, bring about higher temperatures and wider HAZ zones.
Figure 3. Heat distribution of 5 mm/sec. welding speed after (A) 1 sec., (B) 11 sec., (C) 20 sec., and (D) 30 sec.
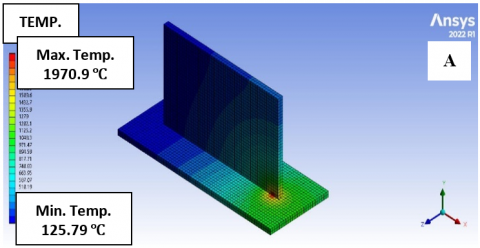
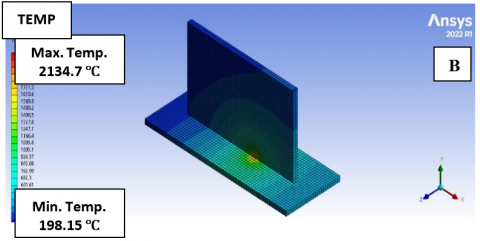
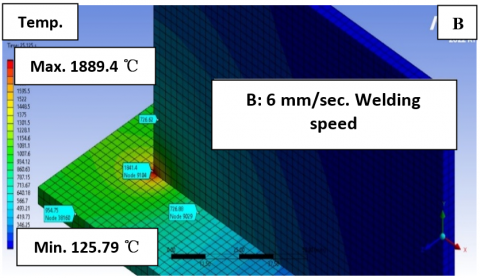
Figures 4(A), B), (C), and (D) show the heat distribution after 1, 6, 18, and 25 sec, respectively, with 6 mm/s welding speed.
Similar to the decreased velocity situation shown in Figure 3, the initial heat distribution is fairly concentrated near the welding arc. The fusion zone experiences the best temperature, as predicted, because of direct exposure to the heat supply [19]. Compared to Figure 3, the heat is slightly less subtle at this stage, reflecting the impact of the faster welding velocity, which reduces the length of heat exposure at any given point. The increase in welding speed from 5 mm/sec to 6 mm/s ends in a significant reduction in the size of the HAZ. At 6 mm/sec, the HAZ dimensions are about 25 mm in the Y direction and 29 mm in the X direction, appreciably smaller welding velocity. The decreased thermal input is consistent with unit duration because quicker welding velocity results in a smaller HAZ. This relationship aligns with the inverse proportionality between welding speed and power intensity, Eq. (5).
Figure 4. Heat distribution of 6 mm/s welding speed sample after (A) 1 sec., (B) 6 sec., (C) 18 sec., and D) 25 sec.
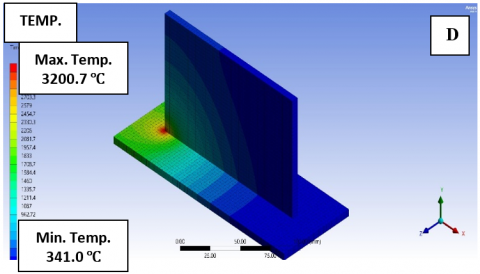
Figure 5 shows the heat distribution of the 7.5 mm/sec welding speed sample for (A) 1 sec., (B) 7 sec., (C) 15 sec., and (D) 20 sec.
Figure 5. Heat distribution of 7.5 mm/sec welding speed sample for (A) 1 sec., (B) 7 sec., (C) 15 sec., and (D) 20 sec.
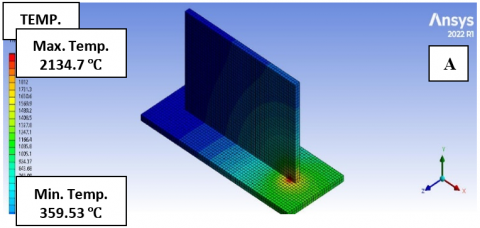
The heat distribution results in Figure 5 correspond to a welding speed of 7.5 mm/sec, representing the quickest speed in a few of the instances analyzed. This welding pace demonstrates large adjustments within the heat distribution and HAZ characteristics compared to the slower speeds of 5 mm/s in Figures 3 and 6 mm/s in Figure 4. At 7.5 mm/s, the HAZ dimensions are about 21 mm inside the Y direction and 26 mm inside the X direction. This is the smallest HAZ for the 3 welding speeds analyzed: 5, 6, and 7.5 mm/s. The faster welding speed reduces the heat input consistently with time duration, resulting in a smaller and much less pronounced HAZ. The power intensity is inversely proportional to the welding speed, Eq. (5). At 7.5 mm/sec, the heat entry is minimal compared to the slower speeds, at once contributing to the smaller HAZ. The rapid welding drastically reduces the exposure time of any point to the heat supply, leading to quicker cooling and a smaller fusion zone. Cooling rates are highest at this speed, which could have both high and terrible effects.
Figure 6. HAZ dimensions in X and Y directions. (A) 5 mm/sec welding speed, (B) 6 mm/sec welding speed, and (C) 7.5 mm/sec welding speed
When welding the alloy steel, the HAZ must be carefully considered; the temperature range of 1,200℃ to 723℃ defines the HAZ size. The grain growth response was among the notable alterations throughout a high-intensity 1200℃ thermal cycle. It is a natural consequence of going from one peak to another, as the grain boundary movement at this specific temperature is the most critical of all heating cycles [20]. Extra grains are also produced. It has been shown that austenitic steels typically lose their glassy condition intermittently when welded or heated to high temperatures for extended periods [21]. Simulation results in Figure 6 show that the HAZ width is directly proportional to increased source power intensity due to increased welding input heat; increasing the HAZ width will lower the required thermal stresses to deform the weldment and alter its shape or dimensions. In addition, the critical phase transformation affected the weld joint's mechanical properties and usability.
The HAZ width in welding speed is 5 mm/sec, about 47 mm in the Y direction and 60 mm in the X direction, as illustrated in Figure 6(A). For 6 mm/sec welding speed, the HAZ was 25 mm in the Y direction and 29 mm in the X direction, as shown in Figure 6(B), and finally, the HAZ width for weldment with 7.5 mm/sec welding speed was 21 mm in the Y direction and 26 mm in X direction as demonstrated in Figure 6(C). These results give strong evidence about the welding speed's impact on determining the HAZ effects and controlling the mechanical properties of the weld joint.
4.2 Deformation analysis
Reduction of deformation is a critical function in alloy steel welding. The heat produced by welding alters the material structure by causing recrystallization, grain growth, and precipitate dissolution, a well-known phenomenon. It should be noted that because of specific characteristics, austenitic alloy steels are especially vulnerable to distortion when welding. During the welding process, the material may bend or shift, which is distortion. Due to its compromise of strength and functionality, this distortion can present problems for welded structures [22]. Based metal's mechanical and thermal characteristics are crucial when considering weld distortion. Yield strength, Young's modulus, thermal expansion coefficient, thermal conductivity, and specific heat are the most influential attributes of base metals on weld distortion. The Young's Modulus, which is proportional to the stiffness of the base material, drops as the temperature rises [23]. Thermal stresses cannot cause plastic deformations if the yield strength is too great; in this case, we would only see elastic strains and no plastic deformations. The welding distortion of a material is influenced by its high-temperature yield strength. Elevated yield strength was associated with a rise in angular distortion. As the temperature rises, high-strength steels outperform mild steels in yield strength. As a result, mild steels are more resistant to deformation than high-strength steels [24]. As a result of the phase transition effect, residual stresses and distortions can be altered in some steel grades. Metallic martensitic fractions vary between steel classes due to maximum temperature and cooling rate differences.
In contrast to its substantial impact on distortion for intermediate and high-carbon steels, the phase transition does not influence low-carbon steels. Austenite transformation to martensite occurs when the cooling rate is sufficiently high. When a substance undergoes this change, its overall volume increases. This volume gain partially cancels the transverse shrinkage, reducing weld distortion in high and medium-carbon steels. The increase in volume produces compressive stresses, but residual stresses are reduced for mid and high-carbon steels [25]. According to that, the simulation results of welding distortion for the three welding speed models are inversely proportional between the welding speed and the welding joint distortion and directly proportional to the source power intensity. The most important advantage of increasing the welding speed and lowering the source power intensity is the reduction in the HAZ complex zone, which resulted from the high cooling rate from the high source power intensity. In addition, this hard zone would accommodate the stresses from the phase transformations and weld metal solidification processes.
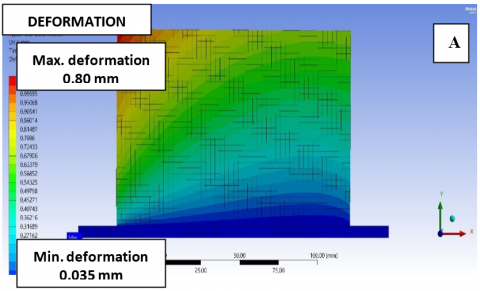
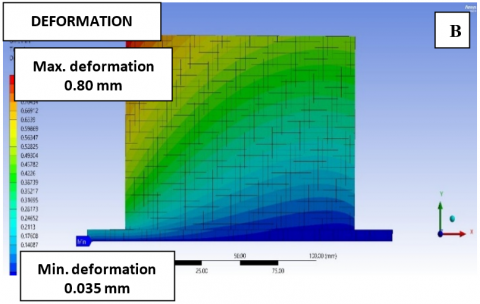
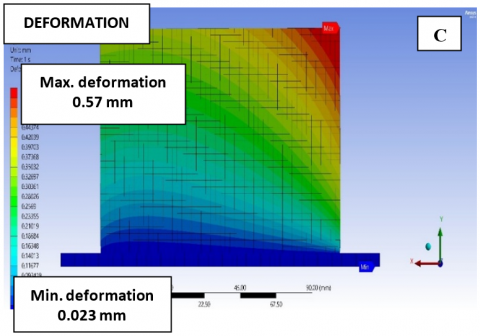
Figure 7. Maximum and minimum deformation locations: (A) 5 mm/s welding speed, (B) 6 mm/s welding speed, and (C) 7.5 mm/s welding speed
Figure 7 offers the deformation outcomes for the welding simulations carried out at three welding speeds of 5, 6, and 7.5 mm/s. These results replicate the thermal and mechanical interactions that occur at some point in the welding manner, highlighting the effect of welding speed on deformation in the weld joint 5 mm/s, shown in Figure 7(A) reveals the largest deformation of 1.08 mm, mostly due to the longer exposure time of the material to the heat source. Lower welding speeds bring about extra heat input in step with unit length, main to better thermal gradients and elevated thermal enlargement. This, in turn, reasons large plastic deformations upon cooling. Deformation is reduced to 0.80 mm because the welding velocity increases to 6 mm/s, Figure 7(B). The shorter publicity time decreases the overall heat input, decreasing thermal gradients and the significance of residual stresses. The stability between thermal entry and cooling charge starts to decrease distortion. 7.5 mm/s, in Figure 7(C), welding speed produces the least deformation of 0.57 mm, way to the minimum heat entry and speedy cooling associated with the faster velocity. The reduced thermal gradients restrict base metal grain enlargement and contraction, resulting in lower residual stresses and distortion. The effects display an inverse relationship between welding speed and deformation. Faster welding speeds reduce the heat input in line with unit length, leading to decreased thermal gradients and smaller deformations. Also, the results tested that deformation is localized near the weld pool and reduces progressively with distance from the welding line. This pattern is regular across all speeds; however, it is most suggested at 5 mm/sec due to the better heat entering. Faster welding speeds lessen the volume of deformation, with smaller affected areas around the weld pool.
4.3 Microstructural observation
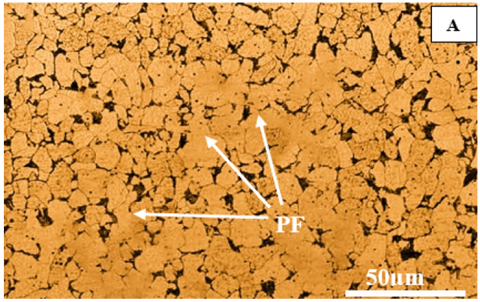
The sample's microstructures are shown in Figure 8 as optical micrographs at various source power intensities and welding speeds. Polygonal ferrite (PF) was grown along the grain boundary; ferrite side-plate (FSP) evolved into the grain from the boundary. Interlocking acicular ferrite (AF) growth in the intergranular spaces makes up weld metal microstructure. The weld metal cooled to 680 - 770℃ temperature at a fast rate at the grain boundary will increase its energy and create the ideal conditions for nucleation of phase transitions (PF). PF is most abundant at grain boundaries that have already formed austenite and are distributed in strips or polygons along these boundaries. The quantity of PF in the weld metal might grow dramatically, and it stays at high temperatures for longer or cools down more slowly [26]. Weld metal with slated or jagged ferrite is readily apparent when FSP is formed, which occurs at a lower temperature than PF [27]. Prior austenite grains include AF, dispersed acicularly and can expand radially around micro-inclusions like oxides and nitrides.
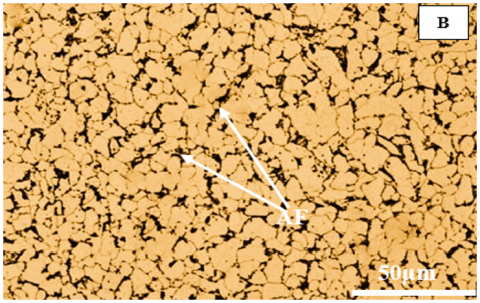
The corrosion property of weld metal might be diminished as the quantity of AF in the weld increases. Diffusion and shear processes can explain how AF forms, which is why this phenomenon is associated with AF. More corrosion flaws can increase the corrosion rate [28]. As a result of the multiple dislocations created during the AF transition, a polygonal ferrite with a high dislocation density is formed. Another benefit of AF is that it can enlarge the crystal's grain boundary, which means that carbon can diffuse to the boundary during the development process and enhance the grain boundary's activity by producing a carbon-rich film [29, 30]. The galvanic effect can speed up the electrochemical corrosion rate of weld metal, and corrosion cells are created when AF encounters other microstructures. Therefore, changes in microstructure are associated with changes in corrosion rate. The microstructure in Figure 8(A) shows high PF formation due to the high source power intensity and high heat input due to the low welding speed, which leads to a fast cooling rate. This structure would be the weakest structure in the corrosion resistance characterizes. Figure 8(B) demonstrates microstructure with approximately equal amounts of PF and AF structure, producing moderate corrosion resistance.
The best corrosion resistance microstructure in this investigation can be noticed in Figure 8(C); high AF formation at the grain boundary can observed due to the low source power intensity and high welding speed. These results proved simulation results and clearly illustrated the effects of the welding speed and source power intensity on welding joint corrosion resistance. Tests for weight reduction are detailed in Table 4. This test also examines how various source power and speed circumstances affect the weight loss caused by the weld metal's corrosion. Table 4 demonstrates that as the intensity of the welding source increases, so does the weight loss of the samples. The corrosion sample for the weld joint reached its highest value, and the weld metal's corrosion properties deteriorated when the welding source power intensity went to 18.6 W/mm2.
Figure 8. Weld joint microstructure: (A) 5 mm/sec welding speed, (B) 6 mm/sec welding speed, and (C) 7.5 mm/sec welding speed
Table 4. Weld samples weight loss under different source power intensities in 3.5 wt.% NaCl solution for ten days
|
Source Power Intensity (W/mm2) |
Initial Weight (g) |
Final Weight (g) |
Sample Size (mm) |
|
18.6 |
1.4362 |
1.4302 |
10×10×2 |
|
15.5 |
1.4412 |
1.4391 |
10×10×2 |
|
12.4 |
1.4248 |
1.4241 |
10×10×2 |
4.4 Heat-affected zone microstructure and microhardness
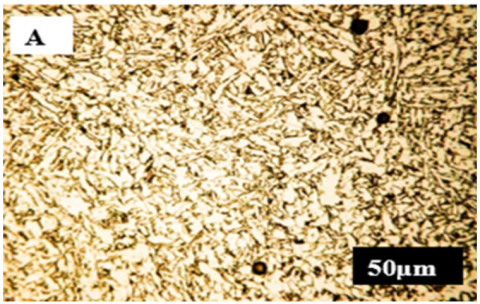
The sample is a conventional alloy steel with a reduced carbon percentage. As the FZ slowly cooled from the γ-austenite phase with a face-centered cubic microstructure to a temperature below 1173 K, the development of α-ferrite with a body-centered cubic crystal structure begins and increases with time. As the carbon concentration increases, the amount of remaining austenite decreases progressively. At the equilibrium temperature of around 1000 K, the remaining austenite reaches a composition referred to as the eutectoid composition, which contains 0.76% carbon. As the temperature drops, austenite fully transforms into pearlite. The microstructure comprises Widmannstetter ferrite (WF), polygonal ferrite (PF), bainite (B), martensite, and acicular ferrite (AF), as shown in Figure 9(A) with a hardness value of 269 HV.
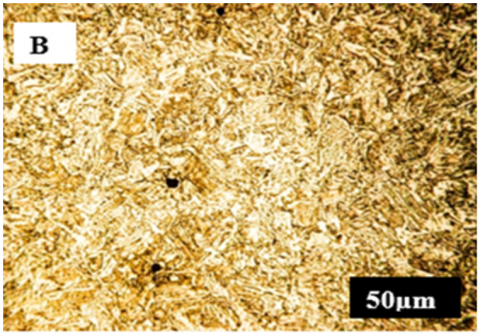
Figure 9. Heat-affected zone (HAZ) microstructure: (A) 7.5 mm/s welding speed, (B) 6 mm/s welding speed, and (C) 5 mm/s welding speed
The micrograph (b) in Figure 9 shows a hardness value of 248 HV. As the welding power source's intensity increases, the cooling rate slows down, causing the bainitic reaction to drastically slow down or almost completely halt, even if a minor amount of bainite is still visible in the sample's micrograph. Furthermore, at this cooling rate, the emergence of pearlitic islands is noticeable. At this stage, the transformation process that excludes diffusion, including the development of martensite and bainite, has ceased, and phases influenced by diffusion, such as pearlite, start to form. The micrograph in Figure 9(C) shows that heat agitation destabilizes the α-ferrite crystal structure. After this stage, structural alterations or recrystallization are unlikely because of the slow cooling rate. Pearlite becomes visible when it reaches a hardness of 154 HV. The sample underwent a complete transformation into a ferritic matrix with pearlitic islands at the slowest cooling rate used. The findings showed how the intensity of the welding power source influenced the microstructures and microhardness of the heat-affected zone (HAZ) and, subsequently, the mechanical characteristics of the welding joint.
The main objective of this experiment was to find out how distortion and corrosion resistance are affected by power intensity and welding speed in alloy steel T joint weldments. The authors studied the mechanical and thermal behavior of the weld joint, the microstructural changes, and the corrosion performance of the weld metal using computational simulations and experimental measurements.
The investigation has also revealed a negative correlation between welding speed, power intensity, and deformation. Conversely, the opposite was seen for the association between welding speed and these remaining other factors. It was noted that the welding joints experienced less distortion when an increment was observed in the welding speed, which is quite opposite to the power intensity. Upon examining the welding of the metal's microstructure, it was revealed that parts of ferrite side plates, polygonal ferrite, PF, FSP, and AF interlocking existed. The amount of AF in the welding and the intensity of welding power were both seen to have an inverse relationship of parameters in addition to an increase in corrosion defects when an increment is noted in the amount of AF. The HAZ microstructures and microhardness measurements reflect the high impacts of the welding power intensity on the microstructure type and its microhardness values, as it's known the microstructure type will determine the HAZ mechanical properties and the weldment fits with the design criteria.
The results of this study demonstrated that if welding conditions and parameters are optimized, the resistance to corrosion, the induced residual stresses, and the deformation in the welding joints may all be enhanced. The demands of industrial businesses are highly requirable; hence, this study has good potential for future implications.
The major limitation of this research paper was the lack of (moving heat source) ANSYS ACT in simulating the welding bead geometry. As it's known, this ANSYS ACT treated the welding joint as a straight line which neglected the joint design impacts. Also, the absence of a thermal camera was one of the biggest limitations in expanding this research results.
|
HAZ |
heat affected zone |
|
ANSYS |
computational software suite used for engineering simulation. |
|
FEM SOLIDWORK |
finite Element Method. computer-aided design (CAD) software program. |
|
UTS |
ultimate Tensile Strength |
|
V |
welding voltage, Volt |
|
I |
welding current, Amp. |
|
T |
temperature, ℃, K |
|
C |
specific heat, J/kgꞏK |
|
kx, ky, and kz |
conductivity coefficients in directions x, y, and z |
|
S |
welding speed, mm/s |
|
w0 |
initial sample weight, kg |
|
w1 |
final sample weight, kg |
|
A |
exposed surface, mm2 |
|
t |
corrosion duration |
|
Greek symbols |
|
|
Q |
weld heat input, J |
|
$\eta$ |
power efficiency |
|
$\rho$ |
density, kg/m3 |
|
$v_I$ |
corrosion rate |
[1] Elsen, M.V., Baelmans, M., Mercelis, P., Kruth, J.P. (2007). Solutions for modeling moving heat sources in a semi-infinite medium and applications to laser material processing. International Journal of Heat Mass Transfer, 50(23-24): 4872-4882. https://doi.org/10.1016/j.ijheatmasstransfer.2007.02.044
[2] Abdulameer, A.G., Mohammed, M.S., Abbas, A.S. (2022). Microstructure variation effects influence on characteristics and mechanical properties of Monel 400 and low alloy steel (ASTM 387-Gr.11) GTAW dissimilar joint. Eastern-European Journal of Enterprise Technologies, 5(12(119): 13-20. https://doi.org/10.15587/1729-4061.2022.266264
[3] Rosenthal, D. (1941). Mathematical theory of heat distribution during welding and cutting. Weld Journal, 20: 220-234.
[4] Dauod, D.S., Wade, K.J., Mohammed, M.S., Majdi, H.S. (2024). Analysis of shielding gases influences 304 gas metal arc welding microstructure, weld geometry, and mechanical properties. Revue des Composites et des Matériaux Avancés-Journal of Composite and Advanced Materials, 34(4): 435-446. https://doi.org/10.18280/rcma.340405
[5] Joshi, S., Hildebrand, J., Aloraier, A.S., Rabczuk, T. (2013). Characterization of material properties and heat source parameters in welding simulation of two over-lapping beads on a substrate plate. Computational Material Science, 69: 559-565. https://doi.org/10.1016/j.commatsci.2012.11.029
[6] Wan, Y., Jiang, W., Song, M., Huang, Y., Li, J., Sun, G., Shi, Y., Zhai, X., Zhao, X., Ren, L. (2019). Distribution and formation mechanism of residual stress in duplex stainless steel weld joint by neutron diffraction and electron backscatter diffraction. Materials & Design, 181: 108086. https://doi.org/10.1016/j.matdes.2019.108086
[7] Zhang, H., Wang, Y., Han, T., Bao, L., Wu, Q., Gu, S. (2020). Numerical and experimental investigation of the formation mechanism and the distribution of the welding residual stress induced by the hybrid laser arc welding of AH36 steel in a butt joint configuration. Journal of Manufacturing Processes, 51: 95-108. https://doi.org/10.1016/j.jmapro.2020.01.008
[8] Weltevreden, M., Coules, H., Hadley, I., Janin, Y. (2023). Statistical analysis of residual stresses in austenitic pipe girth welds. Science and Technology of Welding and Joining, 28(5): 381-387. https://doi.org/10.1080/13621718.2023.2164962
[9] Venkatkumar, D., Ravindran, D. (2019). Effect of boundary conditions on residual stresses and distortion in 316 stainless steel butt welded plate. High Temperature Materials and Processes, 38: 827-836. https://doi.org/10.1515/htmp-2019-0048
[10] Dauod, S.D., Mohammed, S.M., AZIZ, I.A.A., Abbas, A.S. (2023). Mechanical vibration influence in microstructural alterations and mechanical properties of 304 stainless steel weld joints. Journal of Engineering Science and Technology, Special Issue on Development of Sustainability Systems - I, 33-54.
[11] Mohamed, M.S., Abtan, A.A., Moosa, A.U. (2023). Microstructure and mechanical properties assessments of 304 austenitic stainless steel and Monel 400 dissimilar GTAW weldment. Revue des Composites et des Matériaux Avancés-Journal of Composite and Advanced Materials, 33(3): 135-144. https://doi.org/10.18280/rcma.330301
[12] Alizadeh, M., Bordbar, S. (2013). The influence of microstructure on the protective properties of the corrosion products layer generated on the welded API, X70 steel in chloride solution. Corrosion Science, 70: 170-179. https://doi.org/10.1016/j.corsci.2013.01.026
[13] Lee, J.S., Jeong, S.H., Lim, D.Y., Yun, J.O., Kim, M.H. (2010). Effects of welding heat and travel speed on the impact property and microstructure of FC welds. Metals and Materials International, 16: 827-832. https://doi.org/10.1007/s12540-010-1021-8
[14] Park, K.T., Hwang, S.W., Ji, J.H. (2011). Inclusions nucleating intragranular polygonal ferrite and acicular ferrite in low alloyed carbon manganese steel welds. Metals and Materials International, 17: 349-356. https://doi.org/10.1007/s12540-011-0425-4
[15] Huang, H.H., Tsai, W.T., Lee, J.T. (1994). The influences of microstructure and composition on the electrochemical behavior of A516 steel weldment. Corrosion Science, 36(6): 1027-1038. https://doi.org/10.1016/0010-938X(94)90201-1
[16] Deen, K., Ahmad, R., Khan, I., Farahat, Z. (2010). Microstructural study and electrochemical behavior of low alloy steel weldment. Materials & Design, 31(6): 3051-3055. https://doi.org/10.1016/j.matdes.2010.01.025
[17] Sattarpanah, K.S., Moradi, S., Aghaee, A.M., Rasouli, S.A., Ghoreishi, M., Lawrence, J., Ibrahim, H. (2021). Experimental and numerical analysis on TIG arc welding of stainless steel using RSM approach. Metals, 11(10): 1659. https://doi.org/10.3390/met11101659
[18] Padmanabhan, R., Balusamy, V., Nouranga, K.N. (2015). Effect of process parameters on the tensile strength of friction stir welded dissimilar aluminum joints. journal of Engineering Science and Technology, 10(6): 790-801.
[19] Rati, S., Moeed, K.M. (2019). Effects of process parameters and alloying elements on micro-hardness distribution in pulse arc 304l austenitic stainless steel welded plates. Journal of Engineering Science and Technology, 14(4): 2271-2291.
[20] Hamdey, M.D., Mohammed, M.S., Kareem, A.H., Majdi, H.S. (2024). Thermal and mechanical analysis in joint welding of thick steel alloy plates with and without backing plate. Journal of Engineering Science and Technology, 19(5): 1974-1989.
[21] Hamza, S., Boumerzoug, Z., Boumerzoug, E.R., Delaunois, F. (2019). Simulated heat affected zone in welded stainless steel 304l. Acta Metallurgica Slovaca, 25(3): 142-149. https://doi.org/10.12776/ams.v25i3.1290
[22] Heinze, C., Schwenk, C., Rethmeier, M. (2012). Effect of heat source configuration on the result quality of numerical calculation of welding-induced distortion. Simulation Modelling Practice and Theory, 20(1): 112-123. https://doi.org/10.1016/j.simpat.2011.09.004
[23] Kumar, P. (2015). Parametric optimization of angular distortion on mild steel by using MIG welding. International Journal of Advanced Engineering Technology, 6: 41-46.
[24] Narang, H.K., Mahapatra, M.M., Jha, P.K., Biswas, P. (2018). Experimental and numerical study on effect of weld reinforcement on angular distortion of SAW square butt welded plates. Journal of Welding and Joining, 36(2): 48-59. https://doi.org/10.5781/JWJ.2018.36.2.8
[25] Deng, D. (2009). FEM prediction of welding residual stress and distortion in carbon steel considering phase transformation effects. Materials and Design, 30(2): 359-366. https://doi.org/10.1016/j.matdes.2008.04.052
[26] Qin, H., Tang, Y.C., Liang, P. (2021). Effect of heat input on microstructure and corrosion behavior of high strength low alloy steel welds. International Journal of Electrochemical Science, 16(4): 210449. https://doi.org/10.20964/2021.04.07
[27] Shao, Y., Liu, C.X., Yan, Z.S., Li, H.J., Liu, Y.C. (2018). Formation mechanism and control methods of acicular ferrite in HSLA steels: A review. Journal of Materials Science & Technology, 34(5): 737-744. https://doi.org/10.1016/j.jmst.2017.11.020
[28] Zhang, Y.X., Zhang, S.M., Liu, K. (2024). Review on corrosion mechanism and mechanical properties degradation of building structural steel. E3S Web of Conferences, 490: 02012. https://doi.org/10.1051/e3sconf/202449002012
[29] Křivý, V. (2022). Special issue: Corrosion properties and mechanism of steels. Materials, 15(19): 6796. https://doi.org/10.3390/ma15196796
[30] Tyagi, P., Goulet, T., Riso, C., Stephenson, R., Chuenprateep, N., Schlitzer, J., Benton, C., Garcia-Moreno, F. (2019). Reducing the roughness of internal surface of an additive manufacturing produced 316 steel component by chempolishing and electropolishing. Additive Manufacturing, 25: 32-38. https://doi.org/10.1016/j.addma.2018.11.001