Mohammed M. Alkhafaji![]() | Mohammed S. Mohammed
| Mohammed S. Mohammed![]() | Samir A. Amin
| Samir A. Amin![]() | Laith J. Habeeb*
| Laith J. Habeeb*![]() | Hasan S. Majdi
| Hasan S. Majdi![]()
© 2025 The authors. This article is published by IIETA and is licensed under the CC BY 4.0 license (http://creativecommons.org/licenses/by/4.0/).
OPEN ACCESS
Shielded metal arc welding achieves copper to stainless steel joints using Cu-based and Fe-based electrodes. ANSYS and SOLIDWORKS models predicted the welding heat distribution and HAZ dimension for both welding electrodes. According to the heat distribution results, deformation and stress distribution for both models were calculated. ANSYS software was used to calculate the HAZ and fusion zone width for both sides and both electrodes; the results showed 1.9 mm on the stainless-steel side, 6.24 mm on the copper side for ECuSi, and 6.7 mm for the stainless-steel side, 7 mm for the copper side in E308 sample. The stress models illustrated higher stress on the stainless steel side for both the welding sample and in fixtures for both sides. The estimated deformation results were 0.40 and 0.48 mm for ECuSi and E308, respectively. Weld zone in Cu-based filled joint consists of uniform structure with Cu solid solution phase. Immiscible Cu and Fe mixture causes weld segregation in Fe base electrode joint. Weld zones containing a combination of phases in the Fe-based filled joints exhibit greater microhardness than the Cu-based joints. Cu-based joint achieves highest tensile value, reaching up to 80% copper tensile strength. Heat treatment causes reduction in dislocation density and increases grain size, resulting heat-affected zone (HAZ) softening on both joints copper side. This softening makes HAZ susceptible to fracture during tensile testing. Every joints fractures in ductile manner and plastic deformation is concentrated on softened copper side. Welding joint filled with Cu displays the most plastic deformation due to the significant displacement of both the welding zone and Cu base metal. This deformation primarily produced by weld high plasticity, which helps reduce stress concentration.
copper matrix, deformation, dissimilar welding, Fe globules, intergranular stress, stainless steel welding
Dissimilar materials welding joints extensively used in several sectors to meet specific demands for distinct features and performance. A combination of AISI 304 stainless steel and copper is extensively used in power generating units, chemical plants, and nuclear sectors. The solubility of this mixture under welding conditions is a matter of concern [1]. Combining metals with disparate melting temperatures or thermal conductivities poses challenges because one of the metals will melt before the other. Varying thermal conductivities of materials result in uneven distribution and partitioning of heating around weld contact [2]. Heat dissipation of AISI 304 SS is limited because of stainless steel's low thermal conductivity. Copper has ten times better thermal conductivity than steel. However, while welding AISI 304 SS and copper, copper's high thermal conductivity acts as a heat sink, soaking up enormous heat and leaving just a tiny percentage of welding heat for metal [3].
The significance of copper to stainless steel welding systems is growing in fields including heat and energy transmission due to copper's exceptional electrical and thermal conductivity [4], as well as the superior mechanical qualities of stainless steel [5]. Nevertheless, a good-sized disparity in thermophysical tendencies between copper (Cu) and stainless steel (SS) poses annoying conditions when fusion welding between two materials is done [6]. In addition, the Cu and Fe factors generally tend to split inside the weld vicinity, compromising the joints' mechanical traits [7]. Various fusion welding strategies have been hired to address the aforementioned difficulties. High-strength density heating strategies, together with electron beam and laser welding, consciousness excessive heat appropriately direct it to the favored area during the welding process [8]. Research on this vicinity [9] has established that reducing the quantity of copper inside the weld area is crucial for enhancing the overall performance of joints. Prior research on copper-to-stainless steel welding has proven that a lower copper melting amount reduces joint flaws. Conversely, an improved melting quantity of copper might bring about an uneven composition, and massive micro-cracks appear in welding metal [10]. Investigate fusion joint atomic structure in electron beam welded copper stainless steel joints. The findings point to complex and varied microstructures creation inside fusion zones as insufficient welding process mixing and rapid cooling consequence [11]. Copper-stainless steel electron beam welding junctions without defects may be accomplished [12]. Weld metal was composed from dendritic α phase, which consisted of copper in iron, and spherical ɜ phase, which comprised iron in copper. The joints achieved an optimal strength of 276 MPa. Shield metal arc welding (SMAW)is a widely used technology technique in engineering due to its simplicity and low cost-effectiveness.
Nevertheless, the heating inefficiency and prolonged heating duration of this heating method, when compared to high power density sources, diminish heat effectiveness and complicate molten metal flow [13]. Consequently, research has examined fillers impact on welding joint microstructure and mechanical characteristics. Prior researchers conducted a study comparing 316, copper, and Ni-Cu-Fe fillers impact on copper and 304 stainless steel gas tungsten arc (GTA) welded joint mechanical characteristics and microstructures [14]. The copper filler ended in a junction that turned free of flaws and had quality tensile strength. However, the opposite joints exhibited solidification fissures and the absence of fusion faults. The study also investigated the effects of Monel (ENiCu7), Inconel (ENiCrMo3), and stainless steel (E316 L) electrodes on copper to stainless steel shielded metal arc welding (SMAW) welding joint [15]. The Inconel electrode established superior fusion and electricity, making it the foremost desire for copper-stainless steel SMAW. Concurrently, studies on Sn-bronze filler metallic have proven that this specific filler metal can cause porosity and spatter flaws, leading to the weld's brittleness. In assessment, a flawless connection was obtained using a nickel superalloy, which broke on the copper heat-affected zone (HAZ), displaying 208 MPa tensile strength [16]. Comparison of mechanical properties and microstructures of bronze and stainless steel joints, focusing on the impact of Si and stainless steel filler metals. The Si-bronze-stuffed joint exhibited little intermixing in the weld sector, resulting in a joint strength of approximately 90% compared to the bottom Si-bronze.
Fillers have important welding residences relying on particular filler metals used [17]. The objective is to elucidate the impact of filler on joint microstructures and attributes in particular welding techniques to facilitate the selection of appropriate filler and maximize the performance of welding joints. Recently, there has been growing interest in using MIG-TIG arc welding (DSAW) to combine dissimilar metals. This technology is understood for its low welding heat input and correct electricity control. Multiple research investigations have shown the excellent MIG-TIG double-sided welding of Ti/Fe [18], Fe/Al [19], and Ti/Al. This investigation suggested using the SMAW technique for joining copper and stainless steel. The authors also examined the microstructures of welding joints using E308 and ECuSi electrodes. The joints were achieved with one welding pass without preheating or grooving. Nevertheless, while other arc welding techniques like MIG, TIG, and DSAW offer notable benefits for connecting Cu-SS, there are still economic issues and the need for highly skilled and costly welders. SMAW technology provides many benefits to understanding filler metal's impact on microstructures and junction mechanical characteristics.
However, the major problem in fusion welding between these dissimilar metals is the catastrophic effect of Cu on the Fe grain boundary. During welding, Cu will deposit on the Fe grain boundary and result in intergranular corrosion and microcracks. For that, all the fusion welding electrodes consist of ferrite promotion elements like Si and Zn form a ferrite barrier layer, solving this problem. The current study involves the selection of two fillers, namely Cu-base (ECuSi) and Fe-base (E308) electrodes, to weld dissimilar metals, namely copper and stainless steel. An investigation was conducted to compare and analyze the impact of various fillers on microstructures and mechanical characteristics of joints. A numerical model based on SOLIDWORKS and ANSYS was performed to investigate welding heat distribution on both sides and its impact on (heat-affected zone) HAZ width, weldment deformation, and residual stress on welding joints.
2.1 Materials and model preparation
Materials that are employed for welding process and welding model development based on 304 stainless steel and copper plates; each plate is 4 mm thickness, and all plates cold rolled. The base materials are disposed of in the butt joint position and welded on one side with a single pass. Two types of welding wires are available in the market, namely ECuSi and E308, both of 3.2 mm diameter, are selected for weld filler materials.
2.2 Instruments
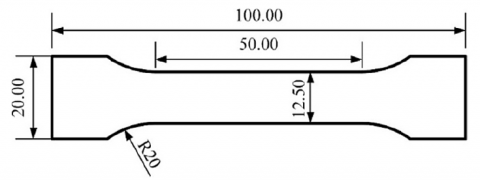
The surface morphology of the joints' microstructures was analyzed using a Zeiss Imager M2m optical microscope, while the more detailed morphology was elucidated by FEI Quanta 250 SEM. Weld zones chemical composition investigated with Energy Dispersive Spectroscopy (EDS) connected to the SEM help. Hardness measurement of the welding joint cross-section was done using the Vickers Hardness testing Machine HVD-1000AT Digital Micro Vickers under ASTM E384-11e1 standards. Tensile mechanical properties of the welded joints were determined using the Servo Hydraulic Universal Testing System Model with a load cell of rated capacity 600kN / 1000kN as per ASTM E8/E8m-15a standard. Tensile test sample dimensions are illustrated in Figure 1.
Figure 1. Specimen dimension for tensile test [20]
2.3 Measuring procedure
The surface morphology of the joints' microstructures was analyzed using a Zeiss Imager M2m optical microscope, while the more detailed morphology was elucidated by FEI Quanta 250 SEM. The chemical composition of the weld zones was investigated with the help of an Energy Dispersive Spectroscopy (EDS) connected to the SEM. The Hardness measurement of the welding joint cross-section was done using the Vickers Hardness testing Machine HVD-1000AT Digital Micro Vickers under ASTM E384-11e1 standards. Tensile mechanical properties welded joints were determined using the Servo Hydraulic Universal Testing System Model with a load cell of rated capacity 600kN / 1000kN as per ASTM E8/E8m-15a standard. Tensile test sample dimensions are illustrated in Figure 1.
3.1 Model generation and ANSYS simulation procedure
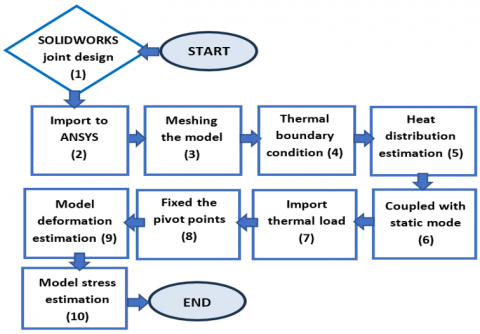
Shielded metal arc welding (SMAW) transient temperature patterns and residual stresses predicted using 3D thermo-mechanical finite element that was developed in SOLIDWORKS and imported into ANSYS. A two-stage finite element analysis conducted, and complete technique is outlined in flow chart shown in Figure 2. Initially, a transient thermal analysis was performed using moving heat source ACT ANSYS extension to forecast weld joint's thermal fields and heat distribution. The thermal analysis findings were used to pre-process input loads as body force (thermal loads) to conduct static analysis to forecast deformation stress distribution in welded joints. Assumptions made during thermal analysis and static assessments. Base materials initial temperature set at 28℃ for welding to conduct thermal and structural evaluations in modeling.
Figure 2. Numerical Simulation procedure
3.2 Meshing
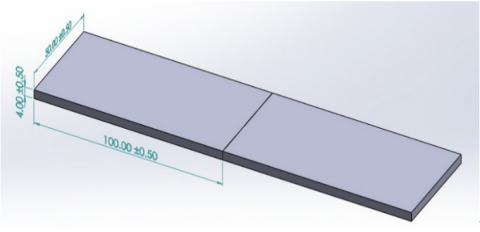
Engineering simulation meshing is essential component process. To ensure simulation accuracy, crucial systematically create high-fidelity mesh of utmost importance. Optimizing mesh essential in simulations since it affect simulation accuracy and efficiency. Computers didn’t simulate CAD physical shape due to their inability to apply governing equations to defined geometry. Mesh enables solving governing equations inside volumes prescribed theoretically described. Usually, meshes used to solve partial differential equations. Due to calculations repetitious nature, impractical to answer equations by hand. Hence, computer methods like finite element analysis used. Mesh technique used ANSYS configuration to create welding joint geometry approach elements effective distribution. Both metals in investigation start with 4 mm thickness, as illustrated in Figure 3(a). All joints had parts with 2 mm diameters, totaling 28710 nodes and 5000 components. Weldment models meshed utilizing multizone technique, as seen in Figure 3(b). The research used SOLIDWORKS dimensions to create and physically mimic welding butt joint.
(a)
(b)
Figure 3. Welding joint (A) SOLIDWORKS geometry, (B) ANSYS mesh
3.3 Numerical thermal model governed equations
Electric source voltage (U) is different between welding electrode and parent metal, leading to electric arc development through current flows in electric arc welding process. During the process, losses occur owing to variables like convection and radiation of the welding arc. Only a fraction of this energy is used for melting welding and base materials, requiring the inclusion of a variable known as power efficiency (ŋ). Hence, accurate weld heat input may denote by following equation [21]:
$Q=\mathrm{\eta} . U . I$ (1)
Thermal model used welding heat flow expression from Eq. (2) to evaluate the thermal gradient in the three-dimensional object by applying energy balance on the control volume in the research region. Heat flow on the piece is non-linear because of the strong temperature dependence of the thermophysical characteristics of materials [21].
$\begin{array}{r}\rho(T) c(T) \frac{\partial T}{\partial t}=Q+\frac{\partial}{\partial x}\left[K_x(T) \frac{\partial T}{\partial x}\right]+ \frac{\partial}{\partial y}\left[K_y(T) \frac{\partial T}{\partial y}\right]+\frac{\partial}{\partial z}\left[K_z(T) \frac{\partial T}{\partial z}\right]\end{array}$ (2)
Eq. (2) and heat input, Q, as defined in Eq. (1) to the thermal distribution. Kx, Ky, and Kzrepresent thermal conductivity coefficients in three directions, whereas T stands for temperature and t for time. Convection heat loss, qc, and radiation heat loss, qr, may be quantified using the following equations [22]:
$q_c=h_f\left(T-T_{\infty}\right)$ (3)
$q_r=\varepsilon \sigma\left(T-T_{\infty}^4\right)$ (4)
where, hf represents convective coefficient, T∞ stands for ambient temperature, σdenotes Stefan-Boltzmann constant, and ε signifies the emissivity of the body's surface. Phase transition that takes place throughout the process, referred to as latent heat, may represented as a enthalpy H function using equation [22]:
$H=\int \rho c~d T$ (5)
An essential aspect of simulating using the Finite Element Method (FEM) is accurately representing the heat source. Goldak introduced an analytical approach for models in this investigation, specifically for dispersed heat source related to arc welding. Computational methods enabled temperature field determination. 3D Gaussian distribution on double ellipsoid analyzed, as illustrated in Figure 4. This source is defined analytically using Eqs. (6) and (7) as referenced in source [23].
$q_{f(x, y, z)}=f_f \frac{\eta U I}{a_f b c \pi \sqrt{\pi}} 6 \sqrt{3} ~exp \left(\frac{-3 x^2}{a_f^2}\right) ~exp \left(\frac{-3 y^2}{b^2}\right) ~exp \left(\frac{-3 z^2}{c^2}\right)$ (6)
$q_{r(x, y, z)}=f_r \frac{\eta U I}{a_r b c \pi \sqrt{\pi}} 6 \sqrt{3} ~exp \left(\frac{-3 x^2}{a_r^2}\right) ~exp \left(\frac{-3 y^2}{b^2}\right) ~exp \left(\frac{-3 z^2}{c^2}\right)$ (7)
where, qf and qr represent volumetric energy distributions before and after welding in units of W.m3. Similarly, ff and fr represent energy distributions before and after welding electrodes. In contrast, af and ar represent lengths of the welding pool before and after welding electrodes in meters. b represents half of the weld pool width in meters, where C indicates the depth of the fused zone in meters, as seen in Figure 4. The parameters U, I, and η are associated with welding technique, while b and c are geometric properties of source that may be identified by metallographic investigation. Parameters af, ar, ff, and fr are derived from parameters b and c. Additionally, a total of ff and fr equals 2 [24]. When more accurate data is unavailable, the distance from heat source front is half weld width, while distance behind heat source is width twice, providing reliable estimate.
Figure 4. Gaussian distribution is a 3D volumetric of a double ellipsoid with radii a, b, and c [22]
3.4 Numerical thermal model governed equations
Predicting welding thermal, elastic, plastic, and residual stresses distribution always requires welding joint mathematical models and numerical analysis. Since phase transformation happens at low temperature, welding heat distribution models can be used to forecast change in microstructure and phase transformation in welding joint and (HAZ). Predicting ensuing mechanical properties can be aided by this. For designs with dissimilar joints, welding thermal analysis determines and stores temperature distribution; in mechanical analysis, data used thermal loading to generate thermal stress field. Because of this, strains, stresses, and thermal deformation may calculate all around joint. Based on strain hardening rule and von mises yield requirement, thermal elastoplastic material model can be written as [24]:
$\varepsilon_{ {total }}=\varepsilon_e+\varepsilon_p+\varepsilon_t$ (8)
And the stresses may be expressed in constitutive equation as follows:
$\sigma=D\left(\varepsilon_{ {total }}-\varepsilon_p-\varepsilon_t\right)$ (9)
where, D matrix, representing material stiffness, reproduced elastic-plastic behavior with linear kinematic hardening. Yield stress in most alloy steels decreases significantly with rising temperature and disappears entirely at the melting point. Three heat inputs were applied to the welding zone to create the thermal load for the joint. The left and right sides of the weldment were secured to mimic actual circumstances. ANSYS calculated the Von Mises stresses, strain, and deformation caused by the heat load.
4.1 Heat distribution and thermal analysis
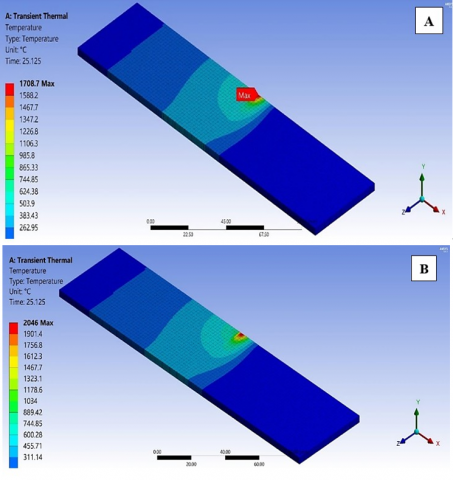
Copper and stainless steel welding joints are studied for their transient thermal behavior. Volumetric heat source is moving heat input during welding. Element-graduated heating method is used to imitate filler addition process that occurs during welding [25]. For different heat inputs according to welding electrode specifications, Figure 5 demonstrate weldments temperature distribution from weld center line. As heat source travels along its route during welding procedure, figures represent nodes' peak temperatures. It is evident from welding process that cooling is more gradual than heating.
Figure 5. Welding heat distribution (A) welding ECuSi, and (B) welding with E308
Figures 6 illustrate various heat inputs using different electrodes temperature distribution, fusion zone, and HAZ. Molten material present in welding joint and surrounding (HAZ), exhibiting red and orange coloration, with temperatures exceeding 1550℃. Figure 6 clearly delineates fusion zone (FZ) boundaries. Increased heat input leads to larger weld pool and expanded (HAZ), as illustrated in both graphs.
Figure 6. Maximum welding temp. And HAZ width (A) welding ECuSi, and (B) welding with E308
At 1700℃, stainless steel side calculated heat affected zone (HAZ) width was 1.9 mm, while for copper side it was 6.24 mm. Heat affected zone (HAZ) width measured at 7 mm on copper side and 6.7 mm on stainless steel side at 2000℃ welding temperature. Welding results with E308 wire demonstrated direct correlation between HAZ width and welding temperature for both base metals. Variation in HAZ between two dissimilar base metals is due to variation in thermal conductivity between them; for both models, copper side HAZ width is greater than stainless steel side. HAZ width in fusion welding processes depends on several factors like welding current, welding speed, and base metal thermal conductivity according to the following equation [26]:
$HAZ~width=(Q /(V \times \pi \times K \times \Delta T))^{0.5}$ (10)
where, Q welding heat input, V welding speed (mm/s), k is base metal thermal conductivity (W/m‧K), and ΔT is difference between melting point temperature and initial base metal temperature in (℃). According to Eq. (10), the HAZ width will be inversely proportional to the base metal thermal conductivity (K). The problem with the base metal's high thermal conductivity during the fusion welding process is that it needs more heat input to overcome the welding heat distraction and losses due to the high thermal conductivity, which behaves like a heat sink. For this reason, it is a scientific fact that the welding of aluminum needed more welding current from steel welding despite the melting point of the steel at 1550℃, which is almost double the aluminum melting point. The high welding current means more welding heat, and due to high copper thermal conductivity, heat will affect wider zone on copper side than stainless steel. Maximum welding joint heat is calculated and used in ANSYS models simulation according to following equation [26]:
$Max. welding~temp. =(Q \times 0.4)+T_o$ (11)
where, Q is welding input heat (J/mm), and To is initial base metal temperature. Welding input heat (Q) calculated according to following equation:
$Q=\frac{V I}{1000~S}$ (12)
where, V is arc voltage in (volt), I is welding current in (amp.), and S is welding speed in (mm/min).
Small differences in heat distribution patterns and HAZ width measurements existed between predicted results from ANSYS simulations and lab-based experimental data. The peak welding temperatures in ANSYS models reached higher levels because of simplified heat input parameters yet experimental measurements revealed slightly lower temperatures resulting from both heat loss and conduction characteristics. ANSYS produced marginally inaccurate results, which showed wider HAZ zones, especially near the copper surface, because of the conductivity assumptions made during the simulation. Experimental testing generated calmer heat distribution along with slower cooling times that produced thinner HAZ. Table 1 below illustrates the comparison between these two variables for both cases.
Table 1. Heat distribution and HAZ width experimental and ANSYS results comparison for ECuSi and E308 Electrodes
|
Electrode Type |
|||
|
ECuSi |
E308 |
||
|
Heat Disterbutiom |
|||
|
ANSYS Prediction |
Experimental Measurments |
ANSYS Prediction |
Experimental Measurments |
|
Non-uniform, max welding temp. 1700℃ |
Max welding temp. 1650℃ |
Non-uniform, max welding temp. 2000℃ |
Max welding temp. 1950℃ |
|
HAZ Width |
|||
|
ANSYS Prediction |
Experimental Measurments |
ANSYS Prediction |
Experimental Measurments |
|
SS Side: 1.9 mm, Cu Side: 6.24 mm |
SS Side: 1.85 mm, Cu Side: 6.1 mm |
SS Side: 6. 7 mm, Cu Side: 7 mm |
SS Side: 6.6 mm, Cu Side: 6.85 mm |
4.2 Deformation analysis
Mechanical and thermal qualities of base metal are crucial, particularly when estimating welding distortion. Critical base metal parameters that impact weld distortion are yield strength, Young's Modulus, thermal expansion coefficient, thermal conductivity, and specific heat. Young's Modulus is inversely proportional to base material stiffness and decreases with increasing temperature. If yield strength is excessively high, thermal stresses cannot cause permanent deformations at elevated temperatures. Only elastic strains occur in this case, and no plastic strains are generated. The angular distortion of a material is influenced by its high-temperature yield strength. High-temperature yield strength was shown to be positively correlated with an increase in angular distortion. Stainless steels exhibit a greater yield strength than copper when exposed to elevated temperatures.
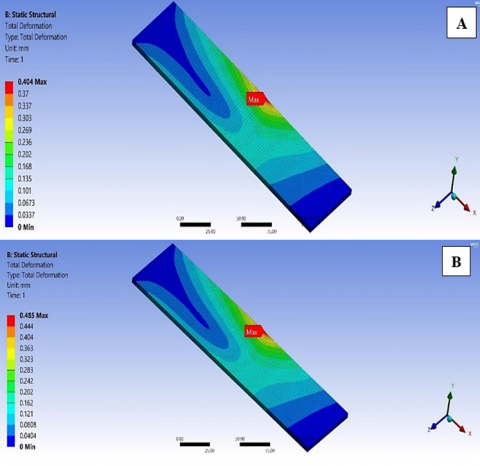
Numerical models of dissimilar joint deformation for both welding electrodes illustrated that the deformation on the stainless steel side is more than the copper side for both electrodes, as shown in Figure 7. The diagrams in Figure 8 show the variation in deformation between the two welding joint sides. as shown in Figure 7. The diagrams in Figure 8 show the variation in deformation between the two welding joint sides. The variation in maximum deformation between the two welding electrode joints is about 21% due to the variation in maximum welding temperature between the welding joints of ECuSi and E308 electrodes.
Figure 7. Deformation distribution and max. Deformation location and value (A) welding with ECuSi and (B) welding with E308
Figure 8. Deformation distribution and max. Deformation location digamma crosses the welding joint center line (A) welding with ECuSi and (B) welding with E308
Figure 9 illustrates the impacts of thermal expansion and yield stress on both base metals' deformation values, type, and location. The maximum deformation recorded in stainless steel HAZ is due to the high thermal expansion of stainless steel compared with copper. Also, the digammas for both experimental models demonstrated a homogenous deformation in the stainless steel side with a wave shape deformation on the cooper side, which can be noticed by the negative values of the deformation estimated by the ANSYS models.
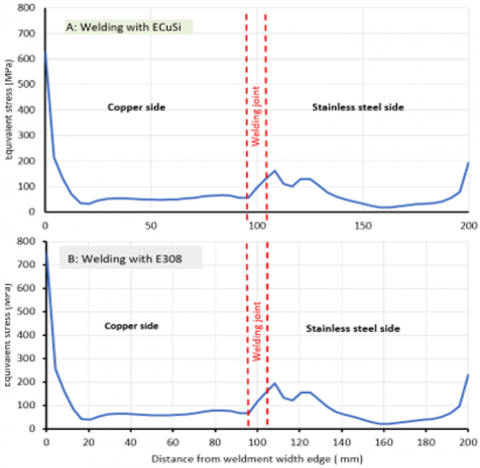
Figure 9. Equivalent stress distribution and max. The stress location crosses the welding joint center line (A) welding with ECuSi and (B) welding with E308
Thermal conductivity quantifies the rate at which heat is transferred through a material. The thermal conductivity of a substance exhibits a modest increase as its temperature rises. A more excellent thermal conductivity leads to consistent heat distribution over the experimental plate's thickness and width. As a result, the temperature gradient that causes shrinkage stresses decreased, reducing weld distortion. Decreased thermal conductivity produces a more pronounced temperature gradient, amplifying distortion. Thus, weld distortions are extremely sensitive to thermal conductivity. Specific heat of a substance is defined as the temperature required amount to raise a given mass of that substance by one degree. Heat capacity measures the relationship between the amount of heat transported to or from a substance and the resulting change in its temperature. Greater values of specific heat decrease the maximum temperature attained during welding. Shrinkage forces magnitude is directly proportional to maximum temperature reached in welding plates. Strong correlation between experimental measurements and ANSYS simulations exists though discrepancies occur because of welding-induced material behavior complexities. Experimental measurements of deformation generated slightly less elongation because of the presence of actual world conditions, which include material variant homogeneity and localized cooling conditions. Table 2 shows the comparison between the deformation ANSYS and experimental results.
Table 2. Deformation results comparison achieved from experimental and ANSYS simulation for ECuSi and E308 electrodes
|
Electrode Type |
|||
|
ECuSi |
E308 |
||
|
Deformation |
|||
|
ANSYS Prediction |
Experimental Measurments |
ANSYS Prediction |
Experimental Measurments |
|
Max deformation: 0.40 mm on SS side |
Max deformation: 0.38 mm on SS side |
Max deformation: 0.48 mm on SS side ℃ |
Max deformation: 0.46 mm on SS side |
4.3 Equivalent stress distribution analysis
A welding simulation was performed using finite element analysis to forecast residual stress in two copper and stainless steel dissimilar plates butt welding. Maximum welding temperature varied depending on used welding electrodes type.
Mechanical analysis based on big displacement theory is applied to examine residual stresses and distortions utilizes thermal histories [27]. The residual stresses are determined in both models' x-axis (transverse) directions. The boundary conditions substantially influence residual stresses, especially in the transverse direction. Consequently, the fluctuation of residual stress in the 'x' direction is predicted. The residual stresses at the top surface of the plate are measured at a distance of 25 mm from the width edge, in the z direction that crosses the weld center line to the opposite edge. This is shown in Figure 10. The plate is tested under unconstrained and fully constrained conditions at the two weldment edges. The stress at the top surface reaches a significantly high peak value along the tested course, particularly at the fixed edges.
The dissimilarity in heat conductivity and yield stress between the two base metals results in a non-uniform residual stress distribution on both sides. If the yield stress on the copper side is low, the stress pattern will differ from that on the stainless steel side, with high yield stress when the heat source is applied to the top surface of the plate. The longitudinal residual stress distribution is more significant in the entirely confined copper edge than in the stainless steel constrained edge. Near the weld line, there are higher levels of tensile strains of greater magnitude, whereas further away from the weld line, there are lower levels of compressive stresses of lesser magnitude. This is attributed to the elevated temperature at the weld line, which gradually lowers as one moves towards the edge of the plate. It has been observed that the stress level is more significant in the entirely confined edge compared to the region with no constraints.
The unrestricted movement of the plate is due to the absence of constraints in the weld line and HAZ. The plates are prohibited from displacing vertically in fully constrained areas at the margins, as shown in Figure 9. Maximum equivalent stress calculated by ANSYS along the x-axis of weldment crosses the welding joint center with ECuSi, and 1700 ℃ top welding expected temperature is 625.53 Mpa. In contrast, the ANSYS calculated 750.63 Mpa equivalent stress for the exact location when the leading welding joint temperature is 2000℃ for the welding joint done by the E308 electrode; both models illustrated the precise location of the maximum stress location at the fixed edge of the copper side.
4.4 Welding joint microstructure analysis
The morphologies of weld zones, fusion boundaries, and heat-affected zones (HAZ) specifically for E308 welding electrodes are displayed in Figure 10. Macro-segregations were observed in the welding joint using E308 between the copper base metal and the welding zone. These segregations were most likely a result of incomplete mixing, leading to base metal melting without proper blending. The welding interface between the copper base metal and the welding zone exhibits surface cracks due to copper infiltrating the boundaries of the stainless steel grains, creating intergranular cracks. Moreover, the copper's high thermal conductivity had a significant role in the swift escalation of the cooling rate in this area, creating cracks. Figures 11(A) depict copper fusion boundary and cracks. Fusion boundary between stainless-steel side and E308 weld exhibited uniform microstructure with consistent line, and no fractures detected in this region.
Figure 10. The equivalent stress distribution diagram crosses the welding joint center line (A) welding with ECuSi and (B) welding with E308
Weld zone microstructure with tightly packed dendrites observed at welding joint upper side, whereas structure at bottom consisted of copper-base matrix with scattered Fe-base spheres, as depicted in Figure 11(B). joint upper side consisted of coarse dendritic structure, whereas bottom had mixed copper and iron structure. The joints with homogenous components exhibit a distinct contrast in microstructures between the upper and bottom joints, particularly in cases with clear segregation in the weld zone, as seen in (A). This distinction is seen in Figures 11(C), and (D).
Figure 11. E308 electrode joint (A) copper fusion line (B) stainless steel fusion line (C) upper side of the welding zone (D) bottom side of the welding zone
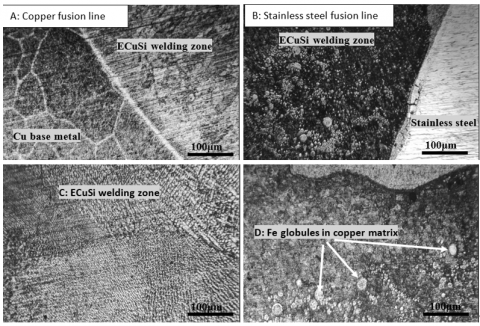
Figure 12 illustrates weld zone shape, heat-affected zone (HAZ), and fusion line in ECuSi. Fusion line zone exhibits uniform microstructure on both sides, fractures devoid. This is attributed to silicon in the welding electrode, which acts as a barrier, preventing copper from stainless steel infiltrating grain boundary and intergranular cracks inhibiting creation [28]. Copper base metal has significant equiaxed copper grains characterized by annealing twins’ presence. Cu-HAZ exhibits notable increase in grain size, accompanied by fully developed annealing twins, compared to Cu-base metal. This is illustrated in Figs. 12(A) and (B). The grain growths observed in the copper resulted from high input heat and low welding speed used during the SMAW process despite high thermal conductivity. Therefore, welding heat transfer through convection from the welding fusion zone to Cu base metal via the Cu side interface cause grain size increase of the Cu HAZ.
The optical micrographs clearly show the weld interfaces of both Cu and SS, as depicted in Figures 12(A) and (B). The copper interface exhibits an undulating structure instead of a well-defined interface, and it is entirely devoid of minuscule imperfections such as porosity and hot cracking. Even though copper cannot dissolve in iron, including Si in welding filler can increase copper solubility. As a result, weld flaws at the interface were prevented entirely. Various microstructural characteristics across the fusion zone confirm the thorough infiltration of the ECuSi electrode material. Furthermore, no significant welding flaws were detected. The uninterrupted interfaces between grains, extending from the fusion line towards stainless steel, exhibit the epitaxial grain development phenomenon. This growth extends up to a few hundred millimeters toward the fusion zone, as Figure 12(C) depicts. As reported in previous studies, the creation of epitaxial grain growth is attributed to the similarity in chemical composition and crystal structure (FCC) between Cu and electrode. The adjacent area to stainless steel HAZ contains ferrites (BCC) embedded in austenite matrix (FCC), resulting from allotropic phase changes of stainless steel. The area encompassing the δ-ferrite and austenite phases is the unmixed zone (UMZ), indicating that welding filler material did not fully dissolve with the base metal.
Figure 12(D) illustrates Fe globule's presence in the copper matrix, which is depicted as bright and dark. The presence of densely distributed Fe globules on dendrites microstructure copper matrix in the welding fusion zone, as revealed in optical micrographs. Solidification behavior in fusion lines exhibits characteristic proliferation of cellular grains. However, due to the fusion zone's rapid solidification rate and extremely low-temperature gradient, solidification behavior has transitioned to a combination of columnar and equiaxed dendrite.
Figure 12. ECuSi electrode joint (A) copper fusion line (B) stainless steel fusion line (C) welding zone (D) Fe globules in the copper matrix
Due to its high thermal conductivity, copper efficiently transfers heat from the fusion zone. As a result, the Fe has experienced extensive melting compared to Cu, leading to significant supercooling and the formation of iron globules on the copper matrix through heterogeneous nucleation. The ECuSi electrode caused more excellent supercooling effects in the fusion zone than the weld interface. As a result, certain elongated columnar grains transformed equiaxed dendrites with primary and secondary dendritic arms. Dimensions and arrangement of these dendrites are entirely regulated by solidification parameters, including solidification modes, temperature gradients, and solidification rate. Moreover, all dendrites are oriented perpendicular to the fusion line. Therefore, the fusion zone exhibits a complicated dendritic solidification structure due to the combined influences of constitutional supercooling, composition gradients, and solidification gradients.
4.5 Analysis of Vickers microhardness results
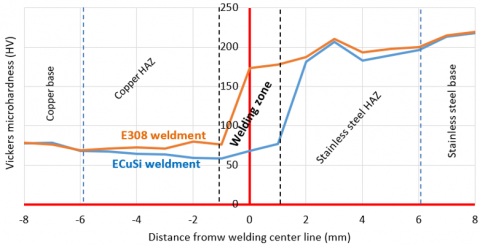
The microhardness distribution was analyzed by measuring the hardness at 1 mm intervals along a straight line from the copper base metal to the stainless steel base metal. Measurements taken at base metal, heat-affected zone (HAZ), fusion line, and weld metal on both sides. each indentation hardness was measured independently, and microhardness curves produced using measured hardness values over all weld zones, as depicted in Figure 13. The hardness distributions in the basic materials are more uniform, with a maximum hardness of 219.4 HV for stainless steel and 79.8 HV for copper. As confirmed in optical micrographs, δ-Ferrite presence in austenite matrix responsible for significant standard deviation observed in stainless steel base metal. The hardness obtained from the indents on the delta ferrite phase was 187.6 HV at the center of the weld joint. The highest hardness (200.1 HV) was observed in the delta ferrite region at the stainless steel fusion line, which is attributed to the higher hardness of the ferrite phase compared to austenite (γ-Fe). This is primarily due to elevated chromium content in the ferrite phase, stabilizing ferrite. This identical pattern was previously noted by previous studies [29]. Both the stainless steel and copper heat-affected zones (HAZs) exhibit a decrease in hardness values due to the impact of heat. The fusion zone exhibits a significant variation in hardness between the two electrodes used in the experiment. The fusion zone hardness of the E308 electrode is higher than that of stainless steel base steel due to the ferrite presence from the welding electrode and temperature gradients throughout the solidification process. However, the hardness of the fusion zone continues to be lower than that of the metallic stainless steel base. The shift in hardness from the fusion area to the copper welding interface and heat-affected region (HAZ) is gradual. This is due to large copper grains and the high heat input from the E308 electrode. The depletion of hardness is observed along the copper weld interface. ECuSi electrode fusion zone hardness is poorer than E308 welding zone because of columnar dendrite (Fe) present in copper matrix (Cu). Fusion line showed high hardness due to the cracks absence. HAZ also exhibited reduced hardness on each side, indicating confined coarse grain structure due to low heat entering ECuSi electrode. These findings consistent with metallurgical conclusions from optical exam and ANSYS heat distribution models.
Figure 13. Microhardness measured values of E308 and ECuSi joints (A) E308 welding joint (B) ECuSi welding joint
4.6. Tensile test sample results
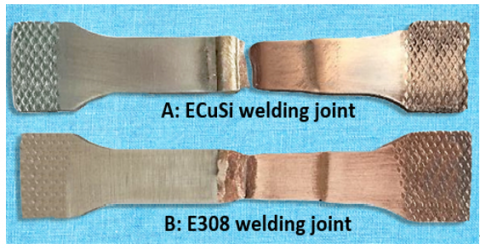
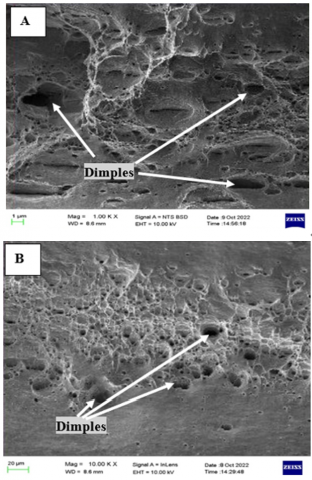
The tensile test samples illustrated that all joints fractured on the softened copper heat-affected zones (HAZs), as visible in Figure 14. The tensile test of the ECuSi and E308 joints recorded 219 MPa and 198 MPa, respectively. Welding joints tensile strength losses turned down, in particular, due to heat-affected zone (HAZ) effective weakening at some stage in welding procedure. This weakening prompted by grain size enlargement and dislocation density discount because of annealing during welding cool. Welding joint samples fracture surfaces show that all welding joints cracked ductile, showing fibrous fracture with small depressions, as depicted in Figure 15. The phenomenon is attributed to grain coarsening and reduced dislocation density due to annealing. Joints samples fracture surfaces indicate that all joints had been cracked ductile, displaying a fibrous fractured surface with small depressions.
Figure 14. E308 and ECuSi tensile test sample (A) ECuSi welding joint (B) E308 welding joint
Figure 15. E308 and ECuSi tensile test sample fracture SEM (A) ECuSi welding joint (B) E308 welding joint
Samples exhibit non-uniform elastic deformation, particularly in ECuSi sample, primarily caused by inhomogeneity of samples. Plastic deformation of joints mainly localized in copper heat-affected zone (HAZ) since these areas had weakening effect caused by softening during welding process, which aligns with discovery made by previous research [30]. Consequently, elongated softened areas can readily identified in fractured samples. It is not reasonable to evaluate joints with base metals plastic properties using elongation because welded joint contains numerous components, such as base metal (304 stainless steel), weld zone, and copper base metal. Compared to E308 joint, ECuSi joint has far better strain value. Authers examined 304 stainless steel, weld zone, and copper lengths within gage length after stretching in order to study increased plastic deformation source in ECuSi joint. There was very little plastic deformation in this area since 304 base metals has high tensile strength. 90% maximum strain observed ECuSi joint's weld zone, suggesting that coarse copper phase produced there had low tensile strength. Joint extremely varied characteristics may explained by this structure.
On the other hand, the areas where E308 junction was welded showed minimal plastic deformation, especially in joints made with the Fe-based electrode. This can be mainly attributable to Fe-based solid solutions with strong resistance to stretching forces. Strain experienced by copper base metals in ECuSi and E308 joint was 33.2% and 26.3%, respectively, relative to their initial length within gage length. This indicates that plastic deformation was concentrated on the softened copper side. Research, like the study conducted by Xue et al. [31], suggested that as the amount of heat applied increased, the softness of materials worsened, resulting in improved material strain. Interestingly, ECuSi joint with the most significant plastic deformation was not fused with maximum welding heat input. This can be attributed to its high thermal conductivity, which allows most welding heat to pass through it. Samples exhibit non-uniform elastic deformation, particularly in ECuSi joint, primarily caused by samples inhomogeneity.
A former study conducted by Syukri [32] investigated butt-joint welding. The thermal simulations also yielded good results for the heat distribution for similar welding processes. It also showed that the predictions of the HAZ width are in concordance with current work results. Butt welding temperature distribution analysis has been carried out by Venkateswarlu et al. [33] using ANSYS software. They set up identical thermal gradients and stress distribution and all were validated in experiments. This is in line with the results of the current study, where thermal prediction and HAZ dimensions were provided for both materials.
The obtained values of the observed parameters also fall within the range of the normal fluctuation, as other works pointed out with the use of ANSYS simulation. Rao et al. [34] established that the residual stress of butt-welded joints was nobly simulated in this study, especially in stainless steel, which had similar residual stress distribution with the analytical and experimental results. Chen et al. [35] also confirmed that ANSYS could predict the temperature gradients and fabrication of HAZ, thus supporting your result shown on the copper and stainless steel portions. Similar to Martins et al. [36], a similar analysis of stress distribution and its impact on butt joints mechanical properties with different filler materials help shown stress concentration on the side of steel. The comparison results between this study simulation results and the previous research papers are shown in Table 3.
Table 3. Validation results comparison
|
Parameter |
HAZ Width (st.st side) |
HAZ Width (Cu Side) |
Residual Stress Distribution |
|
Research (ECuSi) |
1.9 mm |
6.24 mm |
Higher on SS |
|
Research (E308) |
6.7 mm |
7 mm |
Higher on SS |
|
Syukri [32] |
Similar |
Similar |
Similar |
|
Venkateswarlu et al. [33] |
Similar |
Similar |
Higher on SS |
|
Rao et al. [34] |
Similar |
Similar |
Higher on SS |
|
Chen and Hashemzadeh [35] |
Similar |
Similar |
Similar |
|
Martins and Cardoso [36] |
Similar |
Similar |
Higher on SS |
This study demonstrates the challenges and effective solutions that address dissimilar welding through investigations into heat distribution processes as well as filler materials and welding methods for creating strong and reliable joints. The finding can summarize as follow:
·Thermal dispersion The ANSYS simulation revealed a non-uniform heat distribution pattern along the welding center line between the copper and stainless steel, which may be attributed to the differing thermal conductivity of these metals. The fluctuation in welding heat input necessary to liquefy the used electrode between the ECuSi and E308 electrodes impacted the modification of ANSYS model results for both the joint fusion border and heat-affected zone (HAZ) dimension.
·Shielded metal arc welding demonstrates excellent versatility when using copper-based and iron-based electrodes. The joint made of copper has a consistent structure in the welding area, with large copper grains in HAZ. ECuSi weld metal exhibits a diverse combination of equiaxed dendrites and columnar. In addition, the fusion zone's center displays a hybrid microstructure consisting of a substantial quantity of small steel globules that are randomly dispersed throughout copper matrix. Epitaxial grain development of delta ferrite (BCC) is observed at stainless steel interface. Simultaneously, weld segregations occur in the joints of Fe-based electrodes due to a combination of immiscible Fe and Cu phases.
·The annealing process causes (HAZ) on copper side to become softer, increasing grain size and decreasing dislocation density. Fractures arise at (HAZ) and weakened in tensile tests for all joints. Welding joint filled with Cu-based material has highest tensile strength, reaching 80% copper base metal strength. Cu-based joint exhibits more significant plastic deformation compared to Fe-based joints.
·The fusion zone exhibits microhardness gradients due to copper and stainless steel grains uneven distribution. Despite more fine stainless globules significant number in fusion zone, average microhardness produced by fusion zone significantly lower than that of stainless steel base metal.
|
HAZ |
Heat affected zone |
|
FZ |
Fusion zone |
|
T |
Temperature (℃) |
|
k |
Thermal conductivity (W/m∙K) |
|
qc |
Heat flow density for convection (W/m2) |
|
T0 |
Initial temperature (℃) |
|
hc |
Convective heat transfer coefficient (W/m2∙K) |
|
U |
Welding voltage (V) |
|
I |
Welding current (A) |
|
V |
Welding speed (millimeter per second) (mm/s) |
|
Greek symbols |
|
|
ξ |
Stefan Boltzmann constant (W/m2∙K4) |
|
έ |
Convection and emissivity coefficients (W/m2∙K) |
|
εe |
Elastic strain |
|
εp |
Plastic strain |
|
εt |
Thermal strain |
[1] Nishi, H., Araki, T. (2000). Low cycle fatigue strength of diffusion bonded joints of alumina dispersion-strengthened copper to stainless steel. Journal of Nuclear Materials, 283: 1234-1237. https://doi.org/10.1016/S0022-3115(00)00176-8
[2] Huser, G., Martinez Celis, M., Picot, F., Minárik, P., Veselý, J., Helbert, A.L., Hug, E. (2024). Effect of tool geometry on the microstructure of friction stir welding of copper and 316L stainless steel. Advanced Engineering Materials, 26(7): 2301812. https://doi.org/10.1002/adem.202301812
[3] Mohamed, M.S., Abtan, A.A., Moosa, A.U. (2023). Microstructure and mechanical properties assessments of 304 austenitic stainless steel and Monel 400 dissimilar GTAW weldment. Revue des Composites et des Matériaux Avancés-Journal of Composite and Advanced Materials, 33(3): 135-144. https://doi.org/10.18280/rcma.330301
[4] Dauod, S., Mohammed, M.S., Aziz, I.A.A., Abbas, A.S. (2024). Mechanical vibration influence in microstructural alterations and mechanical properties of 304 stainless steel weld joints. Journal of Engineering Science and Technology, 18(6): 33-54.
[5] Chen, S., Zhang, M., Huang, J., Cui, C., Zhang, H., Zhao, X. (2014). Microstructures and mechanical property of laser butt welding of titanium alloy to stainless steel. Materials Design, 53: 504-511. https://doi.org/10.1016/j.matdes.2013.07.044
[6] Mai, T.A., Spowage, A.C. (2004). Characterisation of dissimilar joints in laser welding of steelkovar, copper-steel and copper-aluminium. Materials Science and Engineering A, 374: 224-233. https://doi.org/10.1016/j.msea.2004.02.025
[7] Chen, S., Huang, J., Xia, J., Zhang, H., Zhao, X. (2014). Microstructural characteristics of a stainless steel/copper dissimilar joint made by laser welding. Metallurgical and Materials Transactions A, 44: 3690-3696. https://doi.org/10.1007/s11661-013-1693-z
[8] Magnabosco, I., Ferro, P., Bonollo, F., Arnberg, L. (2006). An investigation of fusion zone microstructures in electron beam welding of copper-stainless steel. Materials Science and Engineering A, 424: 163-173. https://doi.org/10.1016/j.msea.2006.03.096
[9] Mannucci, A., Tomashchuk, I., Vignal, V., Sallamand, P., Duband, M. (2018). Parametric study of laser welding of copper to austenitic stainless steel. Procedia Cirp, 74: 450-455. https://doi.org/10.1016/j.procir.2018.08.160
[10] Chen, S., Huang, J., Xia, J., Zhao, X., Lin, S. (2015). Influence of processing parameters on the characteristics of stainless steel/copper laser welding. Journal of Materials Processing Technology, 222: 43-51. https://doi.org/10.1016/j.jmatprotec.2015.03.003
[11] Zhang, B. G., Zhao, J., Li, X.P., Feng, J.C. (2014). Electron beam welding of 304 stainless steel to QCr0.8 copper alloy with copper filler wire. Transactions of Nonferrous Metals Society of China, 24: 4059-4066. https://doi.org/10.1016/S1003-6326(14)63569-X
[12] Kar, J., Kumar, S., Gopal, G., Kumar, S. (2018). X-ray tomography study on porosity in electron beam welded dissimilar copper and 304SS joints. Vacuum, 149: 200-206. https://doi.org/10.1016/j.vacuum.2017.12.038
[13] Shiri, S.G., Nazarzadeh, M., Sharifitabar, M., Afarani, M.S. (2012). Gas tungsten arc welding of CP-copper to 304 stainless steel using different filler materials. Transactions of Nonferrous Metals Society of China, 22: 2937-2942. https://doi.org/10.1016/S1003-6326(11)61553-7
[14] Roy, C., Pavanan, V. V., Vishnu, G., Hari, P.R., Arivarasu, M., Manikandan, M., Ramkumar, D., Arivazhagan, N. (2014). Characterisation of metallurgical and mechanical properties of commercially pure copper and AISI 304 dissimilar weldments. Procedia Materials Science, 5: 2503-2512. https://doi.org/10.1016/j.mspro.2014.07.502
[15] Velu, M., Bhat, S. (2013). Metallurgical and mechanical examinations of steel-copper joints arc welded using bronze and nickel-base superalloy filler materials. Materials Design, 47: 793-809. https://doi.org/10.1016/j.matdes.2012.12.073
[16] Switzner, N., Queiroz, H., Duerst, J., Yu, Z. (2018). Si-bronze to 304 stainless steel GTA weld fusion zone microstructure and mechanical properties. Materials Science and Engineering A, 709: 55-64. https://doi.org/10.1016/j.msea.2017.09.025
[17] Cheng, Z., Huang, J., Ye, Z., Liu, H., Yang, J., Chen, S., Zhao, X. (2019). Interfacial microstructure evolution and mechanical properties of TC4 alloy/ 304 stainless steel joints with different joining modes. Journal of Manufacturing Processes, 37: 392-401. https://doi.org/10.1016/j.jmapro.2018.12.015
[18] Ye, Z., Huang, J., Cheng, Z., Gao, W., Zhang, Y., Chen, S., Yang, J. (2018). Combined effects of MIG and TIG arcs on weld appearance and interface properties in Al/steel double-sided butt welding-brazing. Journal of Materials Processing Technology, 250: 25-34. https://doi.org/10.1016/j.jmatprotec.2017.07.003
[19] Zhang, Y., Huang, J., Ye, Z., Cheng, Z., Yang, J., Chen, S. (2019). Influence of welding parameters on the IMCs and the mechanical properties of Ti/Al butt joints welded by MIG/TIG double-sided arc welding-brazing. Journal of Alloys and Compounds, 747: 366-373. https://doi.org/10.1016/j.jallcom.2018.03.119
[20] ASTM. (2013). Standard test methods for tension testing of metallic materials (ASTM E8/E8M). https://doi.org/10.1520/E0008_E0008M-13A.
[21] Nobrega, J., Silva, D., Araujo, B., Melo, R., Maciel, T., Silva, A., Santos, N. (2014). Numerical evaluation of multipass welding temperature field in API 5L X80 steel welded joints. The International Journal of Multiphysics, 8(3): 337-348. https://doi.org/10.1260/1750-9548.8.3.337
[22] Mittelman, G. (2018). Fundamentals of Heat and Mass Transfer, 8th Edition (2017) - Book review. https://www.researchgate.net/publication/329443308_Fundamentals_of_Heat_and_Mass_Transfer_8th_Edition_2017_-_Book_review.
[23] Queresh, E.M. (2008). Analysis of residual stresses and distortions in circumferentially welded thin-walled cylinders. Doctoral dissertation, National University of Sciences and Technology, Rawalpindi, Pakistan.
[24] Allen, D.H., Allen, D.T. (2014). Introduction to the Mechanics of Deformable Solids Bars and Beams. Springer. https://doi.org/10.1007/978-1-4614-4003-1
[25] Magalhaes, E., Silva, A., Lima e Silva, S.M. (2018). A thermal efficiency analysis of a gas tungsten arch welding process using a temperature moving sensor. International Journal of Thermal Sciences, 129: 23-32. https://doi.org/10.1016/j.ijthermalsci.2018.02.023
[26] Joshi, G.R., Badheka, V.J., Darji, R.S., Oza, A.D., Pathak, V.J., Burduhos-Nergis, D.D., Burduhos-Nergis, D.P., Narwade, G., Thirunavukarasu, G. (2022). The joining of copper to stainless steel by solid-state welding processes: A review. Materials, 15(20): 7234. https://doi.org/10.3390/ma15207234
[27] Venkatkumar, D., Durairaj, R. (2016). 3D finite element simulation of temperature distribution, residual stress and distortion on 304 stainless steel plates using GTA welding. Journal of Mechanical Science and Technology, 30: 67-76. https://doi.org/10.1007/s12206-015-1208-5
[28] Abtan, A.A., Mohammed, S.M., Alshalal, I. (2024). Microstructure, mechanical properties, and heat distribution ANSYS model of CP copper and 316 stainless steel torch brazing. Advances in Science and Technology Research Journal, 18(1): 167-183. https://doi.org/10.12913/22998624/177299
[29] Lippold, J.C. (2014). Welding Metallurgy and Weldability. John Wiley & Sons.
[30] Mortazavi, E., Najafabadi, R.A., Meysami, A. (2017). Effect of heat input on microstructure and mechanical properties of dissimilar joints of AISI 316L steel and API X70 high strength low-alloy steel. Journal of Iron and Steel Research International, 24(12): 1248-1253. https://doi.org/10.1016/S1006-706X(18)30024-4
[31] Xue, P., Xiao, B.L., Zhang, Q., Ma, Z.Y. (2012). Achieving friction stir welded pure copper joints with nearly equal strength to the parent metal via additional rapid cooling. Scripta Materialia, 64: 1051-1054. https://doi.org/10.1016/j.scriptamat.2011.02.019
[32] Syukri, M. (2015). Thermal simulation of different welding speed and metal thickness for butt-joint welding with ANSYS.
[33] Venkateswarlu, K., Kumar, P.N., Ravikumar, P.S. (2018). Finite element simulation of temperature distribution, distortion, and residual stresses of dissimilar welded joints. Materials Today Communications, 16: 140-148. https://doi.org/10.1016/j.mtcomm.2018.01.015
[34] Rao, D.J., Eswara, V., Rao, Y.S. (2021). Finite element simulation of residual stresses in welded steel butt joints and their experimental verification and mitigation. IOP Conference Series: Materials Science and Engineering, 1168: 012020. https://doi.org/10.1088/1757-899X/1168/1/012020
[35] Chen, B.Q., Hashemzadeh, M. (2014). Numerical and experimental studies on temperature and distortion patterns in butt-welded plates. The International Journal of Advanced Manufacturing Technology, 74(9-12): 1611-1625. https://doi.org/10.1007/s00170-014-5740-8
[36] Martins, R.F., Cardoso, J.B. (2017). Numerical simulation of residual stresses induced by TIG butt-welding of thin plates made of AISI 316L stainless steel. Procedia Structural Integrity, 7: 179-186. https://doi.org/10.1016/j.prostr.2017.11.023