Dileep Kumar Kadali*![]() | R.N.V. Jagan Mohan
| R.N.V. Jagan Mohan![]() | M. Chandra Naik
| M. Chandra Naik![]() | Yugandhar Bokka
| Yugandhar Bokka![]()
© 2024 The authors. This article is published by IIETA and is licensed under the CC BY 4.0 license (http://creativecommons.org/licenses/by/4.0/).
OPEN ACCESS
Nowadays, digital evidence plays a vital role in criminal investigations and arraignments. Digital criminal Investigators can also use this as an opportunity if the vast amount of data is a current trial. Assess constructive and constructive data and advice from the defendant proof behind the crime in terms of issues. Identifying criminal or criminal activity is a big deal because it connects certain data sets. It set an innovative law framework to quickly and accurately solve problems within the law's boundary. In this regard, the machine learning approach Naive Bayes classification for digital criminology data sets is to identify criminals. The Naive Bayes classification process is used for digital criminology data application. To approximate square estimate for data sets of digital criminology subgroups. Also, support the Hadoop Big Data System Understanding Map with Reduce programming with the Naive Bayes classifier. The experiment result was a huge accumulated failure in the data quality. Based on these data, the estimation parameter of the statistical model is reached. The least-square estimate estimates the parameters that deal with the statistical model in the experimental result.
digital criminology, big data, least square estimation, MapReduce, Naive Bayes
Nobody stresses that the contemporary domain is going through the Large Information age. Each individual gets hitched in different exercises on the Web utilizing web exchanges, web-based shopping, or other exercises. Because of this multitude of realities, they are incidentally creating immense measures of information consistently, with their optimistic effect on the Web [1]. Alongside the information produced by many administrations, such as Internet shopping destinations, a huge amount of information is also developing [2]. The vulnerability of people in general on the Web has, thus, extraordinarily expanded the pace of cybercrime [3]. Then, at that point, because of this reality, the calling of advanced criminological investigators is becoming increasingly difficult without convincing motivation to pool possible proof from the lake of Large Information [4]. Notwithstanding, Enormous Information presents difficulties, yet advanced criminological examiners can involve it as an open door [5, 6]. Inspect developmental and unstructured information and the trouble of recognizing proof from the respondent's lake behind the wrongdoing [7]. Once more, Large Information additionally gives expectations, for example, interconnecting various informational collections to distinguish some lawbreaker or crime [8].
In this paper talk about Large Information for Computerized Criminal Specialists. Huge information is so colossal in volume that it can't be estimated regarding gigabytes or terabytes; all things being equal, it is pretty much as extensive as petabytes or zettabytes. Furthermore, the volume is as yet expanding at a quick rate with each second [9]. Enormous information is a blend of organized and unstructured information [10]. Five Versus group enormous information: variety, speed, volume, exactness, and worth. Computerized Criminal science is a part of Applied Science, which manages the recognition, assortment, association, security, and show of proof information that is permitted in an official courtroom [11, 12]. All the more, as of late, Computerized Criminological manages the assortment of proof from the Web [13, 14]. Computerized Criminological Security and Criminological Analysts can help investigate proof assembled from the Web [15]. This sort of criminological investigation additionally manages cloud/haze and other dispersed conditions [16, 17].
Criminal activities often leave digital traces through communication devices, online transactions, or various forms of electronic documentation [18]. Investigators rely on digital evidence to uncover patterns of behaviour, identify suspects, and build cases [19]. The analysis of vast datasets is crucial for detecting cybercrime, fraud, organized crime, and other illegal activities that span large geographical areas and involve complex networks of individuals [20]. Big Data is crucial in modern digital criminology, offering valuable insights into criminal behaviour and activities [21]. However, data volume, variety, and velocity create significant challenges for forensic investigators. Solutions such as the Naive Bayes classifier, integrated with Big Data frameworks like Hadoop MapReduce, are emerging as effective tools to manage and analyze digital evidence at scale [22]. By addressing these challenges, investigators can improve their ability to solve complex crimes promptly and accurately.
The kind of techniques and the reason behind the different wrongdoing expectation studies and applications shifted in the papers are gathered. A significant number of the wrongdoing expectation strategies were created for nonexclusive violations and circumstances, where various models were utilized and tried in wrongdoing forecast to decide the best one compared with the given dataset [23]. For instance, an examination utilizing Machine Learning to foresee nonexclusive wrongdoing. Nonetheless, a few strategies have been produced for specific wrongdoing types or classes [24], for example, who demonstrated the Visa exchange succession of tasks utilizing a secret Markov model (Well) [25]. Different papers have zeroed in on playing out a near examination between the various learning model sorts; for example, two grouping calculations, to be specific, guileless Bayes and backpropagation, were looked at for anticipating the wrongdoing classification in light of a given dataset. Their investigation was performed utilizing 10-overlap cross-approval, and the discoveries show that guileless Bayes performed better than backpropagation for their wrongdoing dataset utilizing Weka. A couple of the papers discussed their goals. For instance, it worked with various learning models and calculations and tried them with multiple datasets. They inferred that it is basic to choose a model kind in light of the dataset given, as certain datasets are more viable with various model sorts [26]. Then again, some new studies have investigated wrongdoing forecast strategies. For instance, it reviewed information-digging techniques for wrongdoing expectation in light of various forecast factors, like financial, spatial-transient, segment, and geographic characteristics. Moreover, an efficient writing survey was given in which the writers presented their commitment to identifying and forecasting spatiotemporal wrongdoing areas of interest. They gave the ML and information mining methodologies in interest recognition, notwithstanding their viability, and illustrated the difficulties of building a spatiotemporal wrongdoing expectation model. Independently, it audited the different mechanical planning answers for wrongdoing expectations in brilliant urban areas. The creators considered a few unique portrayals of criminal portrayals and led a relative report. The creators accept that numerous thoughts and strategies have been laid out for wrongdoing expectations yet that field testing is fundamental for the ease of use of those methodologies. The creators centre around fake brain organizations and convolutional network procedures for anticipating violations [27]. Wellbeing and security are key significant viewpoints on personal satisfaction in metropolitan regions. The creators introduced an outline that summed up wrongdoing examination in metropolitan information, concentrated on a few kinds of criminal undertaking calculations, and talked about hypotheses on criminal science. Moreover, it gave a short, clear overview of the execution of techniques for wrongdoing expectations and the possibilities of further developing them later on. They utilized SVM, fluffy hypothesis, counterfeit brain organizations, and multivariate time series as Machine Learning techniques [28]. Then again, they introduced a survey of the managed and unaided techniques for wrongdoing discovery, which they examined and gauged violations [29].
While previous research has mostly concentrated on general crime prediction or a small number of particular crime categories, work may explore further into models that are unique to certain crime types, providing a more sophisticated approach. The study may close a significant gap in the literature by customizing predictive models to specific crime categories (such as fraud, cybercrime, and violent crimes), increasing the relevance and accuracy of forecasts. Although previous studies on crime prediction have established a solid basis, the work seeks to fill up several gaps and limitations [30]. Crime prediction approaches by emphasizing crime-type-specific models, real-world application, more extensive model comparisons, and the integration of temporal dynamics. Furthermore, the emphasis on urban crime prediction and smart cities brings a novel perspective consistent with the direction of crime prevention in increasingly digitalized settings [31].
Certain forms of crimes are the subject of certain publications, such as fraud detection using the hidden Markov model. This uniqueness is essential because different sorts of crimes have different patterns and traits [32]. These studies show how models may be customized to varying forms of criminal behavior by focusing on particular crime categories, which can result in more accurate forecasts in such circumstances [33].
The assumption of feature independence in Naive Bayes, inefficiencies in iterative processing with MapReduce, and sensitivity to outliers in Least Square Estimation all represent significant challenges. Moreover, there is a critical need for more robust preprocessing techniques and real-time data handling capabilities [34]. This study seeks to address these gaps by combining advanced Big Data processing tools with more sophisticated parameter estimation techniques and machine learning models, providing a comprehensive framework for digital forensic investigators to analyze large-scale crime data more effectively.
3.1 Naive Bayes classification on crime data
Naive Bayes is one of the artless classifications and includes everything from the digital criminology application to the exception, especially the text classification shown in Figure 1. Record R is given to classify that the general procedure is to give that class Ci, whose probability is P(Ci|R). To the exact value of P(Ci|R), this classification naively assumes that the properties of R are independent of each other. It was once thought that the derivative is used to calculate P(Ci|R) as follows:
$P\left(C_i \mid R\right)=\frac{P\left(R \wedge C_i\right)}{P(R)}$ (1)
$P\left(C_i \mid R\right)=\frac{P\left(R \mid C_i\right) P\left(C_i\right)}{P(R)}$ (2)
$P\left(C_i \mid R\right)=P\left(R \mid C_i\right) P\left(C_i\right)$ (3)
$\propto P\left(A_i=x_i \mid C_i\right) P\left(C_i\right)$ (4)
The denominator crosses P(R) because it is expected to all classes. The final derivation (4) is obtained by gaining independence between properties.
Figure 1. Crime data attributes
3.2 Crime data classification process using Naive Bayes
The procedures of the Naive Bayes classifier enable the assignment of labels to objects. The labels in the classification are predetermined, where it finds the structure and assign the labels. Classification problems are supervised learning methods. It starts with a digital criminology training set of pre-classified cases and assign class labels with knowledge of probability. Naive Bayes classification is a probability classification based on Bayesian law and naive conditional independence assumptions. In simple terms, a Nav Bayes classification assumes that the presence or absence of a particular feature of a class/group is not related to the presence or absence of other attributes. Input variables are usually discrete or categorical, but there are variations in algorithms that work with continuous variables. Tehes only consider discrete input variables. However, weight can be regarded as a constant variable, classified as intervals to convert weight into a categorical variable. The output usually provides a probability score and class membership. Output form Most implementations assign a class lag probability score and a class label corresponding to the highest log probability score. Nav Bayesian classifiers are among the most successful approaches to learning to classify text data. Naive Bayes classifiers are used to identify frauds. This application in digital criminology relies on feature-rich training data, whether or not it can categorize text data using least square estimation.
3.3 Regression analysis for least square estimation
Failure to produce, if any, is assumed to follow a linear model. However, it is essential to distinguish between failure data and non-failure data. It is also difficult to classify whether the failure is a fundamental failure or some transmission delay caused by network issues and other issues related to the hardware. There may be some instances of misclassification where data can be classified as an error area or vice versa. Therefore, it is essential to classify the data and identify the fault and error-free datasets. This paper uses the statistical method of Least Square Estimation (LSE) for digital criminology data. It is also known as the least squares estimation used for small-size models. This approach considers the model parameters by fitting the functional relationship of the failure intensity to the mean value of one variable relative to the mean value of the other. Here, the data set coefficients of the equation Y=m X+c can be calculated by solving the general equation. The standard equations are represented by:
Regression equation of y on x:
$\sum y=m \sum x+N c$ (5)
$\sum x y=m \sum x^2+c \sum x$ (6)
Regression equation of x on y:
$\sum x=m \sum y+N c$ (7)
$\sum x y=m \sum y^2+c \sum y$ (8)
At this time, the values of a and b make it easy to compute the value of y for any given value of x or x for any given value of y. The values of a and b are found with the help of the above standard equations.
3.4 Naive Bayes classifier with MapReduce approach
The old-fashioned indoctrination languages have the sequential analysis of the largest Digital Criminological data. MapReduce has parallel processing of Digital Criminological data with a set of mapper and reducer classes. Hadoop uses a MapReduce method to analyze the least square estimation of digital criminological data. Hadoop is intended for offline processing through read transactions, and from now on, analysis on analysis on huge Digital Criminological four subgroup datasets has been made easy.
Figure 2. Crime data classification using mapreduce process
MapReduce is a Hadoop teaching approach for dispersed-based least square assessment computation. In Figure 2, MapReduce parting the work conceded to by the client into little parallelized maps and decreased tasks. The client’s piece is to determine a guide capability wherein the Mapper class proceeds as a key/esteem pair and makes a bunch of moderate key/esteem yield matches. The Minimizer class aggregates the middle key/esteem yield matches delivered past and creates a last key/esteem yield match. Hadoop provides a bunch of programming interfaces that are needed to make Mapper and Minimizer classes. The Mapper class accepts the contribution of each as a <Key, Value> pair, and the result is a <Key, Value> pair. The conceivable approach to making a mapper class is broadening a predefined Mapper class with indicated information and result designs. The usefulness of the mapper is evident in the guide’s capability. The expected approach to making a Minimizer class is expanding a predefined class named Minimizer with determined information and result designs. The usefulness of the minimizer is evident in the decreased capability. The contribution to an application is a bunch of keys and values handled by map capability, which creates a rundown of K1, K2, and V1, V2 values. The minimizer takes the K1, K2, and V1, V2 values as information, processes them, and produces a rundown of Keys and Values for everything. The Computerized Criminal Science application is utilized for a thoughtful MapReduce approach.
Because of their complementing advantages, Naive Bayes and Least Square Estimation work well together for crime prediction tasks. In addition to being exceptionally effective at managing the categorical and high-dimensional data frequently present in crime datasets, Naive Bayes is an excellent classifier. On the other hand, LSE offers a dependable technique, especially in regression issues, for evaluating connections between variables and lowering prediction errors. Combined, these methods provide a solid basis to developing a precise and understandable crime prediction model suited to the intricacies of criminological data.
By integrating MapReduce and Naive Bayes, two technologies that complement each other well, crime data analysis is improved. MapReduce makes scalability, parallel processing, and data aggregation possible, while Naive Bayes offers a straightforward yet efficient categorization method. When combined, they allow for precise and quick analysis of crime patterns, which in turn helps to improve crime prevention and investigation tactics [33].
The Criminal data processed, which includes many criminal details, is used to control the Digital Criminological investigators in India. The statistical model depends upon the quality of failure data profoundly gathered. The selection of the following crime categories, auto theft, robbery, rape, and murder, reflects a calculated approach to encompassing a wide range of illegal behaviours with differing degrees of effect and severity. These categories are essential for comprehending many facets of crime, enhancing public safety, and creating successful prevention plans. Researchers may thoroughly understand crime trends, manage resources effectively, and deal with violent and property crimes by incorporating these various crimes into the study. The prediction parameter of a statistical model is approximated based on these data, as shown in Table 1. The least-square estimation is used to approximate the parameters.
Table 1. Classified crime data estimated and predicted population values
|
Crime Data/City Names |
Murder |
Rape |
AutoTheft |
Robbery |
||||
|
Population Value (Units) |
Predicted Value (Units) |
Population Value (Units) |
Predicted Value (Units) |
Population Value (Units) |
Predicted Value (Units) |
Population Value (Units) |
Predicted Value (Units) |
|
|
Bhimavaram |
16.5 |
3.04 |
24.8 |
0.73 |
106 |
1260.42 |
494 |
2626.82 |
|
Narasapuram |
4.2 |
2.05 |
13.3 |
14.64 |
122 |
984.15 |
954 |
4558.82 |
|
Tadepalligudem |
11.6 |
0.23 |
24.7 |
0.78 |
340 |
620.82 |
645 |
150.42 |
|
Eluru |
18.1 |
4.65 |
34.2 |
2.47 |
184 |
236.02 |
602 |
546.02 |
|
Vijayawada |
6.9 |
0.54 |
41.5 |
11.94 |
173 |
331.35 |
780 |
510.42 |
|
Kakinada |
13 |
0.7 |
35.7 |
3.83 |
477 |
3634.82 |
788 |
608.02 |
|
Tuni |
2.5 |
3.5 |
8.8 |
24.88 |
68 |
2053.35 |
468 |
3360.02 |
|
Ravulapalem |
3.6 |
2.52 |
12.7 |
15.85 |
42 |
2706.82 |
637 |
205.35 |
|
Rajahmundry |
16.8 |
3.31 |
26.6 |
0.15 |
289 |
138.02 |
697 |
1.35 |
|
Amalapuram |
10.8 |
0.07 |
43.2 |
15.16 |
255 |
8.82 |
765 |
350.42 |
|
Palakollu |
9.7 |
0 |
51.8 |
37.39 |
286 |
120.42 |
862 |
1915.35 |
|
Visakhapatnma |
10.3 |
0.02 |
39.7 |
8.94 |
266 |
33.75 |
776 |
464.82 |
|
Razole |
9.4 |
0.01 |
19.4 |
5.07 |
522 |
5170.82 |
848 |
1612.02 |
|
Gudivada |
5 |
1.5 |
23 |
1.75 |
157 |
498.82 |
488 |
2788.02 |
|
Gunturu |
5.1 |
1.44 |
22.9 |
1.82 |
85 |
1674.82 |
483 |
2926.02 |
|
Annavaram |
12.5 |
0.5 |
27.6 |
0.02 |
524 |
5245.35 |
793 |
673.35 |
The Predictable data are the difference between repetitions like Murder, Rape, AutoTheft, and Robbery are well-known in Digital Criminological. Using this approach, of above groups have been identified as Murder, Rape, AutoTheft, and Robbery. The initial selection of threshold value can affect the output in the groups. Hence, the procedure often runs many times with different initial circumstances to get a fair clarification of which group should be.
For testing this proposed method, it conducted experiments with not the same target, specifically Murder, Rape, AutoTheft, and Robbery data shown in Table 1.
Mean: The mean, also called the average, is a dataset's central tendency metric. The computation involves adding up each value in the dataset and dividing the result by the total number of values.
$Mean=\frac{\sum_{i=1}^n y_i}{n}$ (9)
where, n=number of crime cases observations; y=actual output.
Variance: The spread or dispersion of data points around a dataset's mean is measured by variance. It represents the degree to which individual data points differ from the average.
$Varience =\frac{\sum_{i=1}^n(y-\bar{y})^2}{n-1}$ (10)
where, n=number of crime cases observations; y=actual output; $\bar{y}$=predicted output.
Mean Squared Error (MSE): The average of the squared discrepancies between the expected and actual values is known as the Mean Squared Error or MSE. It is beneficial when it has unexpected values that wish to consider because it assigns more weight to more considerable disparities.
$M S E=\frac{1}{n} \sum(y-\bar{y})^2$ (11)
where, n=number of crime cases observations; y=actual output; $\bar{y}$=predicted output.
Root Mean Squared Error (RMSE): This represents the MSE squared. The error metric can frequently be made easier to understand by returning it to the same unit as the target variable by taking the square root of the mean square error.
$\begin{gathered}R M S E=\sqrt{M S E} \\ (\mathrm{OR}) \\ R M S E=\sqrt{\frac{1}{n} \sum_{k=1}^n\left(y_k-\bar{y}_k\right)^2}\end{gathered}$ (12)
where, n=number of crime cases observations; y=actual output; $\bar{y}$=predicted output.
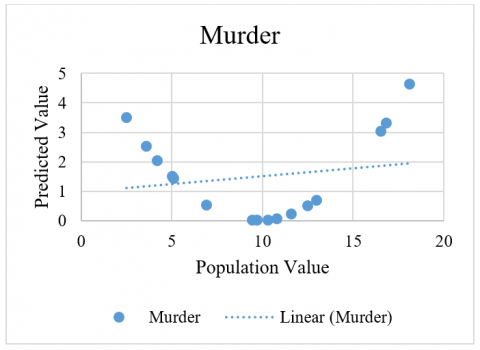
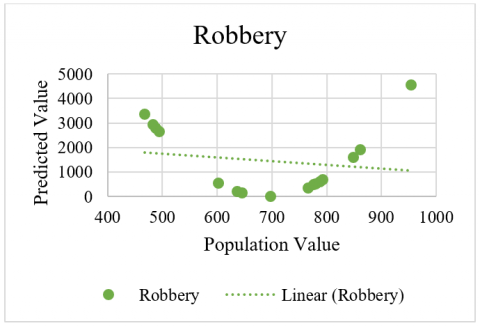
The criminal data related in a curved fashion is shown in Figure 3 for Murder, Figure 4 for Rape, Figure 5 for AutoTheft and Figure 6 for Robbery crimes. Here, it has simple data containing two variables in each group. For each group, the first is the response variable, and the second is the predictor. It appears that the response variable increases and then decreases again. If the plot the data, then it can see the situation more clearly. The relationship of the comparative analysis is shown in Figure 7.
Figure 3. Murder data statistical evaluation
Figure 4. Rape data statistical evaluation
Figure 5. AutoTheft data statistical evaluation
Figure 6. Robbery data statistical evaluation
Figure 7. Crime date comparative analysis
MSE and RMSE: By squaring the residuals, MSE and RMSE provide greater weight to larger errors. When significant errors are really unwanted, they are helpful. The primary distinction between them is that the RMSE is more easily interpreted because it is expressed in pieces similar to the dependent variable. Outliers can have a significant impact on the MSE and RMSE numbers.
This paper explored Least Squares Estimation, MapReduce, and Naive Bayes classification to analyze crime data efficiently. It demonstrates how these methods could enhance the accuracy of crime forecasts, manage large datasets, and provide valuable data for law enforcement and the creation of public policy. Significant subgroups of data sets are on display in front of digital criminology. It highlights the need for a well-trained probability assessment module to identify, collect, preserve, and securely analyze big data evidence. A class of knowledge to deal with future work uncertainty data is uncertain. To solve the problem of one-class learning and concept summarization practice on uncertain one-class data brooks. Wide trials on uncertain data brooks prove that our future uncertainty one-class learning method works better than others, and our concept summarization method can capture user emerging interests from parts of history.
[1] Araujo, A.P.D.B., Costa, A.P.C.S. (2024). A decision support system for predictive crime analytics and a patrol system. In Social Science Research Network. https://doi.org/10.2139/ssrn.4769478
[2] Jalil, M.M.A., Mohd, F., Noor, N.M.M. (2017). A comparative study to evaluate filtering methods for crime data feature selection. Procedia Computer Science, 116: 113-120. https://doi.org/10.1016/j.procs.2017.10.018
[3] Momtaz, M., Padela, J., Leslie, R., Quader, F. (2024). Developing predictive models for smart policing based on Baltimore’s crime and product price correlation. In Intelligent Sustainable Systems, pp. 551-566. https://doi.org/10.1007/978-981-99-8031-4_48
[4] Wu, J., Frias-Martinez, E., Frias-Martinez, V. (2020). Addressing under-reporting to enhance fairness and accuracy in mobility-based crime prediction. In Proceedings of the 28th International Conference on Advances in Geographic Information Systems, pp. 325-336. https://doi.org/10.1145/3397536.3422205
[5] Almaw, A., Kadam, K. (2018). Crime data analysis and prediction using ensemble learning. In 2018 Second International Conference on Intelligent Computing and Control Systems (ICICCS), pp. 1918-1923. https://doi.org/10.1109/ICCONS.2018.8663186
[6] do Rêgo, L.G.C., da Silva, T.L.C., Magalhães, R.P., de Macêdo, J.A.F., Silva, W.C.P. (2020). Exploiting points of interest for predictive policing. In Proceedings of the 3rd ACM SIGSPATIAL International Workshop on Advances in Resilient and Intelligent Cities, pp. 20-28. https://doi.org/10.1145/3423455.3430319
[7] Tamilarasi, P., Rani, R.U. (2020). Diagnosis of crime rate against women using K-fold cross validation through machine learning. In 2020 Fourth International Conference on Computing Methodologies and Communication (ICCMC), pp. 1034-1038. https://doi.org/10.1109/ICCMC48092.2020.ICCMC-000193.
[8] Kadar, C., Maculan, R., Feuerriegel, S. (2019). Public decision support for low population density areas: An imbalance-aware hyper-ensemble for spatio-temporal crime prediction. Decision Support Systems, 119: 107–117. https://doi.org/10.1016/j.dss.2019.03.001
[9] Remani, N.V.J.M., Naresh, V.S., Reddi, S., Kumar, K.D. (2022). Crime data optimization using neutrosophic logic based game theory. Concurrency and Computation: Practice and Experience, 34(15): e6973. https://doi.org/10.1002/cpe.6973
[10] Saravanan, P., Selvaprabu, J., Arun Raj, L., Abdul Azeez Khan, A., Javubar Sathick, K. (2021). Survey on crime analysis and prediction using data mining and machine learning techniques. In Advances in Smart Grid Technology, Springer, Singapore, pp. 435-448. https://doi.org/10.1007/978-981-15-7241-8_31
[11] Borowik, G., Wawrzyniak, Z.M., Cichosz, P. (2018). Time series analysis for crime forecasting. In 2018 26th International Conference on Systems Engineering (ICSEng), pp. 1-10. https://doi.org/10.1109/ICSENG.2018.8638179
[12] Deshmukh, M., Bhairnallykar, S., Bukkawar, S., Sharma, R., Kale, S. (2024). Machine learning approach combined with statistical features in the classification of peripheral pulse morphology. International Journal of Computational Methods and Experimental Measurements, 12(1): 69-75. https://doi.org/10.18280/ijcmem.120108
[13] Kadali, D.K., Venkata Naga Raju, D., Venkata Rama Raju, P. (2022). Cluster query optimization technique using blockchain. In International Conference on Information and Management Engineering, pp. 631-638. https://doi.org/10.1007/978-981-99-2742-5_65
[14] Kadali, D.K., Mohan, R.J. (2022). Shortest route analysis for high-level slotting using peer-to-peer. In the Role of IoT and Blockchain, Apple Academic Press, pp. 113-122. https://doi.org/10.1201/9781003048367-10
[15] Kadali, D.K., Mohan, R.J., Vamsidhar, Y. (2012). Similarity based query optimization on map reduce using euler angle oriented approach. International Journal of Scientific and Engineering Research, 3(8): 1-4.
[16] Darapaneni, C.S., Rao, B. ., Prasad, B.B.V.S.V., Bulla, S. (2021). An analytical performance evaluation of MapReduce model using transient queuing model. Advances in Modelling and Analysis B, 64(1-4): 46-53. https://doi.org/10.18280/ama_b.641-407
[17] Calderon, M.H.H., Palad, E.B.B., Tangkeko, M.S. (2020). Filipino online scam data classification using decision tree algorithms. In 2020 International Conference on Data Science and Its Applications (ICoDSA), pp. 1-6. https://doi.org/10.1109/ICoDSA50139.2020.9212929
[18] Kadali, D.K., Mohan, R.J., Naik, M.C. (2023). Enhancing crime cluster reliability using neutrosophic logic and a Three-Stage model. Journal of Engineering Science and Technology Review, 16(4): 35-40. https://doi.org/10.25103/jestr.164.05.
[19] Kadali, D.K., Chandra Naik, M., Jagan Mohan, R.N.V. (2022). Estimation of data parameters using cluster optimization. In International Conference on Data Management, Analytics & Innovation, pp. 331-342. https://doi.org/10.1007/978-981-19-2600-6_23
[20] Wang, J., Hu, J., Shen, S., Zhuang, J., Ni, S. (2020). Crime risk analysis through big data algorithm with urban metrics. Physica A, 545(123627): 123627. https://doi.org/10.1016/j.physa.2019.123627
[21] Cichosz, P. (2020). Urban crime risk prediction using point of interest data. ISPRS International Journal of Geo-Information, 9(7): 459. https://doi.org/10.3390/ijgi9070459
[22] Borges, J., Ziehr, D., Beigl, M., Cacho, N., Martins, A., Araujo, A., Bezerra, L., Geisler, S. (2018). Time-series features for predictive policing. In 2018 IEEE International Smart Cities Conference (ISC2), pp. 1-8. https://doi.org/10.1109/ISC2.2018.8656731
[23] Tutak, M., Brodny, J. (2023). A smart city is a safe city: Analysis and evaluation of the state of crime and safety in Polish cities. Smart Cities, 6(6): 3359-3392. https://doi.org/10.3390/smartcities6060149
[24] Vengadeswaran, Binu, D., Rai, L. (2024). An efficient framework for crime prediction using feature engineering and machine learning. In Advances in Data and Information Sciences, pp. 49-59. https://doi.org/10.1007/978-981-99-6906-7_5
[25] Kadali, D.K., Mohan, R.N.V., Padhy, N., Satapathy, S., Salimath, N., Sah, R.D. (2022). Machine learning approach for corona virus disease extrapolation: A case study. International Journal of Knowledge-based and Intelligent Engineering Systems, 26(3): 219-227. https://doi.org/10.3233/kes-220015
[26] Bandekar, S.R., Vijayalakshmi, C. (2020). Design and analysis of machine learning algorithms for the reduction of crime rates in India. Procedia Computer Science, 172: 122-127. https://doi.org/10.1016/j.procs.2020.05.018
[27] Aldossari, B.S., Alqahtani, F.M., Alshahrani, N.S., Alhammam, M.M., Alzamanan, R.M., Aslam, N., Irfanullah. (2020). A comparative study of decision tree and Naive Bayes machine learning model for crime category prediction in Chicago. In Proceedings of 2020 6th International Conference on Computing and Data Engineering, pp. 34-38. https://doi.org/10.1145/3379247.3379279
[28] Biswas, A.A., Basak, S. (2019). Forecasting the trends and patterns of crime in Bangladesh using machine learning model. In 2019 2nd International Conference on Intelligent Communication and Computational Techniques (ICCT), pp. 114-118. https://doi.org/10.1109/ICCT46177.2019.8969031
[29] Jha, G., Ahuja, L., Rana, A. (2020). Criminal behaviour analysis and segmentation using K-means clustering. In 2020 8th International Conference on Reliability, Infocom Technologies and Optimization (Trends and Future Directions) (ICRITO), pp. 1356-1360. https://doi.org/10.1109/ICRITO48877.2020.9197791
[30] Shukla, S., Jain, P.K., Babu, C.R., Pamula, R. (2020). A multivariate regression model for identifying, analyzing and predicting crimes. Wireless Personal Communications, 113(4): 2447–2461. https://doi.org/10.1007/s11277-020-07335-w
[31] Alkhaibari, A.A., Chung, P.T. (2017). Cluster analysis for reducing city crime rates. In 2017 IEEE Long Island Systems, Applications and Technology Conference (LISAT), pp. 1-6. https://doi.org/10.1109/LISAT.2017.8001983
[32] Li, Z., Zhang, T., Jing, X., Wang, Y. (2021). Facial expression-based analysis on emotion correlations, hotspots, and potential occurrence of urban crimes. Alexandria Engineering Journal, 60(1): 1411-1420. https://doi.org/10.1016/j.aej.2020.10.061
[33] Massarelli, C., Uricchio, V.F. (2024). The contribution of open source software in identifying environmental crimes caused by illicit waste management in urban areas. Urban Science, 8(1): 21. https://doi.org/10.3390/urbansci8010021
[34] Rumiantsev, T., van der Rijst, R., Admiraal, W. (2023). A systematic literature review of collaborative learning in conservatoire education. Social Sciences & Humanities Open, 8(1): 100683. https://doi.org/10.1016/j.ssaho.2023.100683