Gilang Idfi*![]() | Umboro Lasminto
| Umboro Lasminto![]() | Anak Agung Gde Kartika
| Anak Agung Gde Kartika![]()
© 2024 The authors. This article is published by IIETA and is licensed under the CC BY 4.0 license (http://creativecommons.org/licenses/by/4.0/).
OPEN ACCESS
The present study will attempt to investigate the energy dissipation in a stair-shaped stilling basin, developed as an improved model of the USBR Type III basin. For this purpose, an initial step of planning and modeling of the flume was undertaken, followed by experimental setup and data collection on the water level, critical depth, velocity, and discharge. In each of these two models, experiments were conducted for 10 variations in discharge. The energy dissipation ratio for the stair-shaped model reached 81.59%, as opposed to 78.99% for the USBR Type III. That means that the efficiency in the stair-shaped model is 2.6% higher. The velocity varied between 19.17 and 29.80 m/s for the USBR Type III model and between 17.42 and 28.14 m/s for the stair-shaped model. The maximum water level in USBR Type III was 'this', while in the stair-shaped model, it is +22.95, thus showing better energy dissipation. The stair-shaped model, also closely lies with the hydraulic jump state according to Elevatorski's formula and shows a value of 7% skewness. Further recommendations on topographic and geological conditions are warranted for the application of a stair-shaped basin.
stilling basin, USBR type III, stair-shaped type, energy dissipation ratio, efficiency perform
The purpose of energy dissipators is to lessen the spillway's (chute's) kinetic energy before it enters the original river. During the dissipation interaction, the peculiarity of the hydraulics jump shows up, demonstrating the scattering system [1]. Deciding the four sorts of energy dissipators depends on land conditions and normal riverbed materials. Free jets or energy dissipators like stilling basins can be used in riverbeds with hard rock beds because the slowed flow will be released back into the river [2]. The energy of the supercritical flow through the drop line into the subcritical flow that returns to the river is reduced by this structure [3, 4].
The spillway is a crucial element of a dam structure [1]. Spillways are dam energy dissipators [5, 6]. The primary function of the spillway is to manage surplus water in the reservoir, keeping it from spilling over the dam's crest. This is crucial to avoid potential damage to the dam's structural integrity [7]. This design minimizes the energy of the supercritical flow in the channel (drop line) as it transitions into a subcritical flow to reenter the river [3, 4]. When designing a spillway, it is essential to consider both the flow capacity and energy dissipation [8]. Flow capacity measures how effectively water can be transported along a spillway channel while adhering to hydraulic principles. When water exceeds the spillway's capacity, it enters the spillway channel and encounters an energy-dissipating structure known as the stilling basin [9]. The spillway comprises multiple components, including the crest spillway, transition channel, launcher channel, energy dissipator, and downstream guiding channel. Spillway systems frequently have issues concerning transition channels, launcher channels, and energy dissipators [10]. Issues frequently arising in transition channels can manifest in open and closed channels. Cross-flow is a common issue in open channels, caused by variations in the channel bottom, such as narrowing and broadening [11]. Irregular hydraulic performance of the transition channel leads to unstable conditions downstream. The flow turbulence in a closed channel causes two cross-flows at the outlet. A block must be added at the bottom of the channel [12].
The flow phenomena occurring in the cut-way entail the presence of high-velocity flow under supercritical conditions. Before directing the flow into the river, it is necessary to dampen it using energy dissipators to transform it into subcritical flow [13]. An issue frequently encountered is the impairment of the downstream river caused by suboptimal performance of energy dissipators, necessitating nearly annual maintenance [14]. The primary goal is to attain subcritical flow conditions downstream to prevent harm to the original riverbed. The purpose of energy damping is to compensate for energy losses resulting from variations in height inside building structures [15]. Energy dissipators are engineered to mitigate the kinetic energy at the spillway's base (chute) before entering the natural river. During the dissipation process, hydraulic jumps are observed, which signifies the dissipation process [16, 17]. This phenomenon is associated with the requirement of downstream water depth to reduce energy volume (water depth behind) [18, 19]. The hydraulic jump can be regulated or guided by the presence of an end sill for downstream dissipation [20, 21]. Prior scholars, specifically Bradley and Peterka [22], Hager [23], and Chanson and Brattberg [24], have conducted extensive studies on energy absorbers. Energy absorbers can be categorized into four main types: rock energy absorbers, stilling basins, plunge pools, and free jets [25].
The classification of the four types of energy dissipators relies on assessing geological conditions and the composition of natural riverbed materials. River circumstances characterized by a bed composed of hard rock are conducive to using free jets or plunge pool-type energy dissipators. The attenuated flow will be discharged back into the river [2]. The formula for hydraulics used to plan energy dissipators is derived from the principle of energy conservation and the forces operating on the cross-section for flow conditions transitioning from supercritical to subcritical flow [26]. The energy dissipators commonly employed as a foundation for planning are primarily of the stilling basin type. The idea of a stilling basin-type energy dissipator is based on friction or collision between water molecules, which results in water circulation within the energy reducer [27]. Various design standards have been established for the configuration of energy absorbers, such as Saint Anthony Falls (SAF Basin), The United States of Berau Reclamation (USBR), Bhavani Basin, The Institute of Hydraulics Vedeneev (VNIIG) Lanigrade (USSR), and The United States Corps of Engineers (USCE).
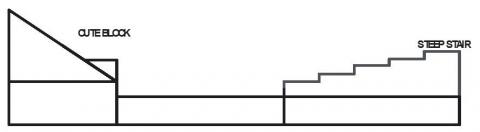
The dissipation efficiency is significantly influenced by the downstream water depth (tail water depth), as indicated by multiple experiments by Wahl & Falvey et al. in 2018. the study shows that the minimum water depth value is 0.8 times the conjugation depth (y2) for USBR type III. If the depth is below the minimum weir, the dissipation effectiveness is compromised due to jumps outside the stilling basin [28, 29]. To maintain the structural integrity of the river geometry, hydraulic jumps must be present in the stilling basin [30, 31]. Suppose the depth of the tailwater does not satisfy the necessary criteria. In that case, a negative (Stair-Shaped) slope is needed to decrease the energy loss and increase the water level downstream. Modifications to the USBR Type III stilling basins are required, see Figure 1.
Figure 1. USBR Type III stilling bassin
The Stair-Shaped type stilling basin was modified to obtain an effective energy dissipation value. The modification used is to change the downward-sloping shape shown in Figure 2. The Stair-Shaped-type stilling basin has a better energy dissipation capability than the USBR type III. However, to further improve the dissipation in the stilling basin, this research modifies the shape of the Stair-Shaped type stilling basin, which originally had only a negative slope, into a stair shape. Into a stair shape that is shown in Figure 3.
The Stair-Shaped stilling basin was modified to obtain an effective energy dissipation value. The modification used is to change the downward-sloping shape shown in Figure 2. The adverse-type stilling basin has a better energy dissipation capability than the USBR type III [32, 33]. However, to further improve the dissipation in the stilling basin, this research modifies the shape of the adverse type stilling basin, which originally had only a negative slope, into a stair shape that is shown in Figure 3.
Figure 2. Stair-shaped type stilling basin
Figure 3. Stair-shaped-type stilling basin with stair shape modification
In previous studies, this stepped form has often been used in weirs [34-40]. The advantages of a stair weir are a reduction in the potential risk of cavitation and a reduction in pool dimensions downstream of the weir toe due to significant energy dissipation along the channel. However, in this research, a stair shape is used to apply to the stilling basin. In the Stair-Shaped-type stilling basin with stair shape modification, the flow velocity is reduced due to the damping caused by the steps [41, 42]. The steps act like small cascades placed in series, and each step acts as a small energy absorber for the previous step. The selection of this stair shape is expected to cause collisions between the ladder wall and water gradually following the elevation of the steps so that energy can be dissipated.
The collision factor in a stair-shaped stilling basin directly influences the pace at which energy is dissipated. As the friction factor increases, the velocity of the flow decreases. Decreased air concentration occurs as a consequence of reduced flow velocity. The reduced air concentration in the flow will also lead to a drop in kinetic energy. Reduced kinetic energy leads to increased energy dissipation. Therefore, the risk of cavitation in a stair-shaped stilling basin can be mitigated by ensuring that the overflow velocity is kept at a low level.
2.1 General
This research is an experimental investigation with primary data taken in the laboratory. The first stage is to plan and model the flume, consider the formulation used in the test, and then prepare a place for research (set up experiment). The design of the flume was informed by the findings of research studies [6, 43]. The investigation clarified that the ideal slope ratio is 1:2, with a height of 1 meter and a width of 2 meters. Phenomena of flow in the flume are also carried out to get an overview of flow behavior in energy absorbers, especially the effectiveness of energy reduction (∆E), before running the calibration tool. The measurement results are obtained from the running results by recording the water level, critical depth, flow velocity, flow height, flow depth, and flow rate. After recording the data, the energy dispensation that occurs is calculated.
2.2 Test set-up and procedure
A tangible replica of a USBR Type III stilling basin was built to carry out this inquiry. The Type III USBR stilling basin contains three circuit breakers: an end platform positioned downstream, a baffle block placed in the middle, and a trough block positioned upstream within the tank. These three components of the stilling basin are designed to reduce the flow rate from the initial supercritical flow to a subcritical rate by predicting or minimizing the flow energy. The Type III USBR stilling basin is designed based on the Froude number, and this formula is used to determine the flow characteristics [6, 41, 42]. The Froude number equation used is as follows. The USBR Type III stilling basin design results are used as a reference to obtain the final weir height value of the Stair-Shaped type stilling basin with the modification of the staircase shape contained in Figure 4.
Figure 4. The prototype of a stair-shaped type stilling basin with staircase shape modification
$F r=\frac{V}{\sqrt{g \cdot Y_{c r}}}$ (1)
In this experiment, 10 different flow variations were employed with a discharge rate ranging from 3 to 10 liters per second, which is also very compatible with the laboratory's current pump capacity of 12 liters per second.
Once the cutaway slope design is achieved, the discharge calibration is determined using the Thompson gauge (Figure 5), which has a triangle shape with a side length of 35 cm. Measuring water flow involves manipulating the water level to exceed the predetermined weir of the Thompson gauge. This information is then used to construct a rating curve, a graphical representation of the correlation between discharge and water level over the weir.
Figure 5. Thompson gauge
Discharge calibration is performed to ascertain the precision of the discharge measurements in the Thompson measuring device. Three tests were calibrated using discharge rates of 10,048 l/s, 8,349 l/s, and 6,554 l/s. Based on the results of the three trials, the average Froude Number (Fr) is determined to be 4.56 (Table 1). This value indicates that the flow characteristics are supercritical with turbulent flow, as Fr is more than 1. The dimensions of the components, including the length of the stilling basin, chute block, baffle block, and end sill, are designed according to the USBR Type III design (Figure 6) with the Fr value exceeding 4.5.
Table 1. Froude number calibration
|
Q |
H0 |
y1 |
v1 |
y2 |
v2 |
Fr |
|
lt/s |
m |
m |
m/s |
m |
m/s |
|
|
10.048 |
0.068 |
0.024 |
2.138 |
0.137 |
0.368 |
4.453 |
|
8.349 |
0.063 |
0.020 |
2.087 |
0.124 |
0.338 |
4.712 |
|
6.835 |
0.052 |
0.018 |
1.899 |
0.106 |
0.321 |
4.518 |
Figure 6. The prototype of type III USBR stilling basin
While preparing the setup experiment, the hydraulic flow formulation smoothly entered the basin downstream of the canal. It returned to the reservoir without the requirement of constructing a barrier as a wastewater-controlling device downstream of the canal. During each model's testing, measurements were taken for the critical depth (yc), flow rate along the spillway (v), flow depth (d1) before and after the hydraulic leap (d2), and the length of the hydraulic jump (Lj).
This research entails studying the initial model by examining the impact of water level at the downstream boundary condition, also known as downstream water depth. During the test, any alteration in the flow rate directly affects the location of the wastewater depth. A transparent acrylic barrier, positioned at the same height as y2, was placed downstream of the channel to generate the tailwater effect. According to several conducted research, the depth of the water downstream has a significant impact on the effectiveness of damping. The minimum water depth required is 0.8 times the conjugate depth (y2). Figure 7 displays the form and measurements of the barrier block.
Figure 7. Barrier block at downstream flume
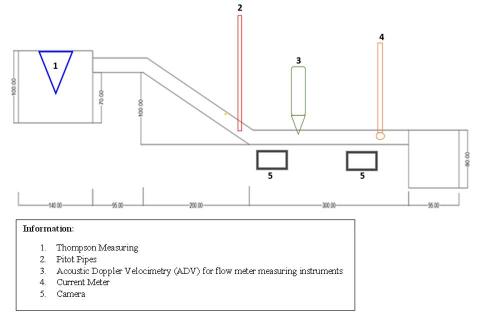
To make it easier to control the flow and accuracy in data collection, measuring instruments are used to record discharge and velocity using Thompson, pitot pipes, flow meter measuring instruments, Acoustic Doppler velocimetry (ADV) measuring instruments, and current meters. The placement of each measuring instrument can be seen in Figure 8. The measurement structure used in this study is a triangular spike dam, Thompson dam, or V-notch, with each side of the triangle measuring 35 cm in length, as shown in Figure 9. The experiment utilized a variety of flow rates, ranging from 3.818 to 10.10 liters per second. The weir base is horizontally oriented to decrease the velocity of the incoming flow, while the measurement structure is positioned to obstruct the flow.
Figure 8. Schematic of measuring instrument
(a) Thompson weir measuring instruments/V-Notch
(b) Flow Velocity measurement with current meter
Figure 9. The measurement structure
To study the hydraulic characteristics affected by the Tailwater, one must measure the water depth at two points: Y1, upstream of the stilling basin at the beginning of the discharge channel, and Y2, downstream of the stilling basin at a distance d. The measurement implementation is documented in Figure 10.
Figure 10. Testing process documentation
This experiment can demonstrate the state of turbulence. The turbulent region, specifically the area around the baffle block, is where velocity testing occurs. It is located between the trough block and the end weir. There is an abrupt flow transition as the launch channel's steep incline transitions to a gentle incline. commonly known as an abrupt alteration in flow rate. This predicament incites turmoil amidst the prevailing circumstances. This flow exhibits sudden changes in velocity, unpredictable movements, and uneven patterns. The speed measurement value in this test is generated automatically by the Acoustic Doppler Velocity Meter (ADV). Figures 11 and 12 depict a sample test document exhibiting a flow rate of 10.1 liters per second.
Figure 11. Turbulent condition
Figure 12. Velocity testing using ADV
2.3 Analyzing data
A. Hydraulics characteristics of a spillway
The spillway building necessitates the absence of backwater when flood discharge occurs. To fulfill these criteria, the design of the spillway structure ensures that during flood discharge, the disparity in water levels between the upstream and downstream sides of the regulating weir is at least two-thirds of the water level above the spillway [43].
B. Flow profile
Typically, there are three ways to calculate flow profiles: the graphical integration approach, the direct integration method, and the phasing method. The phasing approach involves partitioning the channel into smaller segments and then calculating incrementally from one end to another. Multiple phasing techniques are available. However, only a select few are considered the most effective for each challenge [44]. The Direct Stages Method is a straightforward technique that applies to prismatic channels. The equation employed in the study conducted by Hendratta and Tangkudung in 2020:
$\mathrm{c}=\mathrm{h}_2 \mathrm{a}_2 \frac{v_2}{2 g}{ }^2+S F \Delta_F$ (2)
$\Delta_{\mathrm{x}}=\frac{E_2-E_1}{S_0-S f}=\frac{\Delta E}{s_0-S f}$ (3)
$\mathrm{E}=\mathrm{E}_1=\mathrm{E}_2$ (4)
$\mathrm{E}=h+\alpha \frac{V^2}{2 g}$ (5)
The normal depth (y) refers to the water depth in a channel calculated using the uniform flow equation. Manning's equation is utilized to compute the depth and flow velocity. It is widely recognized that calculations for flow through open channels can only be performed using empirical formulas. One such method is the Manning equation, which is relatively pragmatic and yields highly satisfactory results when applied, as seen in the following equation. The study's authors, Putro and Hadihardaja, conducted research in 2013.
Flow velocity influences the flow characteristics that occur [45-47]. There are 3 flow characteristics based on the Reynold Number (Re) that occur: laminar, transitional, and turbulent flow. The Reynolds Number can be used to determine if the flow is laminar, transient, or turbulent. The flow is laminar - when Re < 2300, transient - when 2300 < Re < 4000, and turbulent - when Re > 4000. The velocity value influences the three flows, where the velocity value is directly proportional to the Reynold Number (Re) value as in the sixth equation.
$\mathrm{Re}=\frac{V \times Y 1}{v}$ (6)
where, Re=Reynold Number; V=Velocity (m/s); Y1=Represents the depth before the occurrence of the hydraulic leap; $U$=Viscosity (m2/s).
C. Hydraulic jump
A hydraulic jump is the abrupt transition from a flow with high velocity to a flow with lower velocity. There is a quick rise in the water level and substantial energy dissipation during the hydraulic jump. A hydraulic leap happens when there is a rapid transition of water from supercritical flow to subcritical flow. This transition causes an abrupt rise in the water level and a substantial energy loss [41]. The initiation of the jump is indicated by creating a turbulent vortex, which extracts energy from the primary flow and then breaks into smaller fragments further downstream [42]. An impactful turbulent vortex is generated at the onset of the jump. The vortex derives energy from the primary current and breaks down into smaller components as it moves downstream [2]. In the case of supercritical flow in a horizontal rectangular channel, the flow energy is diminished due to the frictional resistance of the channel. Consequently, the velocity decreases, and the flow height increases in the flow direction. The characteristics of the flow downstream and the amount of energy dissipated in the hydraulic leap can be determined by applying the momentum principle, which depends on the Froude number and the upstream flow depth. The normal depth (y) refers to the water depth in the channel determined using the uniform flow equation. Manning's equation is utilized to compute the depth and velocity of flow.
The momentum equation (Figure 13) is the key factor in determining the energy computation in hydraulic springboard events.
Figure 13. Momentum equation in hydraulic springboard
$P 1-P 2=p Q\left(v_1-v_2\right)$ (7)
$\left(\frac{1}{2} p g \mathrm{y}_1^2-\frac{1}{2} p g \mathrm{y}_1^2\right)=p u_1 y_2\left(y_I-y_2\right)$ (8)
$(y 1-y 2)(y 1+y 2)=\frac{2 u 1 y 1}{g}\left(u_2-u_1\right)$ (9)
$S q=v_1 \cdot h_1=v_2 \cdot h_2$ (10)
$(\mathrm{y} 1+\mathrm{y} 2)=\frac{2 v_1 y 1^2}{g y 2}$ (11)
$\frac{y_1}{y_2}\left(1+\frac{y_1}{y_2}\right)=2\left(F_1^2\right)$ (12)
$\frac{y_1}{y_2}=\frac{1}{2}\left(\sqrt{1+8 F_1^2}-1\right)$ (13)
The variable y1 represents the depth before the occurrence of the hydraulic leap, while y2 represents the depth after the hydraulic jump. Various forms of hydraulic jumps occur on a horizontal bed. The United States Bureau of Reclamation's research indicates that hydraulic thrust can be differentiated by the Froude number Fr1 of the flow in question. The hydraulic surges observed on a flat surface can be described as follows [48]:
1. Critical Flow
For Fr1=1, When critical flow occurs, it prevents the formation of jumps.
2. Choppy Jumps
For Fr1=1 to Fr1=1,7, the choppy jump that occurs with the ratio y2/y1 is 1 to 20.
3. Weak Jumps
For Fr1 values ranging from 1.7 to 2.5, a sequence of oscillating wave patterns occurs on the jumping surface, while the water surface downstream stays undisturbed. The total velocity is constant, and the energy dissipation is minimal. The ratio y2/y1 ranges from 2 to 3.1.
4. Oscillating Jumps
For the range of Fr1 values from 2.5 to 4.5, the oscillating rays follow the jumping platform and go toward the surface before returning without exhibiting a specific period. Every oscillation generates a substantial and erratic wave, resulting in extensive and unrestrained harm to the embankment. The ratio y2/y1 ranges from 3.1 to 5.9.
5. Steady Jump
The edges of the downstream surface exhibit curling and the location with the greatest burst velocity tends to deviate from the flow when Fr1 is between 4.5 and 9. These two events usually happen on identical vertical surfaces. The motions and surges that occur are hardly affected by the depth of the bottom water. The hydraulic jump has exceptional equilibrium, making it the most favorable attribute. The energy dissipation ranges from 45% to 70%. The ratio between y2 and y1 varies between 5.9 and 12.
6. Strong Jump
When the Froude number is more than 9, strong burst speeds cause the rolling wave to split from the pedal face, forming a downstream wave. Irregularities on the surface will have an impact on the generated waves. Jumping maneuvers are infrequent but very effective due to their potential to reduce energy consumption by up to 85%. The ratio of y2 to y1 is bigger than 12. Peterka [49] categorized hydraulic jumps into four distinct types, as identified by the study [16]:
a. Pre-jump, if 1.7 < Fr1 < 2.5.
b. Transition jump if 2.5 < Fr1 < 4.5.
c. Stabilized jump if 4.5 < Fr1 < 9.
d. Choppy jump, if Fr1 > 9.
As explained by the study [39], hydraulic jumps are determined by their position at the foot of the channel slope angle.
1. A jump happens when a jump begins precisely at the base of the inclined channel.
2. B-jump is a jump that occurs after jump A and before jump B.
3. A C-jump is a phenomenon in which the beginning of a surge occurs at the slope of a channel, and the finish of the water wave roll occurs precisely at the base of the channel corner.
4. D-jump refers to the situation where all the surges take place on the channel slope, both at the beginning of the leap and at the end of the surge.
Additional variations of hydraulic stepping involve using non-rectangular channels, such as trapezoidal, circular, triangular, and U-shaped channels. Another variant is submerged hydraulic stepping [16].
D. Energy dissipator
The flow phenomenon in the launch channel is distinguished by an exceedingly high flow velocity and supercritical flow conditions. Thus, to prevent scouring and the degradation of the river's bottom and banks, the water flow must be slowed down and transitioned to subcritical flow conditions before entering the river [50].
3.1 Flow characteristic
The first step taken to get the flow characteristics is velocity measurement. Velocity measurements are made with ADV measuring instruments, in addition to measuring the value of the water level before the hydraulic jump (y1), which is used to calculate the Re or Reynold number. The following in Table 2 are the results of measuring the velocity of the water level before the hydraulic jump and calculating the Reynold number based on the sixth equation.
Table 2. Flow characteristics and Reynold's number
|
Discharge |
ν |
V |
Y1 |
Re |
Result |
|
lt/s |
cm²/s |
(cm/s) |
(cm) |
||
|
3.818 |
0.0089 |
57.260 |
0.55 |
3538.54 |
Transient |
|
4.340 |
0.0089 |
57.528 |
0.65 |
4201.48 |
Turbulent |
|
4.900 |
0.0089 |
59.184 |
0.70 |
4654.92 |
Turbulent |
|
5.510 |
0.0089 |
59.368 |
0.80 |
5336.45 |
Turbulent |
|
6.155 |
0.0089 |
59.552 |
0.90 |
6022.11 |
Turbulent |
|
6.850 |
0.0089 |
59.920 |
1.00 |
6732.58 |
Turbulent |
|
7.700 |
0.0089 |
60.472 |
1.10 |
7474.07 |
Turbulent |
|
8.360 |
0.0089 |
60.840 |
1.25 |
8544.94 |
Turbulent |
|
9.200 |
0.0089 |
61.208 |
1.40 |
9628.22 |
Turbulent |
|
10.100 |
0.0089 |
62.818 |
1.50 |
10587.30 |
Turbulent |
Based on the results of Table 2, it can be concluded that of the 10 experiments conducted, almost all of the flow characteristics are turbulent. The Re value produced above is more than 4000, and there is 1 experiment with a value of less than 4000. The results of this theoretical calculation are supported by observations during the experiment, where the flow has a random and rotating current (Figure 14) as characterized by turbulence flow characteristics.
Figure 14. Streamline in turbulent condition
3.2 The result of the USBR type III experimental model
Parameters for assessing the performance of a stilling basin, which are crucial benchmarks for measuring the occurring impacts, can be quantified by analyzing two primary aspects: the relative loss value (ΔE/E1) and the efficiency (E2/E1). The relative loss value (ΔE/E1) indicates the alteration in stilling basin efficiency relative to its starting value (E1). This demonstrates the impact of particular variables, such as temperature fluctuations or changes in water composition, on the stilling basin functionality. Efficiency (E2/E1) is a measure that indicates the ability of stilling ponds to effectively achieve specified objectives, such as preserving water quality or supporting aquatic life. Further explanation and calculation details for these two parameters can be found in Table 3.
Table 3. Hydraulic parameter calculation
|
No |
Discharge (cm³/s) |
Y1 (cm) |
V1 (cm/s) |
Fr1 |
Y2 (cm) |
y2/y1 |
|
1 |
3818 |
0.45 |
424.22 |
20.19 |
12.63 |
28.06 |
|
2 |
4340 |
0.55 |
394.55 |
16.99 |
12.94 |
23.53 |
|
3 |
4900 |
0.60 |
408.33 |
16.83 |
13.98 |
23.31 |
|
4 |
5510 |
0.70 |
393.57 |
15.02 |
14.52 |
20.75 |
|
5 |
6155 |
0.80 |
384.69 |
13.73 |
15.14 |
18.93 |
|
6 |
6850 |
0.90 |
380.56 |
12.81 |
15.86 |
17.62 |
|
7 |
7700 |
1.00 |
385.00 |
12.29 |
16.89 |
16.89 |
|
8 |
8360 |
1.15 |
363.48 |
10.82 |
17.03 |
14.81 |
|
9 |
9200 |
1.30 |
353.85 |
9.91 |
17.58 |
13.52 |
|
10 |
10100 |
1.40 |
360.71 |
9.73 |
18.58 |
13.27 |
|
No |
Discharge (cm³/s) |
E1 (cm) |
E2 (cm) |
ΔE |
Energy Dissipation Ratio |
Efficiency |
|
1 |
3818 |
92.18 |
12.74 |
79.43 |
86.18 |
13.82 |
|
2 |
4340 |
79.89 |
13.08 |
66.81 |
83.62 |
16.38 |
|
3 |
4900 |
85.58 |
14.14 |
71.44 |
83.48 |
16.52 |
|
4 |
5510 |
79.65 |
14.71 |
64.94 |
81.54 |
18.46 |
|
5 |
6155 |
76.23 |
15.35 |
60.87 |
79.86 |
20.14 |
|
6 |
6850 |
74.71 |
16.10 |
58.62 |
78.46 |
21.54 |
|
7 |
7700 |
76.55 |
17.16 |
59.39 |
77.59 |
22.41 |
|
8 |
8360 |
68.49 |
17.34 |
51.15 |
74.68 |
25.32 |
|
9 |
9200 |
65.12 |
17.93 |
47.19 |
72.47 |
27.53 |
|
10 |
10100 |
67.72 |
18.96 |
48.76 |
72.00 |
28.00 |
|
Average |
78.99 |
21.01 |
||||
Table 3 thoroughly examines the USBR III Type stilling basin, considering the influence of tailwater. The analysis shows that the average energy dissipation ratio in the basin is 78.99%, while the efficiency level is 21.01%. This data offers a thorough overview of the efficacy of USBR III-type stilling basins in managing and dissipating energy, particularly when considering the impact of tailwater. The graphs in Figure 15 and Figure 16 is the correlation between pertinent and noteworthy factors.
Figure 15 demonstrates a direct relationship between the Froude Number (Fr1) and the energy dissipation ratio (ΔE/E1). As the value of the Froude Number increases, the energy dissipation ratio also increases, and vice versa. Almost all experiments with 10 discharges produced good data by following the trend of the polynomial graph formed. This result corresponds to the results of research conducted by the studies [41, 51, 52]. The magnitude of the loss will vary inversely with the efficiency. Figure 16 illustrates a direct relationship between the value of Fr1 and efficiency. The efficiency value of the stilling basin performance will decrease as the relative loss value increases, resulting in a larger Fr1 value. This is due to the imperfect dissipation of energy. It is expected that with the greater value of energy-damping efficiency in the stilling basin, the flow coming out of the stilling basin downstream can be changed from subcritical flow to critical flow so as not to endanger the downstream area.
Figure 15. Graphic relationship between energy dissipation ratio (ΔE/E1) and froude number (Fr1)
Figure 16. Efficiency and Fr1 relationship graph
3.3 Stair-shaped model with tailwater effect
Measuring hydraulic parameters affected by tail water involves monitoring the water depth upstream of the stilling basin (Y1) located at the base of the launch channel and the water depth downstream of the stilling basin (Y2). The measurement implementation documentation is included in Figure 17. The performance assessment characteristics of the affected Stair-Shaped stilling basin can be quantified using the energy dissipation ratio (ΔE/E1) and efficiency (E2/E1). The computation of these parameters is presented in Table 4.
Figure 17. Stair-shaped type testing with tailwater
Table 4. Hydraulic parameter calculation
|
No |
Discharge (cm³/s) |
Y1 (cm) |
V1 (cm/s) |
Fr1 |
Y2 (cm) |
y2/y1 |
|
1 |
3818 |
0.30 |
636.33 |
37.09 |
11.00 |
36.67 |
|
2 |
4340 |
0.40 |
542.50 |
27.39 |
11.95 |
29.88 |
|
3 |
4900 |
0.45 |
544.44 |
25.91 |
12.50 |
27.78 |
|
4 |
5510 |
0.50 |
551.00 |
24.88 |
14.00 |
28.00 |
|
5 |
6155 |
0.55 |
559.55 |
24.09 |
16.00 |
29.09 |
|
6 |
6850 |
0.60 |
570.83 |
23.53 |
18.00 |
30.00 |
|
7 |
7700 |
0.80 |
481.25 |
17.18 |
19.75 |
24.69 |
|
8 |
8360 |
1.25 |
334.40 |
9.55 |
21.00 |
16.80 |
|
9 |
9200 |
1.40 |
328.57 |
8.87 |
22.25 |
15.89 |
|
10 |
10100 |
1.50 |
336.67 |
8.78 |
22.95 |
15.30 |
|
No |
Discharge (cm³/s) |
E1 (cm) |
E2 (cm) |
ΔE |
Energy Dissipation Ratio |
Efficiency |
|
1 |
3818 |
206.68 |
11.15 |
195.53 |
94.60 |
5.40 |
|
2 |
4340 |
150.40 |
12.12 |
138.29 |
91.94 |
8.06 |
|
3 |
4900 |
151.53 |
12.70 |
138.83 |
91.62 |
8.38 |
|
4 |
5510 |
155.24 |
14.20 |
141.04 |
90.85 |
9.15 |
|
5 |
6155 |
160.13 |
16.19 |
143.94 |
89.89 |
10.11 |
|
6 |
6850 |
166.68 |
18.18 |
148.50 |
89.09 |
10.91 |
|
7 |
7700 |
118.84 |
19.94 |
98.90 |
83.22 |
16.78 |
|
8 |
8360 |
58.24 |
21.20 |
37.04 |
63.60 |
36.40 |
|
9 |
9200 |
56.43 |
22.47 |
33.96 |
60.18 |
39.82 |
|
10 |
10100 |
59.27 |
23.20 |
36.07 |
60.86 |
39.14 |
|
Average |
81.59 |
18.41 |
||||
From Table 4 it can be seen that the stair-shaped model produces an average energy dissipation ratio of 81.59% and an efficiency of 18.41%.
Figure 15 demonstrates a direct relationship between the Froude Number (Fr1) and the energy dissipation ratio (ΔE/E1). As the value of Fr1 increases, ΔE/E1 increases, and vice versa. From the experimental results, there is some data outside the trend in experiments with large discharge and producing large Froude number values as well; this is due to several factors, including the consistency of the discharge device settings. Existing equations can be used to reduce errors in the trend. A large Froude Number (Fr1) value can indicate the characteristics of the existing flow in the form of supercritical flow with high velocity so that the energy that must be reduced must also be high so as not to endanger the downstream of the stilling basin [41, 51, 52].
The magnitude of the loss will vary inversely with efficiency. Figure 16 demonstrates a direct relationship between the value of Fr1 and efficiency. As the value of Fr1 increases, efficiency increases, and vice versa. Efficiency is the ratio between the flow of energy upstream and downstream of the stilling basin(E1/E2). The greater the efficiency value produced, the better the dissipation performance of the stilling basin [45-59]. The energy dissipation ratio value will vary inversely with the efficiency value; as the energy dissipation value increases, the performance efficiency of the stilling pond will decrease, resulting in a larger Fr1 value, as shown in Figures 18 and 19. With a large energy dissipation value, it is hoped that the characteristics from the initially supercritical will become subcritical, with a small flow velocity.
Figure 18. Relationship graph of energy dissipation ratio (ΔE/E1) and Fr1
Figure 19. Efficiency and Fr1 relationship chart
3.4 Comparison of test results for USBR type III and stair-shaped type
Then referring to Table 3 indicates that USBR Type III has an average efficiency of 21.01%. On the other hand, Table 4 demonstrates that the stair-shaped model has an efficiency of 18.41%.
The USBR type III and the Stair-Shaped type were compared based on observations of their parameters, which may be found in Figures 20-22. Figure 20 demonstrates the relationship between discharge and energy dissipation ratio. The graph of the energy dissipation ratio equation obtained by the Stair-Shaped model is more effective in lowering flow energy compared to the dissipation ratio of the USBR Type III model. In Table 3, the average energy dissipation ratio for USBR Type III is 78.99%. The product of the energy dissipation ratio and the Stair-Shaped model in Table 3 is 81.59%, suggesting that the Stair-Shaped model can enhance energy reduction performance by 3.18%. Thus, the Stair-Shaped model with steps in the downstream part of the stilling basin as a substitute for the end sill and baffle block in USBR Type III can improve the performance of the existing energy dissipation ratio. Several studies have also mentioned that the stilling basin model with a sloping bottom has better damping performance than the USBR Type III model. The efficiency value will always be inversely proportional to the energy dissipated. Figure 21 demonstrates that the efficiency generated by the Stair-Shaped model surpasses that of the USBR Type III model.
Then referring to Table 3 indicates that USBR Type III has an average efficiency of 21.01%. On the other hand, Table 4 demonstrates that the stair-shaped model has an efficiency of 18.41%. This suggests that the Stair-Shaped model can enhance efficiency by 2.6%. The efficiency value will always be inversely proportional to the energy dissipation ratio value. The efficiency value is used to evaluate the stilling basin's performance. The higher the efficiency value, the better the stilling basin's performance [28-31].
The United States Bureau of Reclamation (USBR) developed Peterka's initial design. There are 4 stilling basins: USBR Stilling Basin Type I, USBR Stilling Basin Type II, USBR Stilling Basin Type III, and USBR Stilling Basin Type IV. In this study, USBR Stilling Basin Type III was used. The results of Peterka's theoretical calculations calculated by the study [41] from this equation can be presented in Table 2. The parameters in Table 2 can be presented in Figures 21-26, and the graphic results above are based on experiments with Peterka in 1958, which were included in Engineering Monograph (EM) 25 "Hydraulic Design of Stilling Basins and Energy Dissipators” [49]. These results will be used as a reference for comparing the experimental results of the USBR Type III model and the Stair-Shaped model in the next subchapter.
Figure 20. Relationship graph of discharge and energy dissipation ratio (ΔE/E1)
Figure 21. Relationship graph of discharge and efficiency
(a) Water level profiles of USBR type III
(b) Water level profiles of stair shaped type
(c) Comparison of water level profiles in USBR type III and stair-shaped type
Figure 22. The result of the water level experimental model
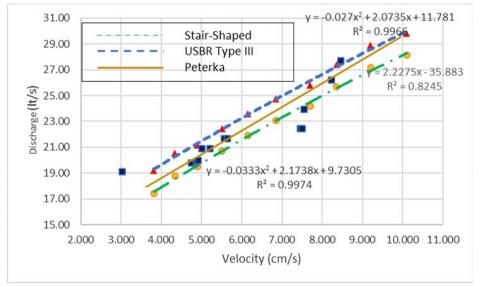
Figure 23. Relationship graph of discharge and velocity
Figure 24. Relationship between discharge and energy dissipation ratio
Figure 25. Relationship between discharge and efficiency
Figure 26. Relationship between discharge and velocity
Applying the Stair-Shaped model can decrease the value of the flow velocity. Figure 19, the velocity and discharge graph, clearly shows that the velocity of the Stair-Shaped model is lower than that of the USBR Type III model. The USBR Type III model has a velocity range of 19.17 m/s to 29.80 m/s, whereas the Stair-Shaped model has a velocity range of 17.42 m/s to 28.14 m/s. Thus, it can be inferred that implementing this detrimental model will effectively decrease erosion downstream of the stilling basin.
The USBR Type III stilling and the stair-shaped model should clearly show an association between the water level height during stream flow. The USBR Type III stilling basin, indicated by the blue line, has a maximum water level elevation of +18.58. In contrast, the Stair-Shaped type results (green line) in the greatest water level of +22.95. These results show that the Stair-Shaped model produces a higher water level in the downstream (Y2) stilling basin than the USBR Type III stilling basin model. The water level downstream can help to reduce the energy that occurs due to turbulence in the stilling basin [28-31]. So that the flow velocity can be dampened and the characteristics change from supercritical flow to sub-critical flow.
3.5 Validation of experimental and analytical model results of classical USBR theory
In this subchapter, we will verify the USBR Type III model and the Stair-Shaped model from the experimental results against the theoretical calculations of the stilling basin taken from the Engineering Monograph (EM) 25 "Hydraulic Design of Stilling Basins and Energy Dissipators" [49], which became the initial reference for the design of the USBR Type III tilling basin.
3.6 Comparison of experimental and theoretical models
The comparison results of the USBR Type III experimental model, the Stair-Shaped experimental model, and the Theoretical Analysis can be seen in Figures 27-29. The validation parameters between the experimental model (USBR Type III, Stair-Shaped model) and the theoretical model used are discharge, energy dissipation ratio, efficiency, and velocity. The relationship of discharge parameters to dissipation energy, discharge to efficiency, and discharge to velocity is shown in Figures 27-29. The trend graph produced by the experimental model, both the USBR Type III model and the Stair-Shaped model, have similarities with the graph produced by theoretical calculations using the formula produced by Peterka's experiment in 1958.
Figure 27. Comparison chart of discharge and ΔE/E1 for experimental and theoretical models
Figure 28. Comparison chart of discharge and efficiency for experimental and theoretical models
Figure 29. Comparison chart of discharge and velocity for experimental and theoretical models
Figure 22 shows that the energy dissipation ratio graph of the Stair-Shaped model is in the uppermost layer, so it can be concluded that the Stair-Shaped model produces the highest energy dissipation ratio value. With a high energy dissipation ratio value, the stilling basin's energy dissipation performance was the best. These results prove that with the ladder model, the collisions produced by the steps can reduce the flow energy, and the characteristics change to subcritical flow characteristics. Cavitation phenomena can also be avoided because the steps can gradually carry out the momentum of collisions between water particles. If this model is applied, the danger of erosion downstream of the stilling basin and river banks can be avoided.
3.7 Prototype-scale implementation
The model scale approach to the implementation scale can be done with the hydraulic stepping length (Lj) approach. The hydraulic stepping length formula (Lj) in this research is based on previous research by Elevatorski, Simoes, Riegel, and Beebe, Douma. The results show that the Step Stair model is close to the hydraulic springing condition based on the formula developed by Elevatorski (Figure 30), with a skewness value of 7%. Therefore, the hydraulic springing formula for the two stair models can be developed from Elevatorski's model. The formula development can be written as follows:
Elevatorski Pond:
Lj = 6.90 (Y2-Y1)
Stair-Shaped Pool Formula Development:
Lj = 6.37 (Y2-Y1)
The hydraulic stepping length (Lj) approach can be used to accomplish the model scale approach to scale implementation. The hydraulic stepping length formula (Lj) used in this study is derived from prior studies conducted by Elevatorski, Simoes, Riegel and Beebe, and Douma. The findings indicate that the Step Stair model closely approximates the hydraulic springing state as determined by the formula devised by Elevatorski (Figure 30), with a skewness value of 7%. Thus, the formula for hydraulic springing for the two stair models may be derived from Elevatorski's model. The formulation development can be expressed as follows:
The coefficient formula for calculating the length of the Elevatorski Stilling Basin is Lj=6.90 multiplied by the difference between the Y-coordinates of points Y2 and Y1. Development of the formula for a stilling basin with a stair-shaped:
The equation Lj=6.37 (Y2-Y1) represents the relationship between the length Lj and the difference in the y-coordinates Y2 and Y1.
Figure 30. Comparison of ratio y2/y1 and length of hydraulic jump (Lj) from several theoretical designs versus experimental results
Table 5 shows that the hydraulic jump will be compared based on experimental results and the formula to validate the development of the Stair-Shaped Formula. It can be seen that the coefficient of determination (R2) value for the staircase type is 96.65%; this value is close to R2 = 1, so the regression model can explain the variability in the data, as shown in Figure 31. From these results, it can be concluded that the stair-formed swim pond model development is close to accurate, and it is possible to implement it in dam construction. However, there are limitations to the study in that there are pump power limitations, and it has not been able to model the sediment content in the stream.
Table 5. Comparison of length of hydraulic jump (lj) between experimental result and stair-shaped formula development
|
Length of Jump Stair Shape (cm) |
|
|
Experimental |
Formula |
|
68.894 |
77.601 |
|
73.642 |
78.960 |
|
80.087 |
85.302 |
|
83.734 |
88.090 |
|
87.876 |
91.397 |
|
92.481 |
95.326 |
|
102.824 |
101.274 |
|
111.654 |
101.232 |
|
116.175 |
103.743 |
|
122.701 |
109.515 |
Figure 31. Comparison of length of hydraulic jump (Lj) between experimental result and stair-shaped formula development
The test results on the hydraulic performance and effectiveness of the USBR Type III stilling basin and the Stair-Shaped lead to the following conclusion:
1. The dissipation ratio generated by the Stair-Shaped model is more efficient in lowering flow energy than the USBR Type III model. The USBR Type III has an average energy dissipation ratio of 78.99%. The energy dissipation ratio produced by the Stair-Shaped model is 81.59%. It can be concluded that using a stair-shaped model can increase the energy dissipation ratio by 2.6%.
2. The efficiency generated by the stair-shape type model surpasses that of the USBR Type III model. The USBR Type III has an average efficiency of 21.01%, whereas the Stair-Shaped type has an efficiency of 18.41%, resulting in a 2.6% increase. Applying this model can increase efficiency by 2.6% from the USBR Type III model.
3. The velocity of the Stair-Shaped type is lower than that of the USBR Type III variant. The velocity range in the USBR Type III model is 19.17 m/s to 29.80 m/s; however, in the Stair-Shaped type, it is 17.42 m/s to 28.14 m/s. so it can be concluded that with this stair-shaped model, the resulting flow velocity is lower, which can reduce the risk of scouring or scouring in the stilling basin due to high velocity.
4. The highest water level elevation in the USBR Type III ranges +18.58. The highest stair-shaped type of water level is +22.95. Typically, the Stair-Shaped type results in a greater water level. It can be concluded that this stair-shaped model produces a higher water level downstream of the stilling basin than the USBR Type III. This can dissipate flow energy. Hence, the performance of the stair-shaped stilling basin energy dissipator is better than the USBR Type III model.
Based on the results of this study, researchers in the field of hydraulics who are interested in further study are advised to:
1. Channel slopes with larger discharges must be further studied to produce a more optimal data series.
2. The use of measuring instrument instrumentation for sensor water flow measurements so that more accurate readings are produced.
3. Sediment modeling must be added to be more realistic by existing conditions.
4. If this stair-shaped model is developed, it is necessary to conduct a study related to the topographic and geological conditions at the location where the stair-shaped type stilling basin model will be built.
The authors thank the Ministry of Education, Culture, Research and Technology (Higher Education Financing Center-BPPT) and the Institute of Educational Fund Management (LPDP) for supporting this research.
[1] Aditya, R.F., Wahono, E.P., Tugiono, S. (2021). Analisis perbandingan pola aliran pada bangunan pelimpah ogee dan stepped dengan model fisik 2D. Jurnal Rekayasa Sipil dan Desain, 9(1): 41-50.
[2] Pamungkas, E.J.W. (2014). Analisis gerusan di hilir bendung tipe USBR-IV. Jurnal Teknik Sipil dan Lingkungan, 2(3): 389-396.
[3] Qin, F., Tao, G., Liu, W., Wu, C., Qi, L., Li, J. (2020). Comparative study on energy dissipation numerical simulation of different energy dissipators in wide and narrow alternated channels. In IOP Conference Series: Earth and Environmental Science, 526(1): 012109. https://doi.org/10.1088/1755-1315/526/1/012109
[4] Bantacut, A.Y., Azmeri, A., Jemi, F.Z., Ziana, Z., Muslem, M. (2022). An experiment of energy dissipation on USBR IV stilling basin–Alternative in modification. Journal of Water and Land Development, 53: 68-72. https://doi.org/10.24425/jwld.2022.140781
[5] Daneshfaraz, R., Abbaszadeh, H., Aminvash, E. (2022). Theoretical and numerical analysis of applicability of elliptical cross-section on energy dissipation of hydraulic jump. Türk Hidrolik Dergisi, 6(2): 22-35.
[6] Jayant, H.K., Jhamnani, B. (2023). Numerical simulation of free and submerged hydraulic jump over trapezoidal and triangular macroroughness. Heliyon, 9(11): e22540. https://doi.org/10.1016/j.heliyon.2023.e22540
[7] Li, S., Li, Q., Yang, J. (2019). CFD modelling of a stepped spillway with various step layouts. Mathematical Problems in Engineering, 2019(1): 6215739. https://doi.org/10.1155/2019/6215739
[8] Prasetyorini, L., Priyantoro, D. (2015). Penggunaan stilling basin tipe bremen modifikasi pada pelimpah bendungan tugu di kabupaten trenggalek. Jurnal Teknik Pengairan: Journal of Water Resources Engineering, 6(1): 116-124.
[9] Babaali, H., Shamsai, A., Vosoughifar, H. (2015). Computational modeling of the hydraulic jump in the stilling basin with convergence walls using CFD codes. Arabian Journal for Science and Engineering, 40: 381-395. https://doi.org/10.1007/s13369-014-1466-z
[10] Mansoori, A., Erfanian, S., Moghadam, F.K. (2017). A study of the conditions of energy dissipation in stepped spillways with Λ-shaped step using FLOW-3D. Civil Engineering Journal, 3(10): 856. https://doi.org/10.28991/cej-030920
[11] Rohmanto, H., Sawito, K., Siregar, H. (2021). Analisis pola aliran saluran terbuka dengan hambatan persegi panjang, bulat, segitiga, dan wing. In Seminar Nasional Ketekniksipilan, Infrastruktur dan Industri Jasa Konstruksi (KIIJK), 1(1): 357-365.
[12] Valero, D., Bung, D., Crookston, B.M., Matos, J. (2016). Numerical investigation of USBR type III stilling basin performance downstream of smooth and stepped spillways. In 6th International Symposium on Hydraulic Structures: Hydraulic Structures and Water System Management, pp. 635-646. https://doi.org/10.15142/T340628160853
[13] Ulfiana, D. (2018). Studi Efektivitas pola pemasangan baffled block pada peredam energi dalam mereduksi energi aliran. Unpublished Master’s Thesis , Surabaya: Institut Teknologi Sepuluh Nopember.
[14] Zulfan, J. (2017). Hydraulic optimization for mitigating local scour downstream of weir (Case study: Rengrang Weir, West Java). Jurnal Teknik Hidraulik, 8(1), 15-28.
[15] Noverdo, R., Dermawan, V., Sisinggih, D. (2021). Studi eksperimen kehilangan energi pada sistem pelimpah dengan kemiringan 1: 1 akibat penurunan dasar kolam olak. Jurnal Teknologi dan Rekayasa Sumber Daya Air, 1(1): 229-237. https://doi.org/10.21776/ub.jtresda.2021.001.01.20
[16] Hager, W.H. (1992). Energy dissipators and hydraulic jump. Zurich, Switzerland: Kluwer Academic. https://doi.org/10.1017/S002211209321062X
[17] Bahmanpouri, F., Gualtieri, C., Chanson, H. (2023). Experiments on two-phase flow in hydraulic jump on pebbled rough bed: Part 2–Bubble clustering. Water Science and Engineering, 16(4): 369-380. https://doi.org/10.1016/j.wse.2023.05.003
[18] Ibrahim, M.M., Refaie, M.A., Ibraheem, A.M. (2022). Flow characteristics downstream stepped back weir with bed water jets. Ain Shams Engineering Journal, 13(2): 101558. https://doi.org/10.1016/j.asej.2021.08.003
[19] Elnikhely, E.A., Fathy, I. (2020). Prediction of scour downstream of triangular labyrinth weirs. Alexandria Engineering Journal, 59(2): 1037-1047. https://doi.org/10.1016/j.aej.2020.03.025
[20] Vayghan, V.H., Mohammadi, M., Ranjbar, A. (2019). Experimental study of the rooster tail jump and end sill in horseshoe spillways. Civil Engineering Journal, 5(4): 871-880. https://doi.org/10.28991/cej-2019-03091295
[21] Tiwari, H.L., Goel, A. (2014). Effect of end sill in the performance of stilling basin models. American Journal of Civil Engineering and Architecture, 2(2): 60-63. https://doi.org/10.12691/ajcea-2-2-1
[22] Bradley, J.N., Peterka, A.J. (1957). Hydraulic design of stilling basins: Hydraulic jumps on a horizontal apron (Basin I). Journal of the Hydraulics Division, 83(5): 1401-1. https://doi.org/10.1061/jyceaj.0000126
[23] Hager, W.H. (2013). Energy dissipators and hydraulic jump (Vol. 8). Springer Science & Business Media. https://doi.org/10.1007/9789401580489
[24] Chanson, H., Brattberg, T. (2000). Experimental study of the air-water shear flow in a hydraulic jump. International Journal of Multiphase Flow, 26(4): 583-607. https://doi.org/10.1016/S0301-9322(99)00016-6
[25] Barjastehmaleki, S. (2015). Spillway stilling basins and plunge pools. Trieste, Italy: Universit`a degli Studi di Trieste.
[26] Riki Chandra Wijaya, R. (2022). Analisis pola hidraulik peredaman energi pada kolam olak tipe vlughter di hilir pelimpah bertangga dengan model fisik 2D. JRSDD, 10(1): 039-052.
[27] Budinetro, H.S., Abdurrosyid, J., Praja, T.A., Rahayu, S. (2010). A spillway structure with stilling basin type solid roller bucket and baffle block at Embung Wonosari. Dinamika TEKNIK SIPIL, 10(3): 285.
[28] Gebhardt, M., Pfrommer, U., Rudolph, T., Thorenz, C. (2018). Numerical and physical study on the energy dissipation at inflatable gates. In 7th IAHR International Symposium on Hydraulic Structures, pp. 174-183. https://doi.org/10.15142/T3JD26
[29] Hassanpour, N., Hosseinzadeh Dalir, A., Bayon, A., Abdollahpour, M. (2020). Pressure fluctuations in the spatial hydraulic jump in stilling basins with different expansion ratio. Water, 13(1): 60. https://doi.org/10.3390/w13010060
[30] Soori, S., Babaali, H., Soori, N. (2017). An optimal design of the inlet and outlet obstacles at USBR II Stilling Basin. International Journal of Science and Engineering Applications, 6(5): 134–142. https://doi.org/10.7753/ijsea0606.1001
[31] Bhate, R.R., Bhajantri, M.R., Bhosekar, V.V. (2021). Mitigating cavitation on high head orifice spillways. ISH Journal of Hydraulic Engineering, 27(3): 235-243. https://doi.org/10.1080/09715010.2018.1547990
[32] Krisnayanti, D.S., Dermawan, V., Solichin, M., Suhardjono, S., Khaerudin, D.N. (2016). Bendung bertangga sebagai alternatif pada perencanaan bangunan irigasi. Jurnal Irigasi, 11(2): 91-102. https://www.researchgate.net/publication/340051285
[33] Boes, R.M., Hager, W.H. (2003). Hydraulic design of stepped spillways. Journal of Hydraulic Engineering, 129(9): 671-679. https://doi.org/10.1061/ASCE0733-94292003129:9671
[34] Setiawan, I., Suyanto, S., Solichin, S. (2013). Pengaruh variasi kemiringan pada hulu bendung dan penggunaan kolam olak tipe slotted roller bucket modification terhadap loncatan air dan gerusan setempat. Matriks Teknik Sipil, 1(3).
[35] Frizell, K.W., Frizell, K.H. (2015). Guidelines for hydraulic design of stepped spillways. Hydraulic Laboratory Report HL-2015-06. https://www.researchgate.net/publication/303565276
[36] Schleiss, A.J., Erpicum, S., Matos, J. (2023). Advances in spillway hydraulics: From theory to practice. Water, 15(12): 2161. https://doi.org/10.3390/w15122161
[37] Albank, H.H., Khassaf, S.I. (2023). An experimental investigation of energy dissipation for stepped spillways with different flow conditions. Mathematical Modelling of Engineering Problems, 10(1): 340-346. https://doi.org/10.18280/MMEP.100139
[38] Al-Hadeethi, B., Almawla, A.S., Kamel, A.H., Afan, H. A., Ahmed, A.N. (2024). Numerical modeling of flow pattern with different spillway locations. Mathematical Modelling of Engineering Problems, 11(5): 1219-1226. https://doi.org/10.18280/mmep.110510
[39] Dermawan, V., Prasetyorini, L., Anam, S. (2021). Hydraulic model experiment of energy dissipation on the horizontal and USBR II stilling basin. In IOP Conference Series: Earth and Environmental Science, 930(1): 012029. https://doi.org/10.1088/1755-1315/930/1/012029
[40] Prasetyorini, L., Anwar, N., Wardoyo, W. (2020). A physical hydraulic model test to solve the problem on spillway dam. Geomate Journal, 19(73): 170-176. https://doi.org/10.21660/2020.73.64231
[41] Wüthrich, D., Shi, R., Chanson, H. (2022). Hydraulic jumps with low inflow Froude numbers: Air-water surface patterns and transverse distributions of two-phase flow properties. Environmental Fluid Mechanics, 22(4): 789-818. https://doi.org/10.1007/s10652-022-09854-5
[42] Formentin, S.M., Palma, G., Zanuttigh, B. (2021). Integrated assessment of the hydraulic and structural performance of crown walls on top of smooth berms. Coastal Engineering, 168: 103951. https://doi.org/10.1016/j.coastaleng.2021.103951
[43] Kurniawan, F., Siregar, G.G. (2022). Evaluasi aliran getar dan kavitasi pelimpah bendungan dolok. Siklus: Jurnal Teknik Sipil, 8(1): 37-46. https://doi.org/10.31849/siklus.v8i1.7106
[44] Kurniati, K., Irwansyah, A., Irham, I., Rosalina, R. (2018). Pengaruh pasang surut terhadap profil aliran muara sungai krueng baro. Portal: Jurnal Teknik Sipil, 10(2): 1-6. https://doi.org/10.30811/portal.v10i2.973
[45] Batchelor, G.K. (1956). On steady laminar flow with closed streamlines at large Reynolds number. Journal of Fluid Mechanics, 1(2): 177-190. https://doi.org/10.1017/S0022112056000123
[46] Kim, J., Moin, P., Moser, R. (1987). Turbulence statistics in fully developed channel flow at low Reynolds number. Journal of Fluid Mechanics, 177: 133-166. https://doi.org/10.1017/S0022112087000892
[47] Wei, T., Willmarth, W.W. (1989). Reynolds-number effects on the structure of a turbulent channel flow. Journal of Fluid Mechanics, 204: 57-95. https://doi.org/10.1017/S0022112089001667
[48] Yusuf, M., Djati Wibowo, G. (2013). Pengaruh pelimpah bertangga tipe akar terpotong terhadap panjang loncat air dan kehilangan energi pada kolam olak. International Conference on Infrastructure Development, 1(2008): 197-205.
[49] Peterka, A.J. (1958). Hydraulic Design of Stilling Basins and Energy Dissipators. United States Government Printing Office Washington
[50] Marsudi, S., Lufira, R.D. (2021). Morfologi sungai. Cv. Ae media grafika. https://books.google.co.id/books?id=Qb06EAAAQBAJ
[51] Moran, R., Toledo, M.Á., Peraita, J., Pellegrino, R. (2021). Energy dissipation in stilling basins with side jets from highly convergent chutes. Water, 13(10): 1343. https://doi.org/10.3390/w13101343.2021.13.1343
[52] Rubinato, M., Heyworth, J., Hart, J. (2020). Protecting coastlines from flooding in a changing climate: A preliminary experimental study to investigate a sustainable approach. Water, 12(9): 2471. https://doi.org/10.3390/w12092471
[53] Zaffar, M.W., Haasan, I., Ghumman, A.R. (2023). Performance evaluation of different stilling basins downstream of barrage using FLOW-3D scour models. Hydrology, 10(12): 223. https://doi.org/10.3390/hydrology10120223
[54] Alikhani, A., Behrozi-Rad, R., Fathi-Moghadam, M. (2010). Hydraulic jump in stilling basin with vertical end sill. International Journal of Physical Sciences, 5(1): 25-29.
[55] Fathi-Moghadam, M., Haghighipour, S., Lashkar-Ara, B., Aghtouman, P. (2011). Reduction of stilling basin length with tall end sill. Journal of Hydrodynamics, 23(4): 498-502. https://doi.org/10.1016/S1001-6058(10)60141-2
[56] Padulano, R., Fecarotta, O., Del Giudice, G., Carravetta, A. (2017). Hydraulic design of a USBR Type II stilling basin. Journal of Irrigation and Drainage Engineering, 143(5): 04017001. https://doi.org/10.1061/(asce)ir.1943-4774.0001150
[57] Deng, Z., Guensch, G.R., Richmond, M.C., Weiland, M.A., Carlson, T.J. (2007). Prototype measurements of pressure fluctuations in the Dalles Dam stilling basin. Journal of Hydraulic Research, 45(5): 674-678. https://doi.org/10.1080/00221686.2007.9521803
[58] Torkamanzad, N., Hosseinzadeh Dalir, A., Salmasi, F., Abbaspour, A. (2019). Hydraulic jump below abrupt asymmetric expanding stilling basin on rough bed. Water, 11(9): 1756. https://doi.org/10.3390/w11091756
[59] Jiang, L., Diao, M., Wang, C.A. (2022). Investigation of a negative step effect on stilling basin by using CFD. Entropy, 24(11): 1523. https://doi.org/10.3390/e24111523