Manjusha Deshmukh*![]() | Sujata Bhairnallykar
| Sujata Bhairnallykar![]() | Sheetal Bukkawar
| Sheetal Bukkawar![]() | Ragini Sharma
| Ragini Sharma![]() | Sarita Kale
| Sarita Kale
© 2024 The authors. This article is published by IIETA and is licensed under the CC BY 4.0 license (http://creativecommons.org/licenses/by/4.0/).
OPEN ACCESS
The aim of the attempt is to build a mechanism for objective evaluation of the autonomous nervous system (ANS) for disease diagnosis at an early stage. With the experience of data collection from various control subjects, BARC has identified eight different pulse morphologies. A Peripheral Pulse Analyser (PPA) measures peripheral blood flow. Blood flow was measured in control subjects (100) and patients (100). The morphology of a person's pulse changes throughout time. Pulse morphologies vary according to age, disease, and other parameters. More than 8500 signals from 200 humans were tested. Various pattern-matching and classification techniques are given in this research to detect the existence of specific pulse shapes in obtained PPA signals. Peaks of PPA blood flow patterns are detected, and features are extracted from the sample pattern. Various machine learning (ML) algorithms are used to identify various pulse shapes depending on the parameters of extracted features. We observed that in one PPA signal of the duration of 300 seconds, 3 to 4 defined pulse morphologies out of 8 are available. Every pulse morphology is different from the others. After training, the system was able to detect pulse shapes to assess the ANS of the subject with more than 94% to 97% accuracy. The proposed system will assist the doctor in making a decision quickly based on a few processed parameters rather than assessing several individual parameters at a crucial time. The output of the system is the assessment report of ANS. This is an attempt to replace traditional Ayurvedic pulse examination methos for disease detection.
machine learning, peripheral pulse analyzer, autonomic nervous system, support vector machine, peripheral blood flow
In complex systems like the human body, where mathematical analysis is not possible due to complex geometry, complex or vague operating conditions, unknown physical parameters, etc., the conventional analysis procedures are either not applicable or lack precision. In such situations where uncertainty (a knowledge gap or imperfect knowledge) of one type or another exists, one has to resort to soft computing methods for analysis like artificial neural networks (ANN), genetic algorithms (GA), fuzzy logic, or a blend of these methodologies. ANN is used for analysing many real-life problems like physiological variability for objective evaluation of the autonomic nerve system (ANS) and to study the influence of the disease on the ANS [1]. In the present research, variability analysis is done with statistical, geometric, frequency domain transformation, and non-linear methods. Since ML algorithms are good at pattern recognition, classification, noise filtering, data interpretation, etc., it can give a better diagnostic yield. ML approach can provide an alternative methodology for the assessment of ANS. ML is employed to objectively assess the ANS in the developed system.
1.1 Article highlights
The proposed system streamlines the diagnostic process by providing rapid decision support based on variations in peripheral blood flow in the human body. The output of the system is an assessment report on the autonomic nervous system.
- The work is of clinical significance for the early detection of diseases by evaluating the ANS. The rapid decision making and concise reporting make it a notable advance in the field.
- Similar previously published work used datasets from online sources and recommended the use of real-time datasets. We used real-time collected datasets from patients having diabetes and hypertension as well as from control subjects for the analysis.
1.2 Related works
Previously, various morphological shapes of peripheral arteries were recorded and studied. For clinical diagnosis, no correlation among these patterns has been reported. Long-term follow-ups over the coming years, however, revealed that most of the patients developed myocardial infarction. This suggested the importance of anatomical changes in central blood flow. The morphology of a peripheral pulse changes with time in a particular person as well as from person to person. A closer look at the data revealed that these pulse patterns were classified into eight different morphologies [1].
The Peripheral Pulse Analyser (PPA) designed by BARC to check the central and peripheral activities of human body. The PPA utilizes the impedance plethysmography principle for signal acquisition. The literal meaning of impedance plethysmography is “an indirect evaluation of alterations in blood volume within a specific body region by analysing changes in electrical impedance within that segment” [1]. Researchers confirmed in their proof-of-concept research that their DL-based PPG approach may be set up effectively to detect PAD using basic PPG readings in the hospital vascular department setting with very limited signal pre-conditioning. The distribution of mild-moderate Parkinson's disease (PAD), non-PAD, or major PAD patients were unequal in this proof of concept research. Future research should explore examining individuals from general care rather than specialized vascular facilities [2]. A thorough examination of clinical research reports released between 1990 and 2021 was conducted, concentrating on differences in pulse harmonic properties across different medical disorders and physiological circumstances to identify the patterns and characteristics. According to research, elements such as blood flow and brain activity affect harmonic intensity. It has been observed that connections between physiological conditions and harmonics offer potential for possible clinical applications. However, the procedure was laborious, slow, and subject to error [3]. In research, pulse analyzers designed by BARC are used on successor of diabetes patient as well as those having systemic hypertension. The Pulse Harmonic Analyzer (PHA) application program was developed expressly for this task. PHA analysis revealed sub-harmonic components associated with collective variation in the heart’s rate, pulsed volume, and pulse morphologies, indicating that it has the prospective to develop the preferred approach for real time deviation checking [4]. Initial research exploring barbershop based testing for peripheral artery disease, also known as PAD, in the Black men found a greater prevalence of PAD than expected, as well as low levels of PAD awareness. Considering this, there's a dire need for a lightweight device that can automatically identify PAD [5]. This work presents a unique methodology for estimating carotid to femoral velocity of pulse waves utilising spectrogram representation of peripheral pulse waveform data photoplethysmography (PPG) or blood pressure. The experiment is run on a public database. The results reveal that the three alternative techniques may achieve good performance, with the energy characteristics were outperforming all other models without noise. It is recommended that further verification in genuine human signals be undertaken to overthrow restriction of utilising publicly available information with just a single cardiac cycle [6]. The PPA signal can be acquired by measuring 3 impedances using four electrodes. PPA signal is composed of different patterns of blood flow. Pattern matching is act of comparing patterns of given PPA signal with defined pulse morphology [7]. Various techniques are available for matching patterns [8]. The study proposes a derivative based peak detection approach for identifying peak in pulses that are received from a PPA created at the BARC. The system detects peaks using signal derivatives. The paper compares the suggested algorithm to the Pan-Tompkins algorithm, which is a well-known approach for detecting QRS in ECG signals. This comparative analysis proposes using the Pan-Tompkins algorithm to find peaks in PPA waveforms [9]. The study describes a method for measuring cuff less blood pressure utilizing multimodal characteristics and optimized machine learning methods. By combining pulse wave morphology, demographic data, and pulse arrival time, the authors achieve systolic and diastolic blood pressure estimates that are within a 5 mmHg skew of gold customary. The comparison of multiple ML algorithms reveals substantial variances, highlighting the need for optimization. The study suggests that with further optimization and validation using larger real-world datasets, this approach could pave the way for more reliable and accurate continuous BP estimation in cuffless devices [10]. This study addresses the issue of incorrect diagnosis of Peripheral Artery Disease (PAD) by utilizing ML models to recognize people with and without PAD based on their gait patterns. The study achieves an 89% accuracy with ML models that use Neural Networks or Random Forest methods and include all laboratory-based gait factors [11]. The article describes a ML model that uses a collection of morphological features to evaluate the level of quality of pulsing physiological signal and detect lower quality portions. Several ML algorithm were evaluated on the ARDS data-set, plus the cost sensitive SVM and a group of Decision-Trees beat others [12]. The article describes a novel method for analysing pulse signals that combines time-domain features from the wavelet scatter method with frequency-domain information from an upgraded PNCC method. Using datasets from the MIT-BIH-mimic database, the approach achieves an outstanding 98.3% accuracy in categorising three medical symptom pulse signals [13]. The study [14] presents a brief overview of statistical machine learning and its underlying ideas. This study looks into machine-learning techniques to distinguish between high- and poor-quality pulse waveforms obtained from wearable devices. The study provides insights for improving pulse quality in wearable device usage [15-22].
In the proposed algorithm, we have extracted different features like various amplitudes and time intervals in the peak, and are utilized to discriminate pulse morphology.
2.1 Data acquisition
BARC Mumbai has designed a PPA. M/S. SIMS HEALTHCARE PRIVATE LIMITED purchased and supplied the device, which was calibrated and checked for errors. Patient's permission was obtained in writing and the initiative involved a healthcare professional from MGM Hospital, Navi-Mumbai. PPA generates a PPA signal via the impedance plethysmography method. In impedance plethysmography, data is collected using four electrodes. Four electrodes were attached to the wrist. The PPA contains a sinusoidal oscillator, a voltage-to-current converter, 3 measurement amplifiers, an analogue processor circuit, a low-power microcontroller and a Bluetooth controller that communicates with a personal computer.
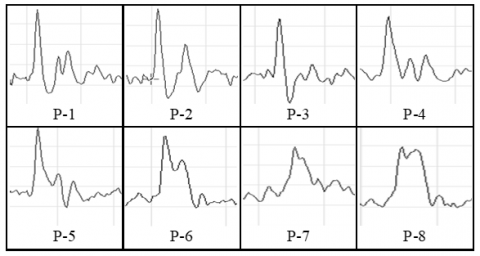
A sinusoidal current with a fixed amplitude (2 mA) is applied to the upper extremities via the support electrodes C1 and C2, which are attached to both the elbow and the palm. The power generated along the current path is recorded at 3 locations on the wrist by sensory electrodes S1_S4, with S1 closer to the elbows and S4 closer to the palms. The distance between electrodes S1-S4 is approximately two centimetres. The voltage fluctuations between S1-S2, S2-S3 and S3-S4 were amplified independently by the measurement amplifier-1 and the measurement amplifier-3. These wrist positions correspond to the Kapha-Pitta-Vata positions defined in the Ayurveda system of medication. The amplified signal is subjected to additional processing to determine the impedance of the segment Z1 - Z3, the temporal variation of the impedance, i.e. the variance between the instantaneous impedance Z(t) and the initial impedance Z0, which is DZ1 - DZ3, and the first temporal derivative of the impedance, which is dZ1/dt - Z3/dt. These parameters represent aspects of body structure, variation in volume of blood and flow of blood within the respective segment. The PPA generates 8 different pulse morphology in different patients. Figure 1 illustrates these different pulse morphologies. Every PPA signal has 2 or 3 repetitions of the pulse morphology, which vary between physically fit and unhealthy individuals. Statistical analysis and artificial neural networks are used to match these pulse morphologies for pattern recognition. Peripheral blood flow data will be collected using a peripheral pulse analyzer from both control subjects (100) and patients (100).
The signal is recorded and saved by activating the “Capture" button and then examined for pulse morphology. The pulse morphology shows temporal variations within an individual. Pulse morphologies exhibit variation based on age, disease and other factors. Within each PPA signal lasting 5 minutes or 300 seconds, typically 3 to 4 distinct pulse morphologies from a defined set of eight can be observed. The repetition of these available pulse morphologies within the PPA signal may vary depending on the health condition of the individual.
Figure 1. Pulse morphologies of PPA
2.2 Method 1: Amplitude interval-based pattern matching algorithm
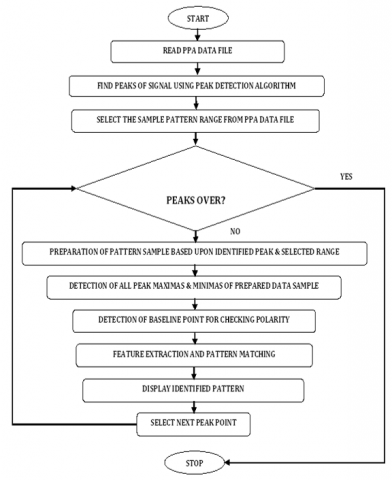
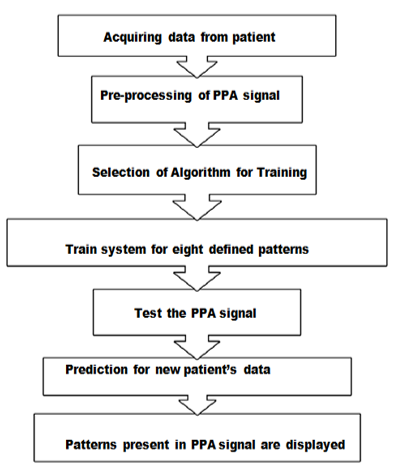
Various parameters extracted from the PPA signal are used to match the predefined eight pulse morphologies. The steps for pattern matching are shown in Figure 2.
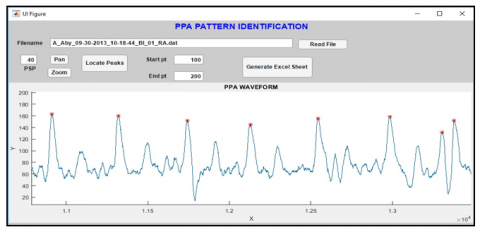
Figure 3 shows GUI (created in MATLAB) to inspect every file & shape and generate an excel sheet that presents various statistical values along of the chosen pattern. By choosing build excel-sheet, the user may create an excel sheet with statistical data for each file and the proportion of each recurring pattern.
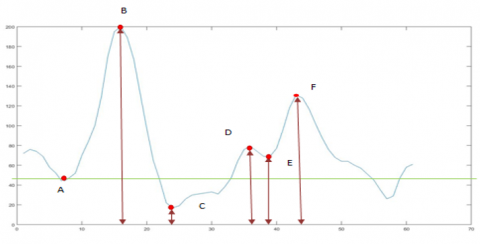
The waveform analysis can be performed by observing waveforms separately. After analysis, it has been observed that different parameters are present in waveforms. The characteristics of waveforms can be derived by using these parameters. Peaks and valleys are observed parameters for PPA waveform analysis. As we can see in Figure 4, pulse morphologies can be differentiated based on the location of peaks and valleys. Criteria for parameters may differ in different waveforms. For pulse morphologies, three peaks and three valleys are identified for analysis purposes.
Figure 2. Flow diagram of amplitude interval based pattern matching algorithm
Figure 3. GUI for PPA pattern identification. Zoom and pan tools can be used to view each peak
Figure 4. Three peaks and valleys introduced in typical pulse morphology
2.2.1 Result of method 1
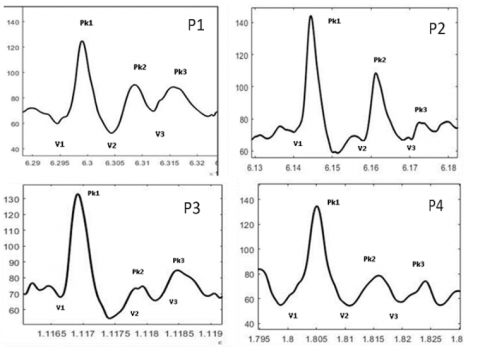
Different points are introduced for understanding purpose of peaks and valleys as shown in Figure 3. Point A, C and E are valleys whereas point B, D and F are peaks for typical pulse morphology. Amplitudes are taken from zero line to introduced peaks and valleys. For point A, B, C, D, E and F amplitudes are A, B, C, D, E and F respectively. Similarly intervals are taken from one point to another as AB, BC, CD, DE, EF intervals. Polarity of C point plays vital role to determine pattern from P1-P4 and P5-P8. Among three valleys, first valley (V1) is considered as a baseline point for all patterns. Second valley is for polarity check.
Figure 5. Waveform of pattern 1 to pattern 8
Pattern 1: Three peaks and three valleys have been identified for pattern 1. The first peak, Pk1, ends below the baseline, and the second peak, Pk2, is multiple and its height is around 50% of the first peak shown in Figure 5 (P1). We can infer that V2 is below the baseline point, and after that, the pattern follows the 'm' shape.
Pattern 2: As we can see in Figure 5 (P2) for pattern 2, First peak (Pk1) ends below the baseline and the height of the second (multiple) peak (Pk2) is around 75% of the first peak (Tallest Peak).
Pattern 3: In Figure 5 (P3), the first peak (Pk1) ends below the baseline. The second peak (Pk2) is a multiple peak, and its height is around 20% of the first peak. It is also the shortest peak among the three peaks
Pattern 4: All peaks end at the base line and the amplitude of all valleys are same in Figure 5 (P4).
Pattern5: The first peak (Pk1) did not finish (i.e. didn’t cross the baseline), there is a slur in the downward slope near the bottom side in Figure 5 (P5).
Pattern 6: In Figure 5 (P6), the first peak (Pk1) did not finish (i.e. didn’t cross the baseline) and there is a slur in the downward slope near the middle side.
Pattern 7: All peaks do not touch the base line and there is more variation in amplitudes of valleys in Figure 5 (P7).
Pattern 8: In Figure 5 (P8), the first peak (Pk1) did not finish (i.e. didn’t cross the baseline) completely and there is a slur in the downward slope near the top side.
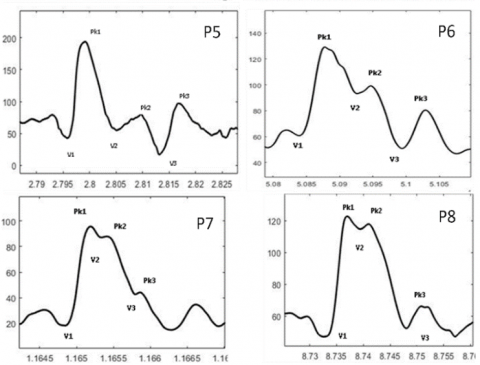
Figure 6 shows screenshot of excel sheet with statistical data for each file and the proportion of each recurring pattern. Column indicates amplitude and intervals. 13th column shows waveform morphology.
Figure 6. Screenshot of excel sheet1 for parameters
Table 1 indicates that in the PPA waveform for the particular subject, 53% of P1 morphology is present. More than 50% availability of P1 morphology within a duration of 300 seconds indicates that the subject is healthy.
Table 1. The percentage of patterns
|
|
|
P0 |
P1 |
P2 |
P3 |
P4 |
P5 |
P6 |
P7 |
P8 |
|
% |
100 |
1 |
53 |
1 |
8 |
31 |
5 |
0 |
0 |
0 |
|
No. of peaks |
272 |
4 |
144 |
3 |
3 |
84 |
13 |
0 |
0 |
0 |
2.3 Method 2: ML on continuous data for pattern matching
The methodology involves using a supervised learning process to train a feed-forward model with three layers - the hidden layer, input layer, and output layer. We utilized the 'trail' training function of MATLAB, which employs Levenberg-Marquardt backpropagation. The backpropagation algorithm compares the expected and actual results and adjusts the weights iteratively until the error reaches its minimum value. To evaluate the model's effectiveness, we calculated the mean square error. The testing phase aims to determine the model's ability to differentiate data into different classes. Memorization testing involves using known data, while generalization testing involves using unknown data. Two input methods are used for pattern matching using ML:
Method 1: Data sample with statistical parameters
Method 2: Data sample without statistical parameters
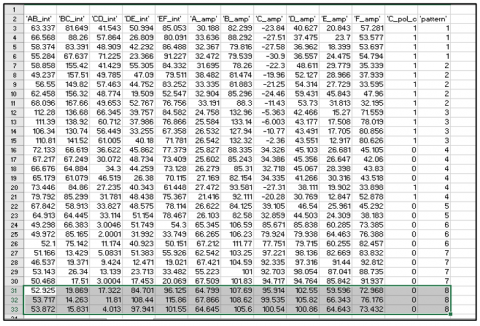
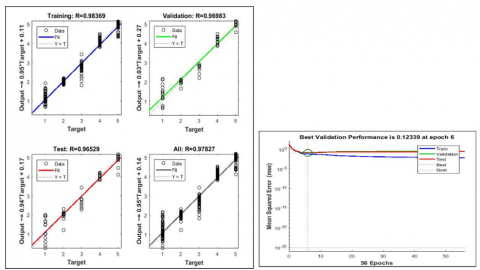
80% of the samples are used for training and 10% for testing for pattern matching. We obtained an accuracy of 96.232% for method 1 and 93.183% for method 2. The results are shown in Figures 7 and 8. The classification uses statistical parameters such as standard deviation, kurtosis, skewness, mean and power spectral density. In addition to the extraction, a comparison of these features is also provided.
Figure 7. Regression and performance with statistical parameters
Figure 8. Regression and performance without statistical parameters
2.3.1 Steps to form a network
·Reading the data as an excel sheet.
·Formation of the network (using a feed-forward network).
·Training the network with supervised learning.
·Simulating the trained data as well as testing it with new.
2.4 Method 3 - SVM using amplitude-interval parameters for pattern matching
Algorithm of SVM is as follows:
·Training data received for eight patterns had 100 rows per pattern.
·This dataset is split into 8:2 ratios for training and testing.
·The SVM method has five kernels named linear, rbf, poly, sigmoid and tahn. It has been seen that the linear kernel provides more accuracy as compared to others.
·A trained model was used for prediction which gave accuracy in the range of 90-95% for various diseases.
·The trained model was then used with data to determine whether the patient had an illness like as diabetes, hypertension, or cardiac.
The flowchart in Figure 9 explains pattern matching using statistical parameters and data signal points fed to the ML. The sample data collected from a PPA device had a duration of five minutes for each patient. This data is in the form of a waveform. A peak identification algorithm based on peak derivation is used to pre-process the signal to produce numerical values. The five-minute waveform contains combinations of eight defined PPA patterns, P1 to P8. First, the algorithm is trained for these eight patterns. The trained system is used to determine the number of pattern repetitions in five minutes. The amplitude and interval parameters are used to identify these patterns. The SVM classifier is used to catalogue the patterns. An accuracy of 90-95% is achieved with the SVM method.
Figure 9. Flow-diagram of SVM methodology for pattern matching
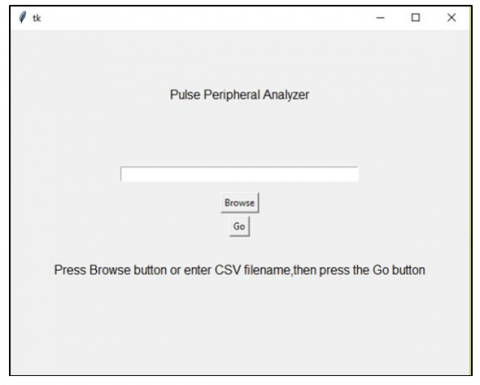
GUI is designed using MATLAB to calculate number of repeated patterns input is excel file containing patient’s data, that is shown in Figure 10.
Figure 10. Window for uploading patient’s data
2.4.1 Results of SVM
SVM make use of support vectors for classification. The pickle method is used for training the model to improve its efficiency. Classification using SVM becomes easy as the dataset is numeric. PPA signal of patients is acquired. Pre-processing of the signal is done using a peak derivative-based peak identification algorithm. The dataset prepared was in the form of numeric values. The attributes used to predict patterns are amplitude and interval. Table 2 presents count of total number of morphologies (P1 to P8) available in PPA waveform in the duration of 300 seconds.
Table 2. Result of SVM, count of total number of patterns
|
1 |
2 |
3 |
4 |
5 |
6 |
7 |
8 |
Total |
|
28 |
0 |
28 |
179 |
36 |
0 |
57 |
0 |
328 |
|
134 |
17 |
15 |
129 |
19 |
1 |
27 |
0 |
342 |
|
146 |
14 |
15 |
145 |
7 |
0 |
20 |
0 |
347 |
|
233 |
49 |
6 |
46 |
4 |
2 |
13 |
1 |
354 |
|
31 |
70 |
1 |
22 |
36 |
12 |
65 |
0 |
237 |
|
41 |
21 |
0 |
11 |
60 |
67 |
118 |
0 |
318 |
|
74 |
28 |
0 |
10 |
40 |
58 |
95 |
1 |
306 |
|
35 |
182 |
3 |
19 |
6 |
2 |
45 |
0 |
292 |
|
36 |
154 |
5 |
13 |
0 |
0 |
0 |
0 |
208 |
|
35 |
179 |
1 |
17 |
0 |
0 |
4 |
0 |
236 |
The data set used for pattern matching is the signal captured by PPA. The data set consisted of a total of 200 healthy and unhealthy subjects, all of which contained predefined pulse morphologies. A total of 10453 morphological data were used. Twelve parameters (columns 1-12) were identified from the prepared data set. These 12 parameters are amplitudes and intervals of the acquired signal after peak detection. For each pattern, each parameter has a specific range. The defined patterns are distinguished by the different values for amplitude and interval. Using the pattern matching criteria, the patterns are matched and displayed in column No. 13 (see Figure 6). In the studies [2, 6, 10, 11], machine learning approaches are used, while in the studies [3, 4, 5, 9, 12], various physiological signal analysis are used. The performance of a deep learning model can be influenced by the content and variety of I/P data. As the study was conducted in a single location, any differences in data from different healthcare facilities or geographical regions may not have been taken into account. To avoid overfitting with only 126 data sets in the study [10], the size of the training set should be at least ten times the number of fitting factors. studies on variability, disease characterization and neural network application are discussed in the studies [1, 7, 8]. The 85% accuracy reported in the study [8] is limited to patterns P-1, P6 and P8 in the collected data set. The performance of the model in new, unseen situations (external validation) is crucial for assessing its generalizability.
There are significant obstacles and restrictions when creating a machine learning method for the quick diagnosis of different diseases using peripheral pulse wave inputs. First and foremost, biases in the dataset or restrictions on data availability might make it more difficult to train models effectively. High-quality and diverse data is essential for this process. Furthermore, selecting and extracting features from peripheral pulse wave data is a complex procedure that demands domain knowledge and has a big influence on model performance. Furthermore, in medical applications, where comprehension of the reasoning behind predictions is critical for clinical acceptability, it is imperative to guarantee the interpretability of complicated machine learning models. To evaluate the model's resilience and generalizability across various patient groups and contexts, it is essential to validate its performance using untested datasets. Collaboration with medical professionals and careful evaluation of workflow integration and usability are required when integrating machine learning models into clinical practice. In the end, such models must be shown to have clinical utility and impact through prospective research and trials in order to be widely adopted and successfully implemented in healthcare settings.
After implementing the proposed pattern-matching algorithm on the acquired PPA signal, we observed that in one PPA signal of the duration of 300 seconds, 3 to 4 defined pulse morphologies out of 8 are available. Subjective analysis of the acquired signal of 300 seconds has been done to match the standard patterns. We have seen that the proposed pattern-matching algorithm, based on various amplitudes and time intervals, can match the patterns with an accuracy of 86% to 95%. The obtained results are satisfactory. In order to fully realize the therapeutic utility and impact of such models, clinical studies and partnerships with healthcare professionals are necessary. Notwithstanding these difficulties, resolving these restrictions may open the door for the application of machine learning methods in clinical settings, eventually leading to better patient outcomes in cardiac care. Overcoming these challenges and realizing the full benefit of machine learning in heart function prediction will require ongoing study, interdisciplinary collaboration, and technical breakthroughs.
All procedures for experiments were approved by the institutional ethics committee, formed under the chairmanship of Head of institute and PI, Dr. Manjusha Deshmukh, (PC) Dr. Vineet Sinha, (CO-PC) Dr. Rajesh Jain, (CI-1) Dr. B P Dubey, (CI-2) Dr. Deshpande, (CI-3) Dr. Bharti Joshi, (CI-4) Deepa Parasar. Protocol was performed in accordance with the relevant guidelines and regulations. This is to check that all processes have been carried out in conformity with the applicable standards and regulations. Subjects provide written informed consent to participate in the study.
We would like to acknowledge BRNS for funding, Mr. Vinit Sinha, Scientific Officer, BARC and Rajesh Jain for their constant support and enthusiasm while performing this experimental work.
[1] Bhat, S., Bhat, K.S., D'sa, S., Roopa. Variability studies and disease characterization. In a Handbook on Physiological Variability Advanced Applications of Physiological Variability (AAPV-2010). Electronics Division BARC, pp. 98-102.
[2] Allen, J., Liu, H., Iqbal, S., Zheng, D., Stansby, G. (2021). Deep learning-based photoplethysmography classification for peripheral arterial disease detection: A proof-of-concept study. Physiological Measurement, 42(5): 054002. https://doi.org/10.1088/1361-6579/abf9f3
[3] Hsiao, K.Y., Kang, J.H., Wu, Y.S., Chang, H.H., Yang, C.T. (2023). Peripheral pulse harmonic analysis and its clinical application: A systematic review. Journal of Traditional and Complementary Medicine, 14(2): 223-236. https://doi.org/10.1016/j.jtcme.2023.11.006
[4] Jindal, G.D., Jain, R.K., Bhat, S.N., Pande, J.A., Sawant, M.S., Jindal, S.K., Deshpande, A.K. (2017). Harmonic analysis of peripheral pulse for screening subjects at high risk of diabetes. Journal of Medical Engineering & Technology, 41(6): 437-443. https://doi.org/10.1080/03091902.2017.1323968
[5] White Solaru, K.T., Coy, T., DeLozier, S., Brinza, E., Ravenell, J., Longenecker, C.T., WrightJr, J.T., Gornik, H.L. (2022). Findings of a novel barbershop-based peripheral artery disease screening program for black men. Journal of the American Heart Association, 11(20): e026347. https://doi.org/10.1161/JAHA.122.026347
[6] Vargas, J.M., Bahloul, M.A., Laleg-Kirati, T.M. (2023). A learning-based image processing approach for pulse wave velocity estimation using spectrogram from peripheral pulse wave signals: An in silico study. Frontiers in Physiology, 14: 1100570. https://doi.org/10.3389/fphys.2023.1100570
[7] Yadav, R., Deshmukh, M., Jain, R.K. (2018). Detecting the patterns of coronary artery disease and hypertension using artificial neural network. International Journal of Applied Engineering Research, 13(16): 12843-12845.
[8] Manjusha, D., Rakeshkumar, Y. (2018). A literature survey of the methods of assessment of autonomic nervous system using neural networks. International Journal of Computer Networks and Wireless Communications (IJCNWC), 8: 99-102. https://www.ijcnwc.org/papers/vol8no32018/17vol8no3.pdf.
[9] Deshmukh, M., Jain, R.K., Parashar, D., Jaiswal, S. (2018). Derivative-based peak detection algorithm for PPA waveforms. In 2018 IEEE International Conference on Computational Intelligence and Computing Research (ICCIC), Madurai, India, pp. 1-4. https://doi.org/10.1109/ICCIC.2018.8782379
[10] Kasbekar, R.S., Ji, S., Clancy, E.A., Goel, A. (2023). Optimizing the input feature sets and machine learning algorithms for reliable and accurate estimation of continuous, cuffless blood pressure. Scientific Reports, 13(1): 7750. https://doi.org/10.1038/s41598-023-34677-9
[11] Al-Ramini, A., Hassan, M., Fallahtafti, F., Takallou, M. A., Rahman, H., Qolomany, B., Pipinos, I.I., Alsaleem, F., Myers, S.A. (2022). Machine learning-based peripheral artery disease identification using laboratory-based gait data. Sensors, 22(19): 7432. https://doi.org/10.3390/s22197432
[12] Sabeti, E., Reamaroon, N., Mathis, M., Gryak, J., Sjoding, M., Najarian, K. (2019). Signal quality measure for pulsatile physiological signals using morphological features: Applications in reliability measure for pulse oximetry. Informatics in Medicine Unlocked, 16: 100222. https://doi.org/10.1016/j.imu.2019.100222
[13] Chen, H., Guo, C., Wang, Z., Wang, J. (2022). Research on recognition and classification of pulse signal features based on EPNCC. Scientific Reports, 12(1): 6731. https://doi.org/10.1038/s41598-022-10808-6
[14] Torres-Torriti, M., Calderara Cea, F. (2023). Statistical machine learning. In: Zhang, Q. (eds) Encyclopedia of Smart Agriculture Technologies. https://doi.org/10.1007/978-3-030-89123-7_227-1
[15] Ouyoung, T., Weng, W.L., Hu, T.Y., Lee, C.C., Wu, L.W., Hsiu, H. (2022). Machine-learning classification of pulse waveform quality. Sensors, 22(22): 8607. https://doi.org/10.3390/s22228607
[16] Wang, S., Wu, D., Li, G., Song, X., Qiao, A., Li, R., Liu, Y., Anzai, H., Liu, H. (2022). A machine learning strategy for fast prediction of cardiac function based on peripheral pulse wave. Computer Methods and Programs in Biomedicine, 216: 106664. https://doi.org/10.1016/j.cmpb.2022.106664
[17] Huttunen, J.M., Kärkkäinen, L., Lindholm, H. (2019). Pulse transit time estimation of aortic pulse wave velocity and blood pressure using machine learning and simulated training data. PLoS Computational Biology, 15(8): e1007259. https://doi.org/10.1371/journal.pcbi.1007259
[18] Wang, T., Jin, W., Liang, F., Alastruey, J. (2021). Machine learning-based pulse wave analysis for early detection of abdominal aortic aneurysms using in silico pulse waves. Symmetry, 13(5): 804. https://doi.org/10.3390/sym13050804
[19] Shahrbabak, S.M., Kim, S., Youn, B.D., Cheng, H.M., Chen, C.H., Mukkamala, R., Hahn, J.O. (2024). Peripheral artery disease diagnosis based on deep learning-enabled analysis of non-invasive arterial pulse waveforms. Computers in Biology and Medicine, 168: 107813. https://doi.org/10.1016/j.compbiomed.2023.107813
[20] Garcia-Carretero, R., Vigil-Medina, L., Barquero-Perez, O., Ramos-Lopez, J. (2020). Pulse wave velocity and machine learning to predict cardiovascular outcomes in prediabetic and diabetic populations. Journal of Medical Systems, 44(1): 16. https://doi.org/10.1007/s10916-019-1479-y
[21] Xiao, M.X., Lu, C.H., Ta, N., Wei, H.C., Haryadi, B., Wu, H.T. (2021). Machine learning prediction of future peripheral neuropathy in type 2 diabetics with percussion entropy and body mass indices. Biocybernetics and Biomedical Engineering, 41(3): 1140-1149. https://doi.org/10.1016/j.bbe.2021.08.001
[22] Gao, J.M., Ren, Z.H., Pan, X., Chen, Y.X., Zhu, W., Li, W., Yang, Y.X., Fu, G.X. (2022). Identifying peripheral arterial disease in the elderly patients using machine-learning algorithms. Aging Clinical and Experimental Research, 1-7. https://doi.org/10.1007/s40520-021-01985-x