OPEN ACCESS
This paper discusses about ELD Problem is modeled by non-convex functions. These are problem are not solvable using a convex optimization technique. So there is a need for using a heuristic method. Among such methods Teaching and Learning Based Optimization (TLBO) is a newly known algorithm and showed promising results. This paper utilized this algorithm to provide load dispatch solutions. Comparisons of this solution with other standard algorithms like Particle Swarm Optimization (PSO), Differential Evolution (DE) and Harmony Search Algorithm (HSA). This projected algorithm is implemented to resolve the ELD problem for 6 unit and 10 unit test systems along with the other algorithms. This comparison investigation explored various merits of TLBO with respect to PSO, DE, and HSA in the field economic load dispatch.
valve point loading effects, non-convex, T & L based optimization, PSO, DE, HSA, economic dispatch
As a Power Engineer scheduling the generators is very big Problem. Since from the past so many techniques are in practice for the economic load dispatch. Economic load dispatch means optimal allocation of loads to the generators so as to maintain power supply must be equal to load demand also to decrease the losses and fuel cost (Wood and Wollenberg, 1996). We are all know that power generation is highly costlier. In countries like India the major power generation is form thermal power plants only where the running cost is very high. The one of the best way to minimize the cost and losses of generating station is to Economic dispatch of loads (Amjady and Nasiri-Rad, 2010; Pothiya et al., 2011; Walters and Sheble, 1993). Researchers developed lot of methods for Economic load dispatch. In this work concentrates on an innovative optimization algorithm that is teaching and learning based optimization.
Electrical power plays vital role for any county development. For achieving proper load demand we should have the optimal power flow generation to reduce the cost of production and this can be achieved by economic load dispatch with proper integration of sources to the load centres. The principal goal of Economic Load Dispatch (ELD) is to build effective power flow path while compromising all constraints. The cost function of every alternator can be characterized with quadratic function and it can solve by minimization methods like Lambda iteration and gradient based methods in convention ELD problem (Mahor et al., 2009; Elaiw and Xia, 2010; Chakrabory et al., 2011).
Anciently we developed many methods to clear up the ELD problem like mathematical programming methods and these are more delicate for start and occasionally converge to local optimum solution or diverge altogether. Linear programming approaches are quick and effective however main bad thing is correlated with the piecewise linear cost. Nonlinear programming approaches have a struggle of convergence and algorithmic trouble. Newton based approaches cannot handle many number of equality constraints (Sharifzadeh and Amijady, 2010; Wang, 2013).
This paper explains TLBO algorithm to resolve ELD problem with valve point loading effect of thermal plants by taking transmission losses in to account. We proposed the effectiveness of T&L based Optimization on 6 unit test system and compared with PSO, DE, HSA. Finally T & L based optimization technique gives the high quality solution.
Economic load dispatch means minimizing the fuel cost, balanced Real power, and satisfying real power demand. The ELD problem is shown below (Thanushkodi and Selvakumar, 2007).
$FC({{P}_{i}})=\sum\limits_{i=1}^{N}{{{F}_{i}}}({{P}_{i}})$ (1)
Here, FC(Pi) = overall fuel cost,
N = Total number of thermal generating unit,
Pi = Power generation of
thermal generating unitThe fuel cost is quadratic function so it is,
${{F}_{i}}({{P}_{i}})={{a}_{i}}P_{gi}^{2}+{{b}_{i}}{{P}_{gi}}+{{c}_{i}}$ (2)
Subjected to $\sum\limits_{i=1}^{n}{{{P}_{i}}={{P}_{D}}+{{P}_{L}}}$ (3)
${{P}_{i,\min }}\le {{P}_{i}}\le {{P}_{i,\max }}$ (4)
Here ai,bi,ci are fuel cost coefficients of the ith thermal generating unit,
Pi = Total true power generation of ith unit
PD = overall load demand,
PL = overall transmission line loss,
Pi,min = The minimum generation limit of unit i and
Pi,max = The maximum generation limits of unit i.
2.1. Economic dispatch problem with valve-point loading effect
Here the combination of quadratic and sinusoidal functions of fuel cost to represent the valve-point loading effects. It follows as (Noman and Iba, 2008; Coelho and Mariani, 2009; Zou et al., 2016; Rao et al., 2011)
${{F}_{i}}({{P}_{i}})={{a}_{i}}+{{b}_{i}}{{P}_{i}}+{{c}_{i}}P_{i}^{2}+\left| {{e}_{i}}*\sin ({{f}_{i}}*(P_{i}^{\min }-{{P}_{i}})) \right|$ (5)
Here ei and fi are coefficient of the generating units reflecting valve-point loading effects.
The transmission line losses are written as
${{P}_{L}}=\sum\limits_{i=1}^{n}{\sum\limits_{j=1}^{n}{{{P}_{i}}{{B}_{ij}}{{P}_{j}}+\sum\limits_{i=1}^{n}{{{P}_{i}}{{B}_{0i}}+{{B}_{00}}}}}$ (6)
Here Bij, B0i and B00 are transmission line loss coefficients.
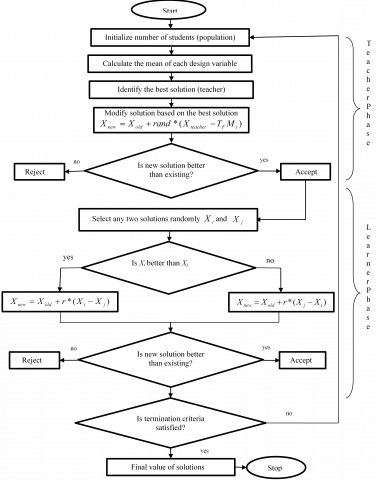
Teaching and Learning (T&L) inspired optimization process proposed by Rao et al. (2011) and Rao and Patel (2013) depends on Teacher and Learner Mechanism. The Teaching and Learning (T&L) based optimization is a meta-heuristic population based search algorithm like HSA, Ant Colony Optimization (ACO), PSO and Artificial Bee Colony (ABC). The Teaching and Learning (T&L) based optimization method is a simple mathematical model to resolve different optimization difficulties.
The projected work concentrates on a new optimization algorithm that is teaching and Learning (T&L) based optimization. Incorporated T&L based optimization algorithm is effective remedy for diminishing the flaws in traditional approach like provincial optimal trapping, inadequate effective to identify adjacent risky points and inefficient appliance to analyzing the constraints. According to our T&L based optimization algorithm a learner can gains knowledge in two ways: (i) by teacher and (ii) interacting with the neighbor learners. In this algorithm beginners are called as population. Design variable are called as subjects of the learners. The top beginner is treated as Teacher.
3.1. Teacher phase
Pupil gains information from the instructor ever and instructor should expand the mean outcome of class by his skills. The best learner is that once knowledge is equal to the teachers knowledge means teacher make to learners to reach his knowledge. But practically is not possible because all learners are not cleverer. This follows as (Kyruakides and Ciornei, 2012)
Let Mi= Mean
Ti = Teacher at any iteration i.
Ti Makes the mean Mito move towards its own knowledge level, therefore Ti
chosen as Mnew. Hence the best learner is treated as teacher. The variance of the current mean result of every subject and the matching result of the teacher for every subject is given by,$Difference=r*({{M}_{new}}-{{T}_{F}}{{M}_{i}})$ (7)
Where TF= Teaching factor. It is given as follows:
${{T}_{F}}=round[1+rand*(0,1)*(2-1)]$ (8)
This difference modifies the existing solution according to the following expression
${{X}_{new,i}}={{X}_{old,i}}+difference$ (9)
3.2. Learner phase
The input for the beginner phase is the teacher in beginner phase learner gains knowledge learner gains knowledge by two ways: one is gaining knowledge form teacher and other is by sharing knowledge between learners interaction.
The learner phase is shows as follows. Randomly select two learners and where i≠j
${{X}_{new,i}}={{X}_{old,i}}+r*({{X}_{i}}-{{X}_{j}})$ if $f({{X}_{i}})<f({{X}_{j}})$
${{X}_{new,i}}={{X}_{old,i}}+r*({{X}_{j}}-{{X}_{i}})$ if $f({{X}_{i}})>f({{X}_{j}})$ (10)
Figure 1. Flow Chart of T & L based optimization algorithm
There are several algorithms like PSO, HSA, ABC, GA. The proposed the effectiveness of T&L based Optimization on 6 unit test system and compared with PSO, DE, HSA. Finally, T & L based optimization technique gives the high quality solution.
The Proposed T & L based Optimization algorithm was implemented for two cases case: 1 consisting 6-Baseload generation units preferring loading valve point loading effect and losses. The T & L based optimization algorithm was written using MATLAB 8.5 (R2018b) running on i5 processor, 2.56GHz, 8GB RAM, PC.
A. Case 1
This case contains 6-base load generation units considering loading valve point loading effect and losses. Generating units have to attain the load demand of 1263MW. To calculate the efficiency of the T & L based optimization method, 25 individual trails can made at 60-population with 200 iterations.
Table 1. Global generations for 6unit system per trail
|
Number of units |
Global generations in MW |
|||
|
PSO |
HSA |
DE |
TLBO |
|
|
1 |
400.6115 |
399.4068 |
500 |
500 |
|
2 |
199.5996 |
200 |
149.9957 |
151.4009 |
|
3 |
232.1225 |
232.0630 |
230.3581 |
300 |
|
4 |
124.7998 |
125.2627 |
125.8899 |
87.7215 |
|
5 |
199.5996 |
200 |
149.9629 |
149.4573 |
|
6 |
120 |
120 |
120 |
88.4572 |
|
Min.cost ($/h) |
15616.7991 |
15624.4473 |
15615.6937 |
15611.6988 |
|
Power loss (MW) |
13.7331 |
13.5483 |
13.2068 |
14.0371 |
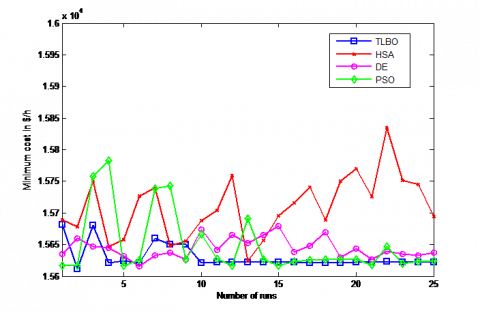
The comparisons of cost and global are tabulated in Table 1 and Table 2. The global generations and the independent trails convergence characteristics are also plotted which are shown in fig. 2 and 3 respectively.
Table 1 clearly shows that for PSO the minimum cost attained was 15616.7991 \$/h, for HSA the minimum cost attained was 15624.4473 \$/h, for DE the minimum cost attained was 15615.6937\$/h, and for TLBO the minimum cost attained was 15611.6988. Hence the above results shows that, the minimum cost is attained for TLBO as compared with the other algorithms. The power loss attained for TLBO was 14.0371MW.
Figure 2. Convergence characteristics of 6 unit system
Table 2. Minimum cost obtained for 25 runs
|
Number of runs |
Minimum cost in $/h |
|||
|
PSO |
HSA |
DE |
TLBO |
|
|
1 |
15616.8546 |
15688.4303 |
15635.2652 |
15681.9111 |
|
2 |
15616.8756 |
15677.7093 |
15660.2286 |
15611.6988 |
|
3 |
15758.1765 |
15750.0689 |
15646.7544 |
15680.6254 |
|
4 |
15782.4748 |
15647.0857 |
15645.1185 |
15621.5284 |
|
5 |
15616.8511 |
15657.9900 |
15631.8830 |
15624.2276 |
|
6 |
15625.1855 |
15726.5923 |
15615.6937 |
15621.4526 |
|
7 |
15738.7735 |
15739.6564 |
15632.6176 |
15659.3512 |
|
8 |
15743.2094 |
15647.9531 |
15636.6707 |
15650.3453 |
|
9 |
15626.6348 |
15655.4437 |
15626.5942 |
15650.3141 |
|
10 |
15665.8478 |
15688.3176 |
15673.4684 |
15621.5109 |
|
11 |
15627.0714 |
15703.6266 |
15641.7270 |
15622.5178 |
|
12 |
15616.7991 |
15759.3145 |
15665.2332 |
15621.6119 |
|
13 |
15691.2273 |
15624.4473 |
15652.6820 |
15622.4532 |
|
14 |
15626.6205 |
15656.2226 |
15665.7099 |
15622.1312 |
|
15 |
15616.9367 |
15695.9180 |
15679.2265 |
15621.6684 |
|
16 |
15623.5040 |
15715.6528 |
15638.6161 |
15621.6008 |
|
17 |
15625.1855 |
15740.7103 |
15648.2682 |
15621.5467 |
|
18 |
15626.5741 |
15688.7322 |
15670.0528 |
15621.3824 |
|
19 |
15626.7418 |
15750.1998 |
15629.4167 |
15620.9401 |
|
20 |
15626.7085 |
15769.2848 |
15643.9360 |
15621.6385 |
|
21 |
15618.0267 |
15725.9458 |
15626.4920 |
15622.2550 |
|
22 |
15647.0017 |
15834.2254 |
15639.1709 |
15622.9964 |
|
23 |
15619.6076 |
15751.9471 |
15635.1169 |
15621.7541 |
|
24 |
15623.5005 |
15744.5482 |
15633.0052 |
15622.5070 |
|
25 |
15624.3020 |
15694.8515 |
15637.5919 |
15621.6983 |
|
Min. cost ($/h) |
15616.7991 |
15624.4473 |
15615.6937 |
15611.6988 |
|
Max. cost ($/h) |
15782.4748 |
15834.2254 |
15679.2265 |
15681.9111 |
|
Avg. cost ($/h) |
15649.2276 |
15709.3950 |
15644.4216 |
15630.0667 |
Figure 3. Comparison characteristics of minimum cost Obtainedfor 25 runs
This case consists of ten thermal generation units considering loading valve point loading effect and losses. Generating units have to attain the load demand of 2000 MW. To calculate the efficiency of the T & L based optimization method, 25 individual trails can ready at 100-population with 200 iterations per trail.
The comparisons of cost and global are tabulated in Table 3 and Table 4. The global generations and the independent trails convergence characteristics are also plotted which are shown in fig 4 and 5 respectively.
B. Case 2
Table 3. Global generations for 10unit system
|
Number of units |
Global generation in MW |
|||
|
PSO |
HSA |
DE |
TLBO |
|
|
1 |
55 |
50.8495 |
55 |
55 |
|
2 |
80 |
75.8420 |
78.7733 |
80 |
|
3 |
107.3388 |
115.8420 |
99.3983 |
106.9392 |
|
4 |
100.3117 |
94.02348 |
107.1068 |
100.5765 |
|
5 |
81.4700 |
109.7019 |
89.0972 |
81.5012 |
|
6 |
82.9208 |
95.2030 |
81.4078 |
83.0217 |
|
7 |
300 |
295.8420 |
296.1400 |
300 |
|
8 |
340 |
335.8420 |
340 |
340 |
|
9 |
470 |
465.8420 |
470 |
470 |
|
10 |
470 |
446.8475 |
470 |
470 |
|
Min.cost ($/h) |
111497.6596 |
111907.4666 |
111537.6219 |
111497.6301 |
|
Power loss (MW) |
87.0414 |
85.8360 |
86.9237 |
87.0387 |
Figure 4. Convergence characteristics of 10-unit system
Table 3 shows that for PSO the minimum cost attained was 111497.6596\$/h, for HSA the minimum cost attained was 111907.4666\$/h, for DE the minimum cost attained was 111537.6219\$/h, and for TLBO the minimum cost attained was 111497.630. Hence the above results shows that, the minimum cost is attained for TLBO as compared with the other algorithms. The power loss attained for TLBO was 87.0387MW.
Table 4. Minimum cost values for 25 runs
|
Number of runs |
Minimum cost in $/h |
|||
|
PSO |
HSA |
DE |
TLBO |
|
|
1 |
111641.4441 |
111959.2697 |
111569.1983 |
111500.9854 |
|
2 |
111525.8322 |
112694.2246 |
111673.5325 |
111505.7236 |
|
3 |
111497.6763 |
111947.6861 |
111695.2852 |
111497.6765 |
|
4 |
111521.5108 |
112047.7053 |
111567.3306 |
111521.7364 |
|
5 |
111525.8275 |
112302.8949 |
111742.5223 |
111525.7565 |
|
6 |
111525.6877 |
112206.2944 |
111743.0718 |
111521.5768 |
|
7 |
111525.7571 |
112052.4801 |
111670.3818 |
111502.6754 |
|
8 |
111525.7976 |
112071.9085 |
111705.6591 |
111505.8768 |
|
9 |
111525.8834 |
111947.8623 |
111751.1809 |
111497.6301 |
|
10 |
111497.7631 |
111987.3196 |
111648.195 |
111497.6764 |
|
11 |
111497.6695 |
111919.8793 |
111645.2498 |
111497.6765 |
|
12 |
111497.7148 |
112337.6419 |
111601.2568 |
111497.6987 |
|
13 |
111497.6784 |
112250.1165 |
111689.5033 |
111497.6877 |
|
14 |
111525.7557 |
112185.1190 |
111663.6215 |
111500.6301 |
|
15 |
111497.8285 |
112235.6711 |
111679.4047 |
111504.6375 |
|
16 |
111497.7403 |
112094.2826 |
111654.574 |
111525.6384 |
|
17 |
111525.6996 |
112026.1773 |
111629.5029 |
111518.6311 |
|
18 |
111525.7043 |
112125.7557 |
111537.6219 |
111499.6343 |
|
19 |
111525.5897 |
112010.5037 |
111706.3123 |
111497.6301 |
|
20 |
111525.8344 |
112131.3220 |
111714.4087 |
111497.6301 |
|
21 |
111525.7345 |
112421.2877 |
111551.2658 |
111497.6301 |
|
22 |
111525.7724 |
112461.9869 |
111675.4585 |
111499.6383 |
|
23 |
111497.6596 |
112385.1277 |
111707.5187 |
111499.6376 |
|
24 |
111525.71 |
112111.6850 |
111608.6125 |
111497.6301 |
|
25 |
111497.7123 |
111907.4666 |
111652.1783 |
111497.6301 |
|
Min cost($/h) |
111497.6596 |
111907.4666 |
111537.6219 |
111497.6301 |
|
Max. cost($/h) |
111641.4441 |
112694.2246 |
111751.1809 |
111525.7565 |
|
Avg.cost($/h) |
111520.1193 |
112152.8667 |
111659.3138 |
111504.2789 |
Figure 5. Comparison features of minimum cost obtained for 25 runs
Hence form the above results we can conclude that Incorporated T & L based optimization algorithm is Effective remedy for diminishing the flaws in traditional approach like provincial optimal trapping, inadequate effective to identify adjacent extreme points and inefficient mechanism to analyzing the constraints. The proposed T&L based optimization on 6 unit test system, 10 unit test system compared with PSO, DE, HSA. Finally TL based optimization technique gives the Effective high quality solution for Economic load dispatch problem.
Amjady N., Nasiri-Rad H. (2010). Solution of nonconvex and nonsmooth economic dispatch by a new Adaptive Real Coded Genetic Algorithm. Expert Systems with Applications, Vol. 37, pp. 5239-5245. https://doi.org/10.1016/j.eswa.2009.12.084
Banerjee S., Maity D., Chanda C. K. (2015). Teaching learning based optimization for economic load dispatch problem considering valve point loading effect. Electrical Power and Energy Systems, Vol. 73, pp. 456-464. https://doi.org/10.1016/j.ijepes.2015.05.036
Chakraborty S., Senjyu T., Yona A., Saber A. Y., Funabashi T. (2011). Solving economic load dispatch problem with valve-point effects using a hybrid quantum mechanics inspired particle swarm optimization. IET Generation Transmission and Distribution, Vol. 5, No. 10, pp. 1042-1052. https://doi.org/10.1049/iet-gtd.2011.0038
Coelho L., Mariani V. C. (2009). An improved harmony search algorithm for power economic load dispatch. Energy Conversion and Management, Vol. 50, pp. 2522-2526. https://doi.org/10.1016/j.enconman.2009.05.034
Elaiw A. M., Xia X. (2010). Optimal dynamic economic dispatch of generation: A review. Electric Power Systems Research, Vol. 80, pp. 975-986. https://doi.org/10.1016/j.epsr.2009.12.012
Genco A., Viggiano A., Magi V. (2018). How to enhance the energy efficiency of HVAC systems. Mathematical Modelling of Engineering Problems, Vol. 5, No. 3, pp. 153-160. https://doi.org/10.18280/mmep.050304
Kyriakides E., Ciornei I. (2012). A GA-API Solution for the economic dispatch of generation in power system operation. IEEE Transactions on Power Systems, Vol. 27, No. 1, pp. 233-242. https://doi.org/10.1109/TPWRS.2012.2236481
Mahor A., Prasad V., Rangnekar S. (2009). Economic dispatch using particle swarm optimization: A review. Renewable and Sustainable Energy Reviews, Vol. 13, No. 8, pp. 2134-2141. https://doi.org/10.1016/j.rser.2009.03.007
Noman N., Iba H. (2008). Differential evolution for economic load dispatch problems. Electric Power System Research, Vol. 78, pp. 1322-1331. https://doi.org/10.1016/j.epsr.2007.11.007
Patel R. V., Rao V. (2013). An improved teaching-learning-based optimization algorithm for solving unconstrained optimization problems. Scientia Iranica D, Vol. 20, pp. 710-720. https://doi.org/10.1016/j.scient.2012.12.005
Pothiya S., Ngamroo I., Sa-ngiamvibool W. (2011). Multiple tabu search algorithm for economic dispatch problem considering valve-point effects. Electrical Power and Energy Systems, Vol. 33, pp. 846-854. https://doi.org/10.1016/j.ijepes.2010.11.011
Rao R. V., Savsani V. J., Vakharia D. P. (2011). Teaching–learning-based optimization: A novel method for constrained mechanical design optimization problems. Computer-Aided Design, Vol. 43, pp. 303-315. https://doi.org/10.1016/j.cad.2010.12.015
Sharifzadeh H., Amjady N. (2010). Solution of non-convex economic dispatch problem considering valve loading effect by a new modified differential evolution algorithm. Electrical Power and Energy Systems, Vol. 32, pp. 893-903. https://doi.org/10.1016/j.ijepes.2010.01.023
Thanushkodi K., Selvakumar A. I. (2007). A new particle swarm optimization solution to nonconvex economic dispatch problem. IEEE Trans. Power Systems, Vol. 22, No. 1, pp. 42-51. https://doi.org/10.1109/TPWRS.2006.889132
Vakharia D. P., Savsani V. J., Rao R. V. (2012). Teaching–learning-based optimization: An optimization method for continuous non-linear large scale problems. Information Sciences, Vol. 183, pp. 1-15. https://doi.org/10.1016/j.ins.2011.08.006
Walters D. C., Sheble G. B. (1993). Genetic algorithm solution of economic dispatch with valve point loading. IEEE Transactions on Power Systems, Vol. 8, No. 3, pp. 1325-1332. https://doi.org/ 10.1109/59.260861
Wang L. (2013). An effective differential harmony search algorithm for the solving non-convex economic load dispatch problems. Electrical Power and Energy Systems, Vol. 44, pp. 832-843. https://doi.org/10.1016/j.ijepes.2012.08.021
Wood A. J., Wollenberg B. F. (1996). Power Generation, Operation, and Control. Second Edition.
Zou D., Li S., Wang G. G., Li Z., Ouyang H. B. (2016). An improved differential evolution algorithm for the economic load dispatch problems with or without valve-point effects. Applied Energy, Vol. 181, pp. 375-390. https://doi.org/10.1016/j.enconman.2009.05.034