OPEN ACCESS
This work aims to study the phenomenon of harmonic pollution. It presents an analysis that has been performed through a simulation model containing a rectifier (as a polluting load) to supply a DC motor from a three-phase voltage source. For this purpose, a hardware-in-the-loop simulation method is developed under Simulink/Matlab environment. The validation of the simulation results is carried out through an experimental realization of the same simulated model, for which, a Fluke 435 II instrument is used to measure the rate of the total harmonic distortion (THD) with an oscilloscope to visualize the curves. The filtering process is performed under Simulink/Matlab environment. The simulated part is connected to the realized part via a DSPACE DS1104 card, used to convert the incoming analog signal to a digital one for processing under Simulink/Matlab, and then, to convert it back to an analog signal again in order to visualize it within the oscilloscope. The efficiency of the passive filters in reducing the effects of harmonics has been well recognized as part of this study. In addition to the advantage of using rapid prototyping as well as the hardware-in-tghhe-loop simulation that contribute to the improvement of the time and cost simultaneously. The results of this study could be used to enhance the quality of the energy by maintaining the sinusoidal form of the supply voltage signal for a good transmission of the useful power to the terminal equipment.
interference, pollution harmonique, simulation, prototypage rapide, DSP
The growing use of computer equipment and power electronics in the electrical networks contributes to the degradation of the supply voltage quality. In fact, receivers such as asynchronous motors and transformers participate in the distortion of the sinusoidal voltage waveform. Nowadays, the power electronics are almost present in many electrical engineering equipment that contributes essentially to the proliferation of electrical disturbances (Félice and Révilla, 2009; Lacroix and Marty, 2008). The electrical network supplies the so-called deforming loads, or else called nonlinear receivers, which call on the electrical network deformed currents that are in function of the network impedance. When the amplitude of these currents is important, they modify the shape of the sinusoidal voltage waveform.
Increasingly, the disturbances related to harmonic pollution are present in the installations and become a real problem for the users and the producers of electricity, and this whatever the sector of industrial or tertiary activity (Félice and Révilla, 2009; Haouy, 2010).
Harmonics have been addressed in many works in the field of electrical engineering without introducing the EMC study. This has prompted us to treat it in this context with a new approach where rapid prototyping and the Hardware-in-the-Loop simulation are used. This study present a simulation method characterized by the association of real components connected to a simulated real-time part.
1.1. This work is organized as follows
After presenting, in the first part, the general notions of the harmonic pollution, and before getting into the simulation part as a third part, the different approaches used in this work are presented such as rapid prototyping and the real-time simulation, followed by the description of the tools used.
The simulated model contains a rectifier (polluting load) that supply a DC motor through a three-phase voltage source under Simulink/Matlab. The results of this simulation are validated by the experimental part where the simulated assembly is realized using a three-phase voltage source, a rectifier and a DC motor. For the THD measurements, the instrument Fluke 435 II has been used with an oscilloscope to visualize the curves. The filtering is performed under Simulink/Matlab as a fourth part.
Finally, an interpretation of the results obtained is given, followed by a conclusion.
The harmonics come mainly from the non-linear loads with the characteristic of absorbing a current that does not have the same waveform as the voltage feeding them. This current is rich of harmonic components whose spectrum will depend on the nature of the load. These harmonic currents flowing through the network impedances and create harmonic.
Figure 1. Degradation of the voltage quality of the electrical network by a non-linear load (Ferracci, 2001)
2.1. Main harmonic generators
The generation of harmonic currents over the power supply networks is due to numerous types of equipment, for which we can draw up a non-exhaustive list that are found in the following equipment’s: the electronic starters, the speed variators and frequency converters, inverters, switching power supplies, discharge lamps, computers, televisions, etc.
2.2. Harmonics definition
The deformed signals give rise to a variation of the original signal, which is then composed of:
– A fundamental,
– A certain number of sinusoids of different frequencies and amplitudes called superior harmonics.
The sum of these sinusoidal signals of different frequencies and amplitudes, thus, constitutes the deformed signal despite being periodic.
The harmonic signals are multiples of the sector voltage ‘50 Hz’ fundamental frequency (Félice and Révilla, 2009; Parc, 1998; Mohan et al., 2007).
2.3. Consequences of harmonic pollution
The harmonic pollution causes instantaneous, medium and long-term effects on the power distribution electrical networks. For example: the effects into the neutral conductor where the harmonic currents of rank 3 (i.e., the fundamental x 3 or 150 Hz) from the 3 phases will add themselves. These being in phase, they give rise to a circulation of an IN current in the neutral conductor.
2.3.1. For other effects, we can group them as follows:
– Increase of Joule and skin effects losses as well as the additional losses for the high frequencies;
– Increase of the electrical energy billing;
– Degradation of the power factor relative to the installation;
– Premature aging of equipment connected to the electrical circuit by reducing their service life (e.g.: neutral cable);
– Frequent dysfunctions;
– Destruction of certain materials (capacitors for example) (Félice and Révilla, 2009; Collombet et al., 2009; Ignatova, 2006).
Before presenting the simulation part, the different steps used in this work are given as follows:
3.1. Rapid prototyping
Rapid prototyping brings together a set of tools that, arranged between them, make it possible to achieve objects with intermediate representation of product design: numerical models (in the geometric sense of the model), mock-ups, prototypes and pre-series. These models contribute to validate the various functions that the product must fulfill (sign, use, exchange and producibility functions).
Rapid prototyping integrates three essential notions: time, cost and complexity of the forms. Its main objective is the manufacturing of a physical model (mock-up, prototype and tools) in a very short time, at a lower cost and with the minimum of tools and intermediate steps in the realization process (Dubois, 2000).
3.2. Simulation of the material in a loop
The "Hardware-in-the-Loop" is a simulation method characterized by the association of real components connected in a part to a real-time simulation. Usually, hardware and software control systems are identical to those used for serial production. The process to be controlled could be composed of either simulated or real elements. In general, the mixture of both of them is realized.
3.3. DSPACE card
The real-time monitoring of continuous systems is realized using a PC connected to the DSPACE DS1104 card. The programming is performed through the Simulink modeling tool, which helps to present the problem in a graphical way using the interconnected blocks. In fact, many DSP-based real-time development systems are actually used with a Simulink interface. Therefore, Simulink blocks could be converted into a machine code that can be run on a DSP-based system. Consequently, the development and prototyping time for the system control is significantly reduced.
Prototyping then goes through three stages: (Darkawi, 2015)
- Construction of the control system using Simulink blocks.
- Simulation of the system in order to explore the results in different scenarios.
- Running the model in a real-time through the DS1104 card.
3.4. DSP processor
A DSP (Digital Signal Processor) is a special type of processors, characterized by the integration of a set of special functions which are intended to make it particularly efficient in the field of digital signal processing.
DSPs are specifically designed to perform a large number of complex arithmetic calculations as quick as possible, usually, in applications such as image processing, speech recognition and telecommunications. DSPs are more efficient than general-use processors whose aim to perform basic arithmetic operations, especially multiplication. They are founded in devices that require fast data processing.
4.1. Simulation of a filter less rectifier
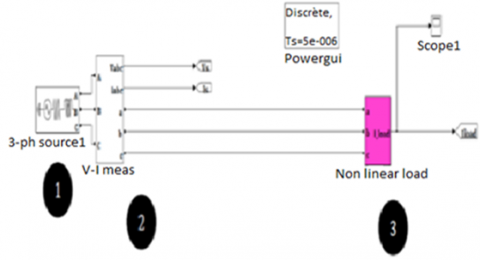
In order to clearly visualize the harmonic pollution in the power supply networks, we have taken an example of a rectifier (as a polluting load) which supplies a DC motor through a three-phase voltage source. Figure 2 illustrates the simulated assembly.
Figure 2. Simulation setup realized via Simulink
With:
1- Three-phase voltage source: 400 V - 50 Hz.
2- Measurement card to measure the current.
3- Non-linear load (rectifier).
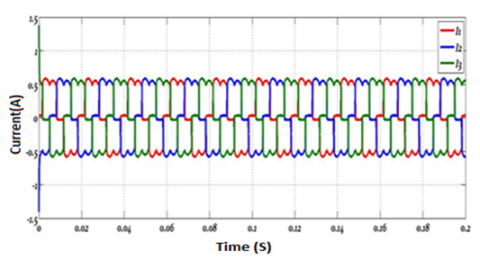
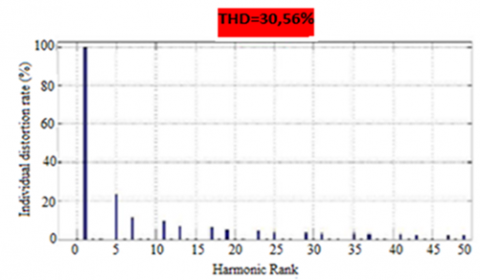
The simulation results obtained are shown in Figures 3 and 4 which represent respectively the three-phase currents and the frequency spectrum of current I.
Figure 3. Representation of the three-phase currents
Figure 4. Frequency spectrum of current I
From Figures 3 and 4 as well as Table 1, the harmonic pollution is noticeable, this is because the THD is important and equal to 30.56 %.
Then, we will propose the use of a passive filter as a solution to eliminate the most dominant harmonics.
Table 1. Measurements of individual distortion rates given by the FFT analysis function (integrated in simulink/matlab)
|
Rang |
1 |
3 |
5 |
7 |
9 |
11 |
13 |
15 |
|
ζ (%) |
100 |
0.03 |
22.68 |
11.11 |
0.03 |
9.08 |
6.31 |
0.03 |
|
Rang |
17 |
19 |
21 |
23 |
25 |
27 |
29 |
31 |
|
ζ (%) |
5.66 |
4.37 |
0.03 |
4.1 |
3.33 |
0.03 |
3.21 |
2.69 |
4.2. Simulation of a rectifier with addition of a filter
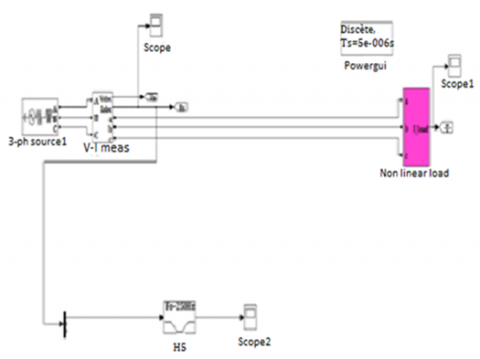
By taking into account the case of elimination of harmonic 5 only, a passive filter is added with a cutoff frequency equal to that of harmonic 5 (250 Hz). Figure 5 illustrates the simulated assembly.
Figures 6 and 7 as well as Table 2 present the simulation results.
The filter used has the capability to eliminate the harmonic 5 and decrease the amplitude of harmonic 7, the THD is reduced to a value of 16.97%.
Then, in the same way, the results illustrated in figures 8, 9 and Table 3 are obtained by adding successive filters according to the harmonic rank, from rank 7 up to 13, plus a low pass filter starting from the harmonic 15.
Figure 5. Simulation setup with a passive filter added to eliminate H 5
Figure 6. Single-phase current representation by adding the filter
Figure 7. Frequency spectrum of the current measured by adding the filter
Table 2. Measurements of the individual distortion rates given by the FFT analysis function (integrated in simulink/matlab)
|
Rang |
1 |
3 |
5 |
7 |
9 |
11 |
13 |
15 |
|
ζ (%) |
100 |
0.02 |
0.09 |
5.14 |
0.02 |
7.41 |
5.59 |
0.02 |
|
Rang |
17 |
19 |
21 |
23 |
25 |
27 |
29 |
31 |
|
ζ (%) |
5.41 |
4.26 |
0.03 |
4.1 |
3.35 |
0.03 |
3.27 |
2.75 |
When processing the harmonics away from the fundamental frequency, a low-pass filter is used. This, by definition is a filter that allows the low frequencies to pass and attenuates the high frequencies, i.e., the frequencies higher than the cutoff frequency. Indeed, this level cannot be close to the fundamental in order to avoid the decrease of the amplitude of the fundamental frequency and as consequence, affecting the active power of the system.
Figure 8. Single-phase current after adding different filters
Figure 9. Frequency spectrum of current obtained by adding different filters
Table 3. Measurements of individual distortion rates given by the FFT analysis function (integrated in simulink)
|
Rang |
1 |
3 |
5 |
7 |
9 |
11 |
13 |
15 |
|
ζ (%) |
100 |
0.01 |
0.00 |
0.00 |
0.00 |
0.00 |
0.00 |
0.00 |
|
Rang |
17 |
19 |
21 |
23 |
25 |
27 |
29 |
31 |
|
ζ (%) |
0.58 |
0.66 |
0.00 |
0.81 |
0.67 |
0.01 |
0.61 |
0.49 |
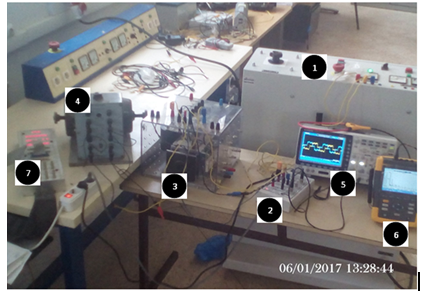
The validation of the results obtained previously requires the experimental realization of the simulated assembly, by using a three-phase voltage source, a rectifier and a DC motor. Regarding the THD measurements, the instrument (Fluke 435II) and an oscilloscope have been used to visualize the different waveforms. The filtering process is performed through the Simulink/Matlab environment. Figure 10 shows the experimental setup realized for this study.
Figure 10. The experimental setup realized
With:
1- Three-phase voltage source: 400 V-50 Hz.
2- Measurements card.
3- Rectifier.
4- DC motor.
5- Oscilloscope.
6- Fluke 435 II.
7- DSPACE card.
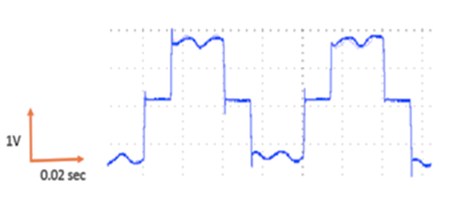
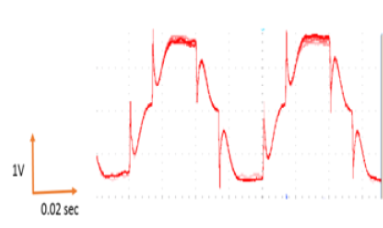
By feeding the rectifier, the DC motor turns and the distorted current is displayed on the oscilloscope (Figure 11).
Figure 11. Representation of the current displayed by the oscilloscope
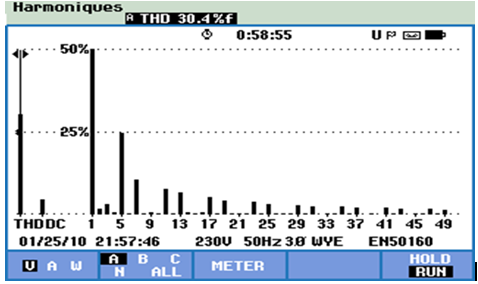
The fluke instrument displays the FFT of the current and the THD measurement (Figure 12).
The high THD is justified by the presence of the harmonics. For each harmonic, the same filtering block has been used such as in the simulation part.
Figure 12. Frequency spectrum displayed by the fluke
A block is added in order to convert the incoming analog signal to a digital signal for processing under Simulink/Matlab. Then, a second block is inserted in order to convert the filtered signal to an analog signal again. Figures 13 and 14 show the results of the fifth harmonic filtering.
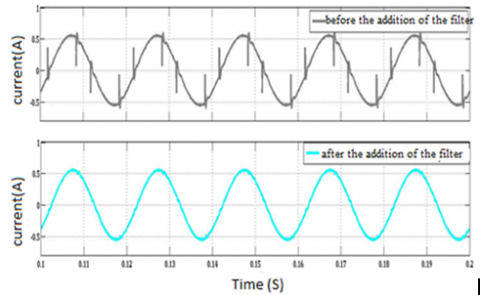
Figure 13. Representation of the current after the elimination of the harmonic 5
Figure 14. Frequency spectrum of the current after the elimination of the harmonic 5
The results presented in figures 15 and 16 are obtained with the same use of filtering of the harmonic 7 up to 13, plus a low pass filter. The use of passive filters for each harmonic helps to eliminate the most dominant harmonics. This elimination reduces the THD value to 3.9 %: according to the IEEE standard, (IEEE Std, 1993; Thomas et al., 2005) this value is acceptable. The experimental results are almost identical to those of simulation part but they are more closer to the real.
Figure 15. Representation of the filtered current
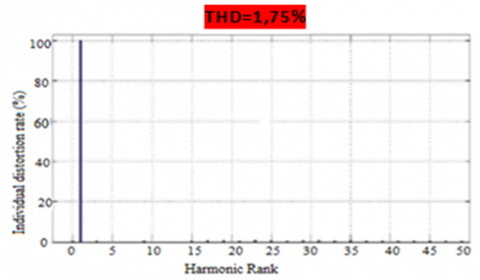
Figure 16. Frequency spectrum of the current after the elimination of all harmonics
The numerical simulation as well as the experimental realization parts deal with a solution of the harmonic pollution problem. We choose the passive filter as a method to reduce the harmonic pollution because of its simplicity to study and to simulate. Therefore, in this study, the rapid prototyping is presented, which is a computer-controlled manufacturing method, and then, the material simulation in the loop was defined by a simulation type characterized by the association of real components connected in part to a real-time simulation. The experimentally realized part (the voltage source, rectifier and the DC motor) is related to the simulated part (the filter) through a DSPACE card. the DSP microprocessor converts the analog signal coming from the oscilloscope to a digital signal for processing under simulink/matlab, and then re-convert it to an analog signal again for visualization through the oscilloscope.
Beauvois V. (2008). Qualité de la tension et qualité de l’électricité. ATT 00254 Novembre.
Carnovale D. J., Dionise T. J., Blooming T. M. (2003). Price and performance considerations for harmonic solutions. Power Systems World, Power Quality 2003 Conference, Long Beach, California. http://www.er-emergency.com/wp-content/uploads/2012/05/Harmonic-Solutions-PQ-2003-Carnovale.pdf
Collombet C., Lupin J. M., Schonek J. (1999). Perturbations harmoniques dans les réseaux pollués et leur traitement. Schneider Electric Cahier technique, No. 152.
Darkawi A. (2015). Initiation au système DSPACE, de l’interface RTI dans Simulink et de Control Desk Next Generation 5.4 version 2.0, support de cours, Poly Tech Nantes. Département Génie Électrique, No. 1.
Dubois P., Aoussat A., Duchamp B. (2000). Prototypage rapide, généralités.
Félice É., Révilla P. (2009). Qualité des réseaux électriques et efficacité énergétique. Préface d’Antoine de Fleurieu, Vol. 10, p. 197.
Ferracci P. (2001). La qualité de l’énergie électrique. Cahier technique de Schneider, No. 199, pp. 2-32.
Haouy C. (2010). Harmonique et relèvement d’un facteur de puissance. BTS électrotechnique.
IEEE Recommended Practices and Requirements for Harmonic Control in Electric Power Systems. © Institute of Electrical and Electronics Engineers, Inc. 1993.
Ignatova V. (2006). Méthodes d’analyse de la qualité de l’énergie électrique. Application aux creux de tension et à la pollution harmonique, thèse de doctorat. Université de Josephe Fourier, le 20 Octobre 2006.
Mohan P. R., Kumar V. M., Raghava Reddy O. V. (2007). A novel topology of emi filter to suppress common mode and differential mode noises of electro magnetic interference in switching power supplie. ARPN Journal of Engineering and Applied Sciences, Vol. 2, No. 4. https://doi.org/10.1049/ic:20070650
Parc J. D. (1998). Correction de la puissance réactive et des harmoniques, Réseaux industriels. Techniques de l’Ingénieur, traité Génie électrique. 1998.
Prévé C., Jeannot R. (1997). Guide de conception des réseaux électriques industriels, No.6.
Thomas M., Blooming P.E., Daniel J., Carnovale P. E. (2005). Application of IEEE STD 519-1992 Harmonic Limits. Presented at the 2005 IEEE Ias Pulp and Paper Industry Conference in Appleton.
Walter L., Patrick M. (2008). Pollution harmonique et compatibilité électromagnétique. B.E.P, métiers de l’électrotechnique.