Rachida Hedara* | Said Nemmich
© 2022 IIETA. This article is published by IIETA and is licensed under the CC BY 4.0 license (http://creativecommons.org/licenses/by/4.0/).
OPEN ACCESS
The dielectric barrier discharge (DBD) is a more efficient medium of ozone production, which requires voltages of the order of several kV and frequencies of a few tens of kHz. The principal objective of this study is to model and optimize a cylindrical-shaped ozone generator with a surface DBD that will be used in a water treatment plant. By playing on the electrical parameters (voltage, oxygen flow) and geometric parameters (the nature and diameter of the dielectric, the length of the electrode), to achieve high ozone efficiency and minimum energy consumption. It is recommended to use cylindrical surface discharge reactors with reduced diameter and electrode length and with the smallest possible oxygen circulation interval to achieve satisfactory ozone concentrations, with reduced power consumption.
ozone generators, DBD generator, surface discharge, experimental design, response surface modeling
Significant research effort has been made in this area to carry out water treatment, new, high-performance techniques have emerged from scientific researchers in diverse domains (chemistry, physics and electronics), increasingly interested in the identification and elimination of polluting elements. Efficient generation of ozone by cold atmospheric plasmas is interesting for sterilization and decontamination of thermally-sensitive surfaces [1].
Processes (physical, chemical, electro-technical and electronic, etc.) have been widely studied to eliminate dyes polluting wastewater at high concentrations, plasmas among these treatments to have pure water is the treatment of water with ozone which is generated by DBD dielectric barrier discharge, such a discharge occurs between two metal electrodes separated by one or more thicknesses of dielectric material and a gas space where the discharge occurs [2-4].
The production of ozone O3 is made from air or O2. Initially, an oxygen atom is dissociated in collisions between high-energy electrons and oxygen molecules. Alongside the radicals combine with free molecules O2 and form O3. These processes are described conceptualized in Figure 1 [5].
Figure 1. Schematic diagram of formation of ozone by electron impact
$e+O_{2} \rightarrow O+O+e$ (1)
$2 \mathrm{O}_{2}+\mathrm{O} \rightleftharpoons \mathrm{O}_{3}+\mathrm{O}_{2}$ (2)
Ozone concentration in nature varies between 0.01 ppm to 0.05 ppm, depending on geographic location and season. The concentration of ozone increases with increasing area of electrode and decrease with increasing flow gas rate and gap space [6]. In addition, ozone concentrations increased with increasing AC high-voltage amplitude and with increasing residence time [7].
The idea is to produce surface DBD ozone in order to compare the different configurations in terms of ozone concentration and energy efficiency.
Over and above, the work consists of experimentally optimizing these types of surfaces DBD by indicating the results of each dielectric barrier discharge realized.
Among the different designs of ozone generator, we have chosen a configuration that is most often used in industry, namely a cylindrical shape. This cylindrical shape has the advantage of offering a larger discharge surface compared to flat and pointed shapes; therefore, it allows to generate a higher ozone yield.
Obtained results showed that although the majority of ozone generators are of cylindrical surface discharge type, the cylindrical surface DBD presents significant superiority in terms of ozone generation and energy efficiency [8].
Types of surface-mounted DBD reactors have been developed and studied, in terms of ozone concentration and energy consumed.
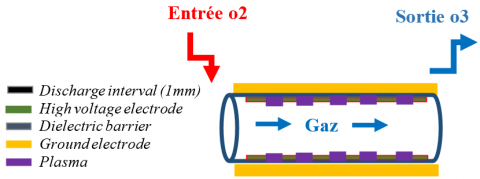
The surface reactor is made with the glass tube dielectric barrier, in which the outer stainless steel electrode has been replaced by a 220 mm long adhesive aluminum strip glued to the outer surface of the glass. The internal high voltage electrode has been replaced by a 240 mm long stainless steel grid is composed of several elementary meshes with an area of 1 mm2 each with a thickness of 0.75 mm, in contact with the interior of the glass tube. Micro-discharge occurs on the surface of the electrode in contact with the glass. Micro-discharges are generally generated at the high voltage electrode in contact with the inner surface of the dielectric barrier.
In this part, we have made an experimental study to realize ozone generators with a dielectric barrier "surface" in several configurations, with two different dielectric materials (glass and ceramic).
We are interested in this work in well-defined forms of:
Ground electrode: a 220 mm long aluminum adhesive strip mounted and glued to the outer surface of the glass tube, the latter, acting as a dielectric barrier with an outer diameter of 50 mm and a length of 300 mm and a thickness of 1.5 mm.
High voltage electrode: a metal grid made of high voltage stainless steel of cylindrical shape with an outer diameter of 43 mm and a length of 255 mm and a thickness of 0.75 mm.
This grid contacts the inner surface of the dielectric barrier.
3.1 For a DBDS1
The configuration of Figure 2 shows that the entire internal volume of the glass tube occupied by the gas.
Figure 2. Surface DBD ozone reactor (DBDS1)
3.2 For a DBDS2
Figure 3 illustrates the fact of the decrease in the internal volume of the gas by inserting a small-diameter glass tube with an external diameter of 32 mm inside the reactor in a coaxial manner, such that the gas flow interval between the two tubes is 6 mm.
Figure 3. DBDS3 reactor with tube inside, 6 mm gap between glass and Teflon tubes
3.3 For a DBDS3
To further minimize the internal volume of the gas, we inserted a second Teflon tube inside the DBDS1 reactor with an external diameter of 40 mm, almost in contact with the high voltage electrode; the 2 mm gas flow interval between the two coaxial tubes.
3.4 For a DBDS4
In this configuration, we played on the diameter of the dielectric and the length of the ground electrode. For which we have reduced the diameter of the glass tube by another glass tube of the same nature of the dielectric with a reduced internal diameter equal to 38 mm. In order to keep the same discharge surface, we have increased the length of the adhesive aluminum ground electrode to 230 mm.
In these studies, colored water is used to estimate the level of ozone production by calculating the rate of discoloration τ measured from the absorbance before and after the treatment by a visible spectrophotometer. The general estimate of the discoloration rate is given by the following equation:
$\tau=\frac{A b s_{0}-A b s_{1}}{A b s_{0}} \times 100$ (3)
where, Abs0: absorbance before treatment; Abs1: absorbance after treatment for a determined wavelength.
4.1 Effect of oxygen flow on ozone
Figure 4 gives the concentration of the variation in the rate of discoloration as a function of the oxygen flow rate applied for the ozone generators DBDS1, DBDS2, DBDS3, DBDS4. We consider a fixed supply voltage V=6 Kv and we vary the oxygen flow Do=1 to 5 L/min.
Figure 4. Evolution of the discoloration rate as a function of the oxygen flow rate for the different configurations (V=6 kV)
We can first observe that the evolution of the discoloration rate increases with the flow of oxygen injected for each configuration of DBD.
In fact, the water discoloration rate reaches its maximum 89.5% at an oxygen flow rate of 3 L/min with the configuration at DBDS4. This can be justified by the increase in the quantity of oxygen molecules subjected to electric shocks transforming into ozone.
Furthermore, the observation of a decrease in the discoloration rate after the value 3 L/min, this is can be explained by the increase in oxygen flow beyond 3 L/min makes it possible to increase the speed of the oxygen molecules, therefore a short residence time in contact with the discharge surface. This will cause some oxygen molecules not to be subjected to micro-discharge, and consequently a decrease in the ozone concentration (more and more oxygen molecules compared to ozone molecules).
4.2 Effect of voltage on ozone concentration
Figure 5 gives the variation in the rate of discoloration as a function of the voltage applied for the ozone generators DBDS1, DBDS2, DBDS3, DBDS4. We consider a fixed oxygen flow Do=5L/min and we vary the voltage from 3 to 6 Kv.
Figure 5. Evolution of the discoloration rate as a function of the applied voltage, for the four configurations (DO2=5 L/min)
The results obtained show that the rate of discoloration τ increases linearly with the voltage applied for all configurations of the reactor.
The increase in voltage increases the rate of dissociation of oxygen molecules.
We have seen a great improvement with the DBDS4 configuration, which has about 84.2% higher discoloration rate at 6 Kv voltage compared to DBDS1, DBDS2 and DBD3, which are adopted by high discharge volume, corresponding to larger quantity of oxygen passes through the generator without being transformed into ozone.
To maintain an ozone concentration at higher values we decrease the volume of gas flow that it produces an increase in micro-discharges.
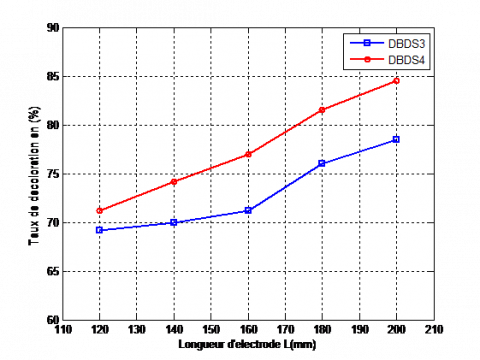
4.3 Influence of the electrode length
We consider the DBD3 and DBDS4 configurations after having their best previous experimental results in terms of ozone concentration.
Both configurations with a fixed supply voltage V=6 Kv, a constant oxygen flow rate 5 L/min and the electrode length L=120 to 200 mm is varied.
In Figure 6, the results of these reactors clearly show us that the rate of discoloration (the concentration of ozone molecules) continuously increases with increasing electrode length, resulting in increased micro-discharge area.
Moreover, the maximum discoloration rate achieved with the DBDS4 configuration is 84.5% for an electrode length of 200 mm. On the other hand, the use of the 120 mm length achieves a discoloration rate of around 71.2%.
Consequently, the comparison between the two configurations DBDS3 and DBDS4 shows the advantage of using the configuration of DBDS4 in ozone production as it carries a reduced dielectric diameter.
Figure 6. Evolution of the discoloration rate as a function of the length of the ground electrode (V=6 kV, DO2=5 L/min)
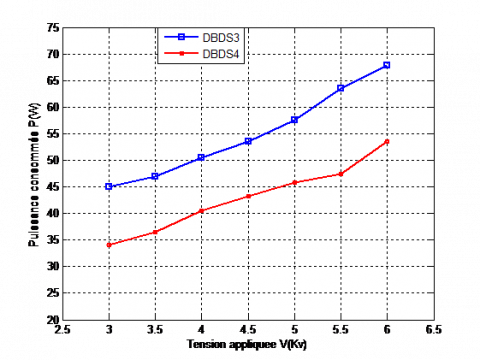
4.4 Effect of voltage on power consumption
The power factor is a product of the voltage V delivered by the power supply applied to the ozone generator and the current I were measured using a digital oscilloscope.
$P(W)=\frac{1}{T} \int_{0}^{T} U(t) \cdot I(t) \cdot d t$ (4)
Figure 7. Evolution of the power consumed as a function of the voltage applied for the DBDS3 and DBDS4 reactors (DO2=5 L/min)
Figure 7 illustrates a progressively increase in the power consumed as a function of the voltage applied for the two configurations.
We have remarked that applying the voltage of 3 and 6 kV on the DBDS4 consumes less power than DBDS3. Indeed, the results confirm that the application of high voltage with the DBDS4 configuration results in minimal power consumption.
When we reduced the diameter of DBDS4 its ozone yield was very satisfactory, we observed a significant production of ozone and a reduction in energy consumption.
This result is the fruit of an improvement in the electrical and geometric parameters of this generator, namely the applied voltage, oxygen flow rate and electrode length [9, 10]. In order to increase its energy efficiency, we use the plan method experiences.
We have studied all kinds of DBDS structure in order to capture the optimal values. In our case, we are evaluating the values of the electrical and geometric input factors of the DBDS so that they give us a maximum ozone generation rate and a minimum power consumption achieved by different experiments.
It is not easy to realize such a relationship between the response and the factors considered and above all, we know that there are interactions between the latter.
We have developed very suitable experimental studies based on a methodical work of composite experiment hoists [11, 12], which serve to optimize the organization of the trials.
Table 1 gives the results of the experiments of the CCF experimental design for the two significant responses, the discoloration rate (%) and the power consumed P (W).
Table 1. Results of the face-centered composite design in 17 experiments
|
Exp No |
Applied voltage V(Kv) |
Oxygen flow Do(L/min) |
Electrode length L(mm) |
Discoloration rate (%) |
Consumed power P(W) |
|
1 |
4 |
2 |
160 |
65 |
30,32 |
|
2 |
6 |
2 |
160 |
74,5 |
43,69 |
|
3 |
4 |
4 |
160 |
64,36 |
30,32 |
|
4 |
6 |
4 |
160 |
73,2 |
43,62 |
|
5 |
4 |
2 |
200 |
69,43 |
41,6 |
|
6 |
6 |
2 |
200 |
77,93 |
57,03 |
|
7 |
4 |
4 |
200 |
78,48 |
41,67 |
|
8 |
6 |
4 |
200 |
83,01 |
57,13 |
|
9 |
4 |
3 |
180 |
77,3 |
31,4 |
|
10 |
6 |
3 |
180 |
86,14 |
53,42 |
|
11 |
5 |
2 |
180 |
66,59 |
42,18 |
|
12 |
5 |
4 |
180 |
71,11 |
42,18 |
|
13 |
5 |
3 |
160 |
70,2 |
38,37 |
|
14 |
5 |
3 |
200 |
78,06 |
48,83 |
|
15 |
5 |
3 |
180 |
77,3 |
42,18 |
|
16 |
5 |
3 |
180 |
77,3 |
42,18 |
|
17 |
5 |
3 |
180 |
77,3 |
42,18 |
The mathematical models are shown by the following equations for the rate of discoloration and the power consumed respectively.
$\begin{array}{rl}\tau=76,59+3,96 & L+4,02 \mathrm{~V}+1,67 \mathrm{Do}+5,65 \mathrm{~V}^{2} \\ & -7,21 \mathrm{Do}^{2}-1,93 \mathrm{~L}^{2}-0,66 \mathrm{~V}^{*} \mathrm{~L} \\ & -0,57 \mathrm{~V}^{*} \mathrm{Do}+2,00 \mathrm{Do}{ }^{*} \mathrm{~L}\end{array}$ (5)
$\begin{array}{rl}P=42,32+5,99 & L+7,95 \mathrm{~V}+0.009 \mathrm{Do} \\ & +0,02 \mathrm{~V}^{2}-0,25 \mathrm{Do}^{2}+1,16 \mathrm{~L}^{2} \\ & -0,004 \mathrm{~V}^{*} \mathrm{Do}+0,52 \mathrm{~V}^{*} \mathrm{~L} \\ & +0.03 \mathrm{~L}^{*} \mathrm{Do}\end{array}$ (6)
From the results obtained by the simulation, the values of the factors of the mathematical model can be taken as a degree of influence on the responses. We have clearly recorded that the applied voltage and the electrode length used have a positive effect on the rate of discoloration and therefore the generation of ozone on the other hand the flow of oxygen has a less effect in comparison with the other factors on the surface DBD.
In addition, it can be seen that the power consumed is influenced by two input factors, the applied voltage and the length of the electrode used.
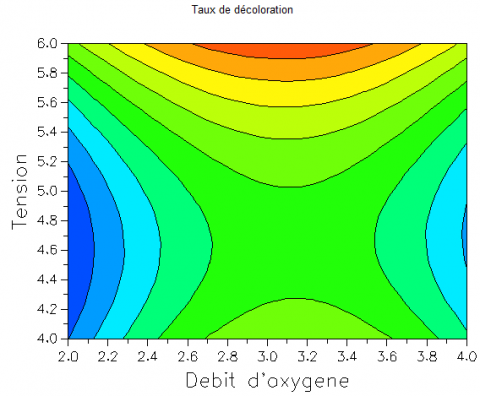
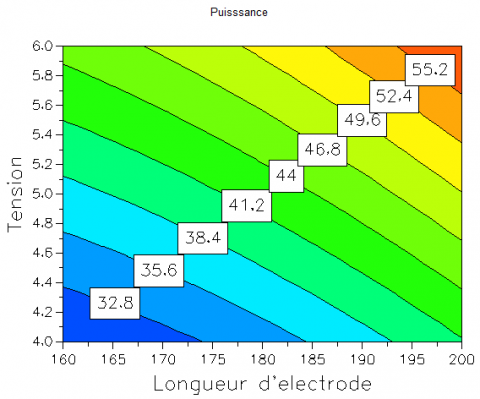
Figure 8 represents the iso-response contour plots obtained. Besides, the values of the input factors (voltage, mass electrode, oxygen flow) are optimized by this software for the different mathematical models of two responses, in order to obtain a maximum ozone yield (the areas in orange) and also the minimum energy consumed.
(a) Discoloration rate (Do=3 L/min)
(b) Discoloration rate (L=180 mm)
(c) Power consumption
Figure 8. Iso-response contours for ozone concentration
These simulation results allow us to conclude that the best way to control the ozone production and the power consumed is to apply a high voltage and a long enough electrode length.
The program also has an optimization subroutine, which gives the optimal values of the factors to obtain the maximum ozone concentration, the optimal values proposed of iso-response contours for ozone concentration (a) and (b) are:
V=6 kV, L=200 mm and Do=3L/min for τ=87.7%
For a minimum power, the optimal values proposed of iso-response contours for ozone concentration (c) are:
V=4 kV, L=160 mm and Do=3L/min for P=30 W.
Another experimental study is proposed. This is devoted to the DBDS4 configuration with a ceramic dielectric.
Table 2 gives the results of the experiments of the CCF experimental device on the DBDS4 reactor with a ceramic dielectric for the two significant responses, the discoloration rate (%) and the power consumption P(W).
Table 2. Results of the face-centered composite design in 17 experiments
|
Exp No |
Applied voltage V(Kv) |
Oxygen Flow Do (L/min) |
Electrode length L(mm) |
Discoloration rate (%) |
|
1 |
4 |
2 |
160 |
36 |
|
2 |
6 |
2 |
160 |
46 |
|
3 |
4 |
4 |
160 |
35,4 |
|
4 |
6 |
4 |
160 |
44,4 |
|
5 |
4 |
2 |
200 |
40,5 |
|
6 |
6 |
2 |
200 |
49 |
|
7 |
4 |
4 |
200 |
49,5 |
|
8 |
6 |
4 |
200 |
54,2 |
|
9 |
4 |
3 |
180 |
48,6 |
|
10 |
6 |
3 |
180 |
57,2 |
|
11 |
5 |
2 |
180 |
37,6 |
|
12 |
5 |
4 |
180 |
42,4 |
|
13 |
5 |
3 |
160 |
41,5 |
|
14 |
5 |
3 |
200 |
50 |
|
15 |
5 |
3 |
180 |
48,5 |
|
16 |
5 |
3 |
180 |
48,5 |
|
17 |
5 |
3 |
180 |
48,5 |
The mathematical models are shown by the following equations for the rate of discoloration.
$\tau=47,88+3,99 \mathrm{~L}+4,02 \mathrm{~V}+4,08 \mathrm{Do}-7,42 \mathrm{~V}^{2}$
$+5,47 \mathrm{Do}^{2}-1,67 \mathrm{~L}^{2}+2,05 \mathrm{~V}^{*} \mathrm{~L}$
$-0,59 \mathrm{~V}^{*}$ Do $-0,72$ Do $^{*} \mathrm{~L}$ (7)
We have found that the rate of discoloration and therefore the generation of ozone seems to be strongly influenced by the high voltages applied, the length of the electrode used and the flow rate of oxygen injected.
Moreover, it has been remarked that the stress factor remains a factor has a lower effect in comparison with the other factors on the rate of discoloration.
These curves in Figure 9 clearly show that the ceramic dielectric barrier discharge is less intense in comparison with the glass dielectric barrier discharge. Indeed, this can be explained by the difference in the values of the permittivity between the two materials. Since the permittivity of glass is greater than that of ceramic, therefore the electric field generated by the glass DBD is larger, this results in the dielectric barrier discharge being more intense and the ozone efficiency rate is bigger.
Moreover, at high temperatures the resistivity of glass is lower than that of ceramic. Indeed, several glass barriers of the DBD were broken by the high temperatures due to high voltages. In continuous life we find glasses that withstand high temperatures but with a manufacturing cost is too high.
Figure 9. Iso-response contours for Discoloration rate with ceramic dielectric (Do=3 L/min)
The optimal values proposed by Figure 9 about the iso-response contours for ozone concentration are:
V=5.43 kV, L=200 mm and Do=3L/min for τ=50.4%
In this chapter we carried out experiments on the surface dielectric barrier discharge by playing on the geometric parameters (the diameter and the nature of the dielectric, the electrode length, the gas flow volume) and on the electrical parameters (Applied voltage, injected oxygen flow).
We have found that the best way to control ozone generation is to use a reduced glass dielectric diameter with a long enough ground electrode length in this high voltage powered process.
Furthermore, in terms of minimum power consumption, the electrode length had to be minimized as well as the applied voltage.
The results obtained on the surface DBD in glass give us a satisfactory result comparable with those of the surface DBD in ceramic.
We conclude that this project is very beneficial for science and technology and opens up unlimited horizons in this domain.
[1] Homola, T., Pongrác, B., Zemánek, M., Šimek, M. (2019). Efficiency of ozone production in coplanar dielectric barrier discharge. Plasma Chemistry and Plasma Processing, 39(5): 1227-1242. https://doi.org/10.1007/s11090-019-09993-6
[2] Chang, J.S., Kelly, A.J., Crowley, J.M. (1995). Handbook of electrostatic processes. CRC Press. Ozone Generation and Applications, 26: 581-605.
[3] Nassour, K., Brahami, M., Nemmich, S., Hammadi, N., Zouzou, N., Tilmatine, A. (2017). New hybrid surface–volume dielectric barrier discharge reactor for ozone generation. IEEE Transactions on Industry Applications, 53(3): 2477-2484. https://doi.org/10.1109/TIA.2017.2675978
[4] Bouregba, N., Benmimoun, Y., Meddah, B., Tilmatine, A., Ouldmoumna, A. (2016). Ozonation of wastewater in Algeria by dielectric barrier discharge. Desalination and Water Treatment, 57(4): 1824-1835. https://doi.org/10.1080/19443994.2014.979440
[5] Shrestha, R., Joshi, U.M., Subedi, D.P. (2015). Experimental study of ozone generation by atmospheric pressure dielectric barrier discharge. International Journal of Recent Research and Review, 8(4): 24-29.
[6] Murbat, H.H. (2014). Effects of applied voltage and flow rates of ozone generator fed by dry air and O2 on the coaxial wire-cylinder reactor by varying various electrodes parameters. International Open Access. Journal of Modern Engineering Research (IJMER), 4(9): 56-60.
[7] Šimek, M., Pekárek, S., Prukner, V. (2010). Influence of power modulation on ozone production using an AC surface dielectric barrier discharge in oxygen. Plasma Chemistry and Plasma Processing, 30(5): 607-617. https://doi.org/10.1007/s11090-010-9245-4
[8] Nassour, K., Brahami, M., Nemmich, S., Hammadi, N., Zouzou, N., Tilmatine, A. (2016). Comparative experimental study between surface and volume DBD ozone generator. Ozone: Science & Engineering, 38(1): 70-76. https://doi.org/10.1080/01919512.2015.1095632
[9] Wei, L., Hu, Z., Zhang, Y., Wu, Q. (2010). Experimental study on ozone generation and ozone oxidation to removal multi-pollutant of flue gas. In 2010 4th International Conference on Bioinformatics and Biomedical Engineering, Chengdu, China, pp. 1-4. https://doi.org/10.1109/ICBBE.2010.5515999
[10] Delamézière, A., Naceur, H., Breitkopf, P., Knopf-Lenoir, C., Batoz, J.L., Villon, P. (2002). Faisabilité en emboutissage: Optimisation du matériau par surface de réponse. Mécanique & Industries, 3(2): 93-98.
[11] Nemmich, S., Bellebna, Y., Bendaoud, A., Tilmatine, A., Hammadi, N., Ouidir, R. (2013). Étude Expérimentale de L’Influence des Paramètres sur l’Efficacité du Procède de Génération d’Ozone par Décharge à Barrière Diélectrique.
[12] Remaoun, S.M., Tilmatine, A., Hammadi, N., Miloua, F., Medles, K. (2012). Optimisation of one stage electrostatic precipitator for welding fume filtration. Scientia Iranica, 19(6): 1861-1864. https://doi.org/10.1016/j.scient.2012.10.016