K. Darques* | A. Tounzi | A. Benabou | S. Shihab | J. Korecki | W. Boughanmi | D. Laloy
© 2021 IIETA. This article is published by IIETA and is licensed under the CC BY 4.0 license (http://creativecommons.org/licenses/by/4.0/).
OPEN ACCESS
In high power electrical machines, the leakage magnetic flux due to end windings induces eddy currents in clamping devices. However, it is quite difficult to quantify these losses. In order to study the effect of different clamping materials and the impact of the magnetization direction, an experimental mock-up composed of a stator and a clamping plate has been developed. An axial coil generates a circumferential magnetic flux in the stator core at different frequencies. Eddy current losses in the clamping plates are deduced from a power balance by subtracting Joule losses and iron losses from the total measured losses. Iron losses are deduced from 3D FE calculations while the impact of the frequency on B(H) curve is taken into account. Losses in the clamping device are then analyzed depending on experimental parameters.
iron losses, eddy currents, finite element method, end effects
An accurate estimation of the losses in the different parts of an electrical machine is a key point to further reduce them towards the efficiency increase. This can be achieved with a relative good accuracy using several analytical or numerical tools. However, the additional losses due to end effects [1] still are quite difficult to determine due to the three-dimensional nature of the problem.
In the case of high power electrical machines, the stator core is generally maintained by a clamping device. For mechanical purposes, the latter is often made of steel which has a non-negligible electric conductivity. Eddy currents are then induced due to the leakage magnetic flux generated by end windings leading to Joule losses [2]. The estimation of such losses is important for a better approximation of the machine efficiency but also to predict the temperature rise in the machine [3, 4]. Based on axisymmetrical geometry, previous work has already dealt with this task using 2D finite element modelling [5]. The accuracy of the results remains limited because of the three-dimensional nature of the magnetic flux at the end regions of the machine. Therefore, three-dimensional calculations have also been used to determine these losses [6-9]. In these studies, simulations have been achieved for large machines and numerical analysis has been conducted to evaluate these losses. But this has been done in a global way and the results were not compared with measurements.
Whatever the model used, its validation requires to compare simulation results to measurements. However, in the case of Joule losses in clamping devices, it is not a trivial task to isolate them from experimental measurements. The present work deals with a way to achieve that by means of the use of a power balance where the iron losses are obtained from numerical calculations [10]. The principle of the proposed approach is highlighted through the study of a simplified experimental device.
The present paper is divided into three parts. The first one presents the experimental test bench along with its numerical model.
The second part is devoted to the approach proposed to access experimentally the Joule losses induced in the clamping plate. To well justify its use, a first preliminary study is carried out in order to highlight the need of determining the induced currents with the presence of the magnetic core. Then, the proposed approach to yield the Joule losses in the clamping device is presented.
In the last part, the experimental setup to characterise the magnetic properties of the stator sheets is introduced. The experimental B(H) curves are approximated at different frequencies and the parameters of the model to determine the iron losses are identified. Simulation results, in terms of iron losses for different frequencies and excitation current amplitudes are compared to measurements showing good agreement.
Finally, some conclusions are outlined at the end of the paper as well as the planned future works.
2.1 Experimental setup
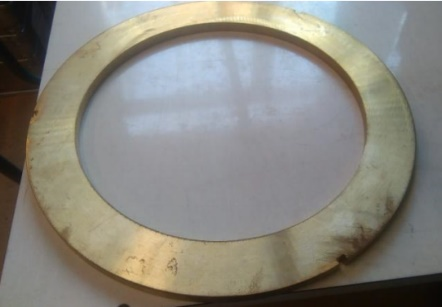
The experimental bench is constituted of a stator with stacked M600-65A electrical steel laminations and a clamping device. In a classical machine, the latter allows maintaining mechanical pressure on the stator laminations. It is constituted of a clamping plate and a stator sheet that supports pressure fingers of the same material as the plate as shown in Figure 1.
a
b
Figure 1. Clamping plate (a) and pressure fingers (b)
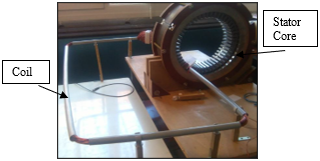
In order to focus only on the proposed approach, with very limited interactions, the excitation circuit has been simplified. It consists of a specific axial coil (hereinafter referred to as excitation coil) constituted of a set of conductors, of which end parts can be neglected, placed in a slot of the magnetic circuit. The coil is supplied by sinusoidal currents in order to generate a variable circumferential magnetic flux and then induced currents in the clamping device. Figure 2 shows a picture of the experimental bench and its main characteristics are given in Table 1.
Table 1. Characteristics of the experimental bench
|
Item |
Type Size |
|
Number of slots |
48 |
|
Inner diameter |
280 mm |
|
Outer diameter |
460 mm |
|
Number of turns |
60 |
|
Core length |
80 mm |
Figure 2. View of the experimental bench
The set up allows to perform measurements with or without the clamping plate. Finally, a programmable control voltage supply CSW 5550 is used to energize the axial coil with sinusoidal currents at different frequencies and amplitudes from 50 Hz up to 200 Hz and for maximum RMS current at 2.5 A. For each test, the voltage, current and power are measured by the voltage source CSW and the value of the coil resistance is measured at the end of the test. Depending on whether the clamping plate and the fingers are set or not, the measured active power corresponds to the Joule losses in the winding, the iron losses in the magnetic core and Joule losses in the clamping system.
2.2 Numerical model
To introduce the proposed approach while studying and analysing the experimental device, a 3D numerical model of the latter has been built up. It comprises the stator core, the clamping device and the axial coil while taking into consideration the symmetries in order to reduce the computation time. Therefore, only a quarter of the system is modelled and a large air box is also designed with the aim to not constrain the magnetic flux. Regarding the magnetic flux generated by the axial coil, a boundary condition “H.t = 0” is used in the XZ symmetry plane.
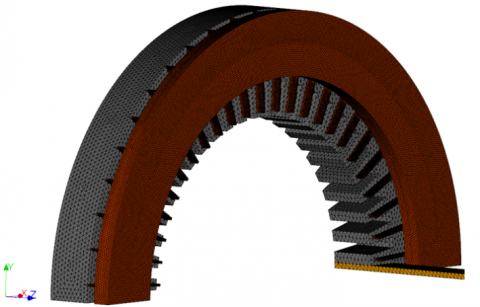
We use a homemade 3D calculation code, code_Carmel [11, 12], in which the total iron losses are obtained by performing the sum of each element contribution. Thus, this post-processing calculation requires a good mesh quality to get accurate results. Furthermore, in order to have an accurate estimation of the eddy currents in conductive areas, these must be meshed with care to account for the skin depth. Taking into account these constraints, Figure 3 presents the mesh of the bench which is composed of about 2 600 000 elements and 450 000 nodes.
Figure 3. 3D mesh of the structure
Simulations are conducted under the same conditions as the experimental tests. In addition to the iron and induced current losses accessible separately, the numerical calculation allows to visualize the establishment of the magnetic field in the different parts of the system and the distribution of eddy currents in the conductive parts.
As introduced previously, the aim of the paper is to investigate the losses due to induced currents in a conductive clamping plate. These losses are quantified by numerical simulation and validated through measurements.
3.1 Preliminary study
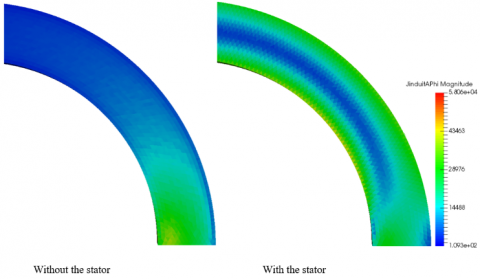
The simplest idea would be to study the currents induced in the plate alone in presence of the excitation circuit that is supplied by a sinusoidal current. This idea is attractive because of the simplicity of the model and the experimental tests to carry out. However, the magnetic material of the stator has a non-negligible effect in terms of the magnetic field distribution and thus on the induced currents in the conductive part. In order to highlight this fact, a preliminary study has been carried out in 2 cases:
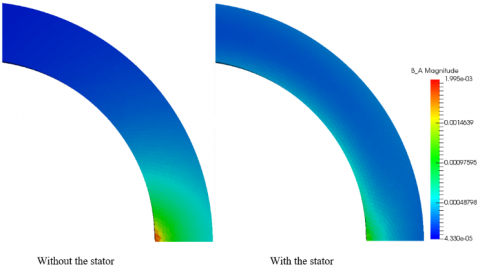
Simulations were conducted at 2 A, 50 Hz and Figure 4 presents the distribution of the magnetic flux density in the clamping plate in both cases. As expected, the magnetic field in the stator core has a significant impact. Indeed, in this case, the magnetic field is differently distributed in the whole plate with more restricted magnitudes.
Figure 4. Magnetic flux distribution in the clamping plate
Therefore, the localization of the eddy currents in the conductive plate for both cases is quite different as shown in Figure 5. Without the magnetic circuit, the currents are close to the excitation coil while they are more distributed in the presence of the magnetic core.
Figure 5. Eddy currents in the clamping plate
Consequently, the evaluation of the eddy currents in the clamping device with good accuracy requires the whole system to be taken into account.
3.2 Principle of the proposed approach
In terms of modelling, these currents can be easily calculated using a numerical approach from which the resulting losses are deduced. However, this needs to be first validated by comparing the simulations results with measurements.
The problem lies in the fact that with such system, only the total active power Ptot can be measured.
${{P}_{tot}}={{P}_{j}}+{{P}_{i}}+{{P}_{c}}$ (1)
The Joule losses Pj in the excitation circuit can be addressed in a simple way but afterwards, it is not possible to dissociate between iron losses Pi and those that are due to eddy currents in the clamping device Pc.
The proposed approach consists in obtaining Pc losses in an indirect way. The main idea is to calculate the iron losses Pin accurately by numerical modelling in the same conditions as the experiment. Then, Pc can be obtained such as:
${{P}_{c}}={{P}_{tot}}-{{P}_{j}}-{{P}_{in}}$ (2)
This approach can be of interest if Pin is equal to Pi within the range of the excitation current magnitudes and frequencies. To verify this fact, measurements and simulations were carried out on the system while removing the clamping device. Thus, the measured total active power Ptot is limited to only two components:
${{P}_{\text{tot }}}={{P}_{j}}+{{P}_{\text{in }}}$ (3)
In the case of the numerical modelling, the excitation circuit is supplied by the same current (amplitude and frequency) as the measured one. Then, using step by step resolution, the maximum magnetic flux density in all the elements of the modelled part is determined and recorded with respect to time. Finally, a post processing procedure, based on Bertotti’s loss decomposition (4), is used to determine the iron losses in the whole magnetic material parts [11].
${{P}_{\text{in }}}={{k}_{h}}f{{B}_{{{\max }^{\alpha }}}}+{{k}_{ci}}{{f}^{2}}{{B}_{{{\max }^{2}}}}+{{k}_{exc}}{{f}^{3/2}}{{B}_{{{\max }^{3/2}}}}$ (4)
Such calculations therefore require a good approximation of magnetic properties of stator sheets in terms of a good interpolation of the B(H) curve along with a very good identification of the coefficients kh, kci, kexc and α of the iron loss model.
The next part is dedicated to the characterisation of the magnetic material M600-65A used in the magnetic core at different frequencies and also the interpolation of the B(H) curves and the identification of the coefficients used in the loss model. The interpolation model chosen to approximate the B(H) curve is introduced. Due to the large thickness of stator sheets, the latter takes into account the impact of the frequency on the B(H) curve. In the third part, FEM calculations are carried out and iron losses are analysed with respects to the supplied frequencies and the current amplitudes.
4.1 Characterization of the magnetic properties of the stator sheets
The magnetic properties of stator sheets have been characterised with an Epstein Frame. This device is constituted of a removable magnetic circuit obtained by stacked sample sheets. A primary winding is used to energize this closed circuit and an e.m.f. is measured in the secondary winding. Figure 6 gives a view of the Epstein Frame used.
Figure 6. View of the Epstein frame
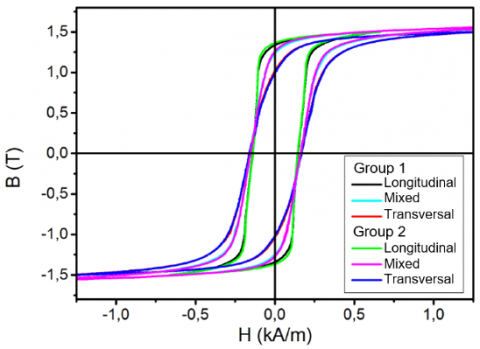
In order to verify the repeatability of the results, Samples of two groups of sheets have been characterized at frequencies from 5 to 200 Hz. Samples cut along both the rolling and transverse directions have been characterised, considering also a set of mixed samples from both directions. Figure 7 shows the results obtained for the different tests. As expected, the results are slightly different and then, to account for the non-linear behaviour of the magnetic material, we use the B(H) curves from the results related to the mixed samples.
Figure 7. Hysteresis loops of M600-65A electrical steel depending on the cutting direction at 50 Hz
Table 2. Parameters of Bertotti decomposition
|
Item |
Value |
|
$k_{h}$ |
0.04 |
|
α |
1.72 |
|
$k_{c i}$ |
4.01⸱10-4 |
|
$k_{e x c}$ |
0 |
Figure 8. Comparison of the experimental and calculated iron losses at 5 Hz
These characterisations also lead the evolution of the iron losses versus magnetic field density amplitudes and frequencies. The different parameters of the Bertotti decomposition are then identified and listed in Table 2.
The iron losses obtained from the experiment and from the loss model are compared in Figure 8 for the frequency 5 Hz. The curves are almost superimposed.
4.2 B(H) curve approximation
As introduced previously, the accuracy of the numerical simulation results depends, among others, on the approximation of the B(H) curve of magnetic material. In the numerical modelling, the lamination stack is considered to have a static behaviour (i.e. without eddy currents). In fact, dynamic losses are calculated in post-treatment considering that the magnetic field is not affected by the dynamic losses in the laminations. However, the large thickness of the laminations yields to a variation (in the considered range of excitation frequency) of the average B(H) curve. Therefore, great care has been taken to approximate the B(H) curve for each considered frequency. Hence, at low magnetic flux density value, the model has to account for the inflexion point of the magnetization curve while at high values, it is necessary to represent the saturation waveform with good accuracy.
In the case of the homemade code calculation used, code_Carmel [12] with the magnetic vector potential formulation, the magnetic field is linked to the magnetic flux density through the magnetic reluctivity $v(\|\vec{B}\|)$ such as:
$\vec{H}=v(\|\vec{B}\|)\cdot \vec{B}$ (5)
In this work, the interpolation method chosen is based on spline functions [13] which decomposes the experimental curve into several parts. Then, each part is approximated with a polynomial function. Figure 9 shows the comparison of the experimental B(H) curves at 50 Hz and 200 Hz with the ones obtained by the interpolation method. They are almost superimposed. The same procedure has been applied to approximate the experimental B(H) curves for other considered frequencies.
Figure 9. Comparison of the approximated and measured B(H) curves at 50 Hz and 200 Hz
4.3 Iron losses
Using the different interpolations, calculations were carried out in order to calculate the iron losses under the same conditions as the measurements performed on the studied device while removing the clamping plate. This has been achieved with a sinusoidal current in the coil for different amplitudes (0.5 to 2.5 A) and for different frequencies (50 Hz to 200 Hz).
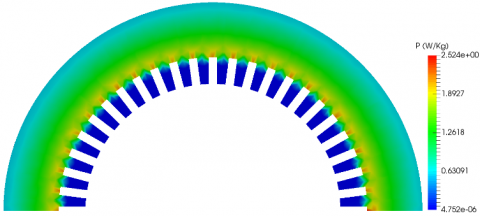
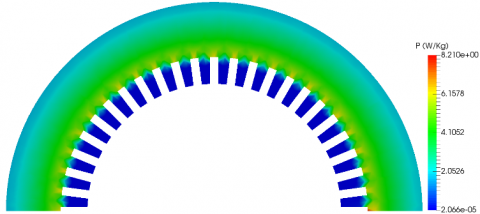
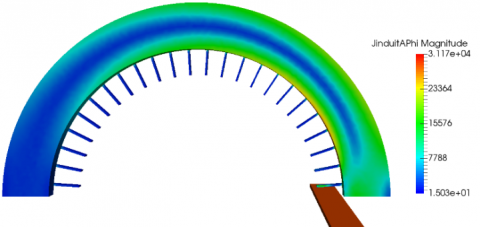
The axial coil generates a circumferential magnetic flux and iron losses are located all around the stator core with maximal values close to the stator slots. Figure 10a and Figure 10b show the localisation of the losses, for a current fixed at 2 A, at 50 Hz and 200 Hz respectively. The impact of the frequency is clearly visible with higher amplitude at 200 Hz.
a
b
Figure 10. Localisation of iron losses at 50 Hz (a) and 200 Hz
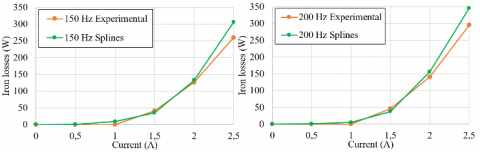
In Figure 11, the iron losses obtained by simulation and measurements are compared.
As expected, the supply frequency has a non-negligible effect on the iron losses due to the large thickness of stator sheets (0.65 mm). However, simulation results are close to measurements.
Figure 11. Iron losses at different frequencies
4.4 Simulation of losses in the clamping device
In the case of the experimental set up, since only a very simple excitation circuit is used, i.e. one set on conductors located in a slot of the stator and supplied by a limited range of current amplitudes and frequencies, the generated magnetic field density is weak thus the induced currents and Joule losses in the clamping device. Therefore, their measurements can obviously not be achieved as their values are very small within the range of the accuracy of the measurement devices.
This fact has been verified using the simulation results obtained by the numerical modelling. Using the 3D model built, the eddy current losses in the clamping device were calculated for the same conditions as for the previous experimental tests in terms of RMS current amplitudes (0.5 to 2.5 A) and frequencies (50 to 200 Hz).
Figure 12a and Figure 12b present the localisation of eddy currents in the clamp plate at 50 Hz and 200 Hz respectively. As shown in the preliminary study (Figure 5), eddy currents are located into the edges of the plate for both frequencies. Due to the nature of the excitation circuit and the limited range of supplied frequencies, only the amplitude of the induced current is modified.
a
b
Figure 12. Eddy current distribution at 50 (a) and 200 Hz (b)
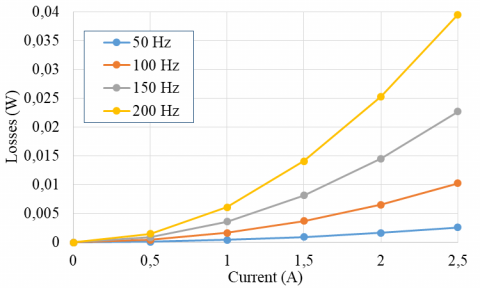
As expected, the values of losses generated by the induced currents in the clamping device are weak as shown in Figure 13.
Figure 13. Losses in the clamping device
The present paper dealt with a procedure that would permit to quantify experimentally the losses generated by induced currents in the clamping device of an electrical machine. It is based on the accurate determination of the iron losses in the ferromagnetic parts of the machine by a 3D numerical model. Thus, it would be possible to use the value of these losses in order to differentiate between Joule losses in the clamping parts and the iron losses in the case of power balance measurements.
To highlight the procedure, an experimental bench with a simplified excitation circuit based on an axial coil is considered.
A numerical model of the experimental bench was built. To calculate in an accurate manner the iron losses, the magnetic properties of the stator sheets have been characterized with an Epstein Frame at different frequencies and the parameters of the Bertotti model used to determine the iron losses have been identified. On the basis of spline functions, experimental B(H) curves have been interpolated and thus used in the numerical model to account for the nonlinear behaviour of the magnetic material. When removing the clamping plate, simulation results were compared to measurements with very good agreement concerning the iron losses.
Therefore, the proposed approach can be used to investigate experimentally the Joule losses in clamping devices. Future works will deal with application of the proposed approach in the case of a more realistic experimental set up with a much higher magnetic excitation field.
This work was supported by the C2EI project of University of Lille but also the society Jeumont Electric for providing financial support.
|
B |
Magnetic flux density, T |
|
H |
Magnetic field, A. m-1 |
|
ν |
Magnetic Reluctivity, A. m-1. T-1 |
|
f |
Frequency, Hz |
|
P |
Power, W |
[1] Bratoljic, T. (1986). Currents induced in the inner stator frame of large turbogenerators by the end-zone field. IEEE Transactions on Energy Conversion, EC-1(4): 108-114. https://doi.org/10.1109/TEC.1986.4765783
[2] Khan, G.K.M., Buckley, G.W., Bennett, R.B., Brooks, N. (1990). An integrated approach for the calculation of losses and temperatures in the end-region of large turbine generators. IEEE Transactions on Energy Conversion, 5(1): 183-194. https://doi.org/10.1109/60.50830
[3] Li, J., Sun, Y., Yang, G. (2005). Calculation and analysis of 3D magnetic field for end region of large turbogenerators. In 2005 International Conference on Electrical Machines and Systems, 3: 2079-2082. https://doi.org/10.1109/ICEMS.2005.202929
[4] Huo, F., Li, W., Wang, L., Zhang, Y., Guan, C., Li, Y. (2013). Numerical calculation and analysis of three-dimensional transient electromagnetic field in the end region of large water–hydrogen–hydrogen cooled turbogenerator. IEEE Transactions on Industrial Electronics, 61(1): 188-195. https://doi.org/10.1109/TIE.2013.2244542
[5] Yao, Y., Xia, H., Ni, G., Liang, X., Xian, Z. (2008). Analysis of magnetic-thermal coupled fields in the end region of large turbine-generators. In 2008 World Automation Congress, pp. 1-5.
[6] Hamalainen, H.M., Pyrhonen, J., Nerg, J., Puranen, J. (2012). 3-D finite element method analysis of additional load losses in the end region of permanent-magnet generators. IEEE Transactions on Magnetics, 48(8): 2352-2357. https://doi.org/10.1109/TMAG.2012.2190741
[7] Stermecki, A., Biro, O., Bakhsh, I., Rainer, S., Ofner, G., Ingruber, R. (2012). 3-D finite element analysis of additional eddy current losses in induction motors. IEEE Transactions on Magnetics, 48(2): 959-962. https://doi.org/10.1109/TMAG.2011.2173919
[8] Waldhart, F.J., Bacher, J.P., Maier, G. (2012). Modeling eddy current losses in the clamping plate of large synchronous generators using the finite element method. In International Symposium on Power Electronics Power Electronics, Electrical Drives, Automation and Motion, pp. 1468-1473. https://doi.org/10.1109/SPEEDAM.2012.6264435
[9] Holland, S.A. (2002). Three dimensional finite element analysis of stator clamp plate losses of large turbo-generators. in Conference on Power Electronics, Machines and Drives, Sante Fe, NM, USA. https://doi.org/10.1049/cp:20020182
[10] Fratila, R., Benabou, A., Tounzi, A., Mipo, J.C. (2014). A combined experimental and finite element analysis method for the estimation of eddy-current loss in NdFeB magnets. Sensors, 14(5): 8505-8512. https://doi.org/10.3390/s140508505
[11] Fratila, M., Benabou, A., Tounzi, A., Dessoude, M. (2014). Calculation of iron losses in solid rotor induction machine using FEM. IEEE Transactions on Magnetics, 50(2): 825-828. https://doi.org/10.1109/TMAG.2013.2281492
[12] http://code-carmel.univ-lille1.fr/.
[13] Wolberg, G., Alfy, I. (1999). Monotonic cubic spline interpolation. In Computer Graphics International, pp. 188-195. Canmore, Alta., Canada. https://doi.org/10.1109/CGI.1999.777953