Abbas F.G. Mohmmedali* | Messaoud Hamouda | Ghaitaoui Touhami
© 2021 IIETA. This article is published by IIETA and is licensed under the CC BY 4.0 license (http://creativecommons.org/licenses/by/4.0/).
OPEN ACCESS
In this paper, the impact of integrating a 6MW solar PV plant installed in Zaouiet Kounta (Wilaya Adrar), in southwest Algeria into a medium voltage network during transient conditions is analyzed. This network is fed by two sources, either a grid source or a conventional power plant if a grid source is not available. Three different transient circumstances are considered in this analysis. The impact on voltage and frequency at the network’s main busbar as well as generator rotor angle is investigated. The analysis is carried out on the network by using ETAP software. The analysis results showed that the integration of this PV plant has an adverse effect on network performance during transient conditions when a Conventional power plant is used to feed network. Moreover, it has a slight effect on main busbar voltage when a grid source is used to feed network.
PV plant, dynamic analysis, PV integration, distribution network, Etap
Currently, due to increased load, dwindling fossil fuel resources, and pollution caused by traditional generators the necessity for renewable energy sources is expanding significantly [1]. Photovoltaic systems are the most often used among the numerous types of renewable energy, with potential benefits such as being ecologically friendly, non-polluting, and requiring less maintenance. According to a global survey, solar energy will fulfil 28% of global energy demand by 2040 [2]. The two primary categories of PV applications are grid-connected and off-grid PV systems. PV systems that are connected to the grid feed the system with their energy generating power. Locally, off-grid PV systems are employed for things like water pumps and communication antennae. A grid-connected PV system could be utilized when large-scale power from a PV system is necessary [3]. The inclusion of solar PV power is becoming more common worldwide, creating a challenge for power utility companies operators in transmission and distribution systems. As a result, a thorough knowledge of the implications of incorporating a solar PV system into an existing power network is required [4].
Several studies have been conducted to investigate the effects of solar PV integration on the grid. Karimi et al. [5] reviewed solar PV penetration concerns and their consequences for distribution networks. The characteristics of a solar system for integration, as well as the impacts and obstacles of integration, are discussed in Ref. [6]. PV's effects on power system voltage, frequency, rotor angle stability, are reviewed by Gandhi et al. [7]. According to Mulenga [8], adding solar PV power to distribution systems increased voltage level and voltage profile while decreasing voltage drop and grid losses. Furthermore, the integration enhanced voltage stability in the steady state. The addition of a PV system to a grid can result in a rise in voltage level and profile, according to a study [9], however this is based on the grid topology and distance from the main power source. According to the study [10], the integration of solar PV powers reduces active and reactive power losses, in addition to the load on the lines. Work done by Emmanuel et al. [11] revealed that as a result of PV integration at various PV penetration levels, there was an effective offset of active power consumption, a considerable decrease in load and line losses, and an enhancement in voltage profile. Similarly, studies [12, 13] investigate the influence of increasing PV system penetration on the performance of a large interconnected system. The results showed that rising PV penetration levels can result in voltage magnitude alterations. over voltages were observed at some penetration levels.
Algeria has ignited a green revolution by making a concerted effort to promote renewable energy (REn) and energy efficiency. This program is based on a policy that prioritizes non-renewable resource development and extension, such as solar energy, in order to diversify Algeria's energy sources and prepare the country for the future. Algeria has entered a new era of sustainable energy use by combining actions and knowledge gain. Between 2011 and 2030, the initiative aims to install up to 22 000 MW of renewable energy generation capacity, with 12 000 MW targeted for domestic use and 10,000 MW for export. Renewable energies are at the heart of Algeria's energy and economic policies in this program: by 2030, it is estimated that around 40% of the power produced for domestic consumption will come from renewable sources [14].
Most of above studies focused on steady state analysis to examine the impact of solar PV powers and PV penetration level on the network performance during normal conditions, in terms of the voltage level, voltage profile and electrical losses. The main contribution of this study presented the dynamic analysis to examine the influence of integrating Zaouiet Kounta solar photovoltaic power plant into existing distribution network, in order to study the effect of its integration during distribution network transients. Several transient scenarios are proposed and simulated for analysis in order to give a clear idea to utility operators about these impacts.
The paper is organized as follows: Section 1 introduction, Section 2 Solar PV plant and the test distribution network description. Simulation results and discussion in section 3. Finally, the conclusion is in section 4.
The photovoltaic power plant is mounted in the Zaouiet Kounta region (wilaya Adrar), in southwest Algeria,77 km of Adrar city. It covers an area of 12 hectares and includes 24,552 panels, it is coupled to a 30 kV distribution network main busbar. This plant comprises of six (6) photovoltaic sub-fields, each with its own 1 MW output, forming 93 arrays, each array comprises of 44 panels split into two strings, each string includes 22 panels connected in series. Each sub-field divides into two connected fields, individually connected to a 1.25/0.630/0.630 MVA step-up three windings transformer via two 500 kW inverters. The transformer raises the 0.315 kV generation voltage to 30 kV and injects it into the 30 kV distribution network. Panels type is YL245P-29b made using polycrystalline silicon by YINGLI SOLAR. Inverters type is SG 500MX made by SUNGROW.
The test network is a distribution network medium voltage including nine (9) loads; CDRAS 1, CDRAS 2, CDRAS 3, CDRAS 4, REG N, REG S, ZK, MEKKID, and AIN ELFETH, and the values of these loads are, 0.52 MVA, 1.559 MVA, 6.235 MVA, 5.196 MVA, 3.897 MVA ,5.196 MVA, 3.793 MVA, 5.196 MVA, and 2.962 MVA respectively, which are recorded on 14/7/2020. These loads connected to the network main busbar through nine (9) feeders, and the voltage level is 30KV. The network is fed by two sources, either a grid source through a 220 KV transmission line, Adrar- Zaouiet Kounta and a step-down transformer of 40 MVA- 220/30 kV or a Conventional power plant, if a grid source is not available. The Conventional power plant is made up of four 17 MW gas turbine unit each. Every two unit connected to step up transformer with three windings (11.5KV, 11.5KV, 220KV). The four unit inject their powers into the same 30 kV busbar through same 40 MVA a step-down transformer. In addition, sometimes this plant connects to the Adrar grid through the Adrar - Zaouiet Kounta transmission to improve the grid performance. The layout of the network and PV plant in ETAP are given in Figure 1.
Figure 1. Layout of solar PV plant connected to the distribution network main busbar
All results are performed in ETAP, which is software for power system studies. The influence of the solar photovoltaic plant during distribution network transients are examined using transient analysis. Transient stability is defined as the ability of the power system to maintain synchronism when subjected to a large disturbance such as faults, transmission line outages, loss of large generating unit, etc. [15]. For transient stability studies, the disturbance usually lasts 3-5 seconds. By analyzing the electrical network under various transient scenarios, utility engineers would be able to assess the system's stability with the installation of a PV system. As a result, the test distribution network is subjected to three different transient circumstances for this analysis such as i) fault on the network main busbar ii) sudden disconnection of load iii) sudden loss of PV power. For each of the three conditions, results show voltage and frequency at the main busbar, as well as rotor angle of generator 2, other generators have same behavior. Hence, are not showed here. Results for 3 MW, 6 MW, and the basic case with no PV power in the distribution network are investigated in this analysis in order to show the impact of increase the PV power on the network performance during transient. It is well known that the PV units have no rotating part; thus, no inertia response can be provided during disturbances in the network. The overall system inertia will diminution once the grid is penetrated with PV power. Lesser the system inertia will cause higher system oscillations. The system performance also affects by large angle differences between the bus voltages that occur due to injection of PV power.
(a)
(b)
(c)
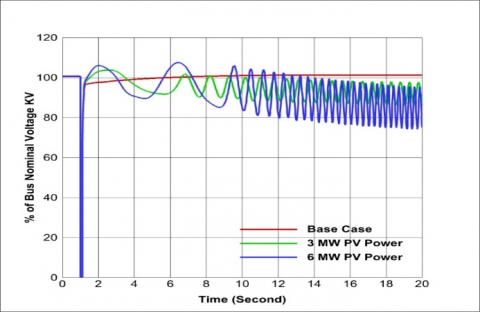
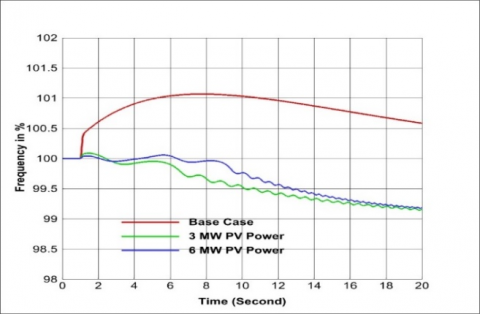
Figure 2. Network behavior due to fault at the network main busbar / when a conventional power plant is used to feed network (a) Voltage at network main busbar (b) Frequency at network main busbar (c) Relative rotor angle of generator 2
3.1 Impact of fault on the network main busbar
Three-phase faults are one of the most dangerous types of faults that can lead to system instability. The short circuit currents developed in this fault are of the highest magnitude. Therefore, high thermal stresses are generated, which affect the electrical equipment. Moreover, the three-phase voltage at this kind of fault drops to zero causes stability problems. The other types of faults which are not considered here are, phase-to- ground fault, double phases to ground fault, phase -to - phase fault. For this scenario, a three-phase-to-ground fault is applied at 1 s for a period of 6 cycles to the network main busbar. The network results under this condition are shown in Figure 2 and Figure 3.
(a)
(b)
Figure 3. Network behavior due to fault at the network main busbar / when a grid source is used to feed the network (a) Voltage at network main busbar (b) Frequency at network main busbar
From Figure 2 (a), it can be noticed that the voltage of the base case decreases to zero at the moment of the fault, and subsequently recovers to its value in steady state condition when the fault is eliminated. For 3 MW PV power, it can be noticed that the voltage after eliminating the fault, returns with minor oscillations till 7.8 s, and then the oscillations intensify with an amplitude slightly less than its value in the steady state. Similar oscillations occur with 6 MW PV power, while these oscillations are more severe and have a little larger amplitude than at 3 MW PV power. From Figure 2 (b), it can be observed that the frequency of the base case after the fault is eliminated rises until it reaches 101.067% of the frequency of the network which is 50 Hz, and then begins to gradually decline until it reaches a new value somewhat more than 100.5%. For 3 MW and 6 MW PV power, the frequency rises to 100.63% and 100.031%, respectively, before gradually decreasing with tiny oscillations until it stabilizes at a value slightly higher than 99% of the frequency in the steady state (50 HZ). Taking into mind that the reduction in 3 MW PV power occurs before the reduction in 6 MW. From Figure 2 (c), it can be noticed that the relative rotor angle of generator 2 for the base after the fault is eliminated shows tiny oscillations, which gradually reduce until it stabilizes at its value in the stable state before the fault occurrent. For 3 MW PV power, the relative rotor angle value in the steady-state is higher than the base case with a difference of around 8.02 degrees, and after the fault is removed, the relative rotor angle tends to oscillate more and irregularly with higher amplitude at certain times, then the irregular oscillation begins to decrease gradually at a value higher than the initial value for it. Similarly, for 6 MW PV power, where it can be noticed that the difference in the relative rotor angle of the steady-state is around 16.3 degrees from the base case, and its oscillations are similar to the case of 3 MW PV power, these oscillations begin to decrease gradually at a higher value compared to 3 MW PV power.
From Figure 3 (a), and when feeding the network from the grid source, it can be observed that the voltage for all the varied powers of the solar power when a fault occurs, decreases to zero and then recovers to its stable state. From the chart of the frequency in Figure 3 (b), it can be realized that the frequency did not vary with the occurrence of the malfunction and stayed stable throughout the different solar PV power.
3.2 Impact of sudden disconnection of load
Sudden disconnection of load in the system is a type of disturbance that can lead a system to be unstable. In order to carry out this scenario, the largest load in the test network (6.235 MVA), the load of CDRAS 3, is disconnected at 1 s. The results of this scenario are shown in Figure 4 and Figure 5.
(a)
(b)
(c)
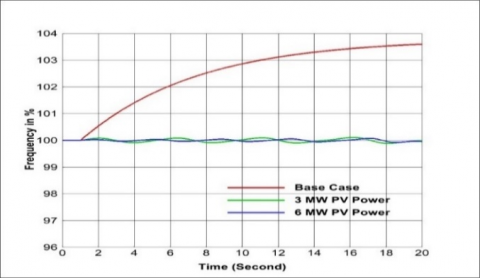
Figure 4. Network behavior due to sudden disconnection of load / when a conventional power plant is used to feed network (a) Voltage at network main busbar (b) Frequency at network main busbar (c) Relative rotor angle of generator 2
(a)
(b)
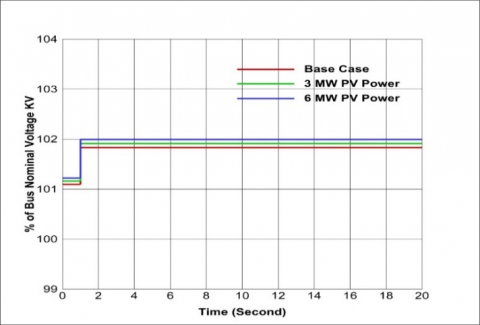
Figure 5. Network behavior due to sudden disconnection of load / when a grid source is used to feed the network (a) Voltage at network main busbar (b) Frequency at network main busbar
From Figure 4 (a), it can be noticed that the voltage for base case, at the moment of disconnection of the load rises to a value higher than 110% of bus nominal voltage, which is higher than the permissible value (+-10%). For 3 MW PV power, the voltage at the moment of disconnection of the load begins to oscillate with amplitude higher than the permissible value. Similarly, for 6 MW PV power, but with more oscillation and high amplitude compared to 3 MW PV power. From Figure 4 (b), it can be noticed that the frequency at the moment of disconnection of the load begins to rise until it reaches a value higher than 103% of system frequency. For 3 and 6 MW PV power, the frequency oscillates slightly. From the relative rotor angle of the generator 2 shown in Figure 4 (c), it can be observed that the relative rotor angle for base case tends to oscillate slightly and rapidly this oscillation decreases and settles at a stable value less than its value in the steady-state with a difference of around 2.77 degrees. For 3 MW PV power, the oscillation is entirely erratic and does not converge to a stable value. For 6 MW PV power, the oscillation totally irregular and severe compared to 3 MW PV power.
From Figure 5 (a), it can be noticed that the voltage at the moment of disconnecting the load rises to a higher value than in the steady state. For base case the voltage rose from 101,094% to 101,832%. For 3 MW PV power, the voltage rose from 101.159% to 101.915%. For 6 MW PV power it rose from 101.22% to 101.992.% of bus nominal voltage. As can be observed, the frequency stayed steady throughout the disruption as seen in Figure 5 (b).
3.3 Impact of sudden loss of PV power
The output fluctuations of PV systems due to weather variations can lead to loss of a large fraction of the distributed PV power output. Voltage dips can also causes simultaneously outing of the connected PV system [16]. For this scenario, a PV power is supposed to outing at 1 s for both 3 MW and 6 MW PV powers cases. The network behavior under this condition is shown in Figure 6 and Figure 7.
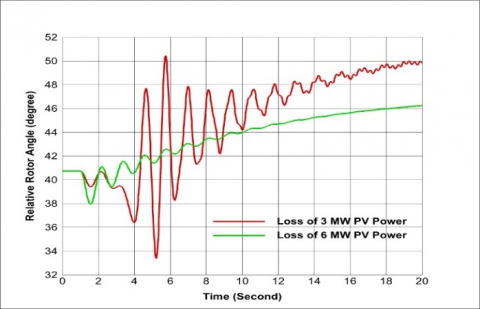
From the chart of voltage shown in Figure 6 (a), it can be noticed that the voltage has a severe, regular, and persistent oscillation when 3 MW PV power is lost. When 6 MW PV power is lost, the voltage gradually decreases to a new value of a little over 92% of bus nominal voltage. From Figure 6 (b), It can be observed that the frequency decreases from its initial value when 3 and 6 MW PV power is lost, with the decrease in the case of loss 6 MW being significantly bigger than the decrease of los 3 MW. Figure 6 (c) shows the relative rotor angle, it can be noticed that in the case of loss of 6 MW PV power, the relative rotor angle of generator 2 increases with a minor oscillation that gradually decreases until it stabilizes at a new value higher than the value of the steady state. In the case of loss 3 MW PV power, the oscillation is severe and the amplitude is high compared to the loss of 6 MW PV power. This oscillation increases in the beginning and then gradually decreases to settle at a new peak higher than the value of the steady state. The network is not penetrated with PV when 6 MW PV power is lost; thus, the inertia of the conventional generators does not affect aids in improving the network performance which led to less oscillation. when 3 MW PV power is lost the network still penetrated with 3 MW PV power cause decrease in the system inertia; therefore, the oscillation occurred.
From Figure 7 (a), it can be noticed that the voltage in the case of loss 3 MW PV power drops from 101.22% to 101.139% of bus nominal voltage. And it drops from 101.22% to 101.08 % of bus nominal voltage in the case of loss 6 MW PV power. Furthermore, the frequency remains constant without altering., as shown in Figure 7 (b).
The grid source acts as an energy buffer compensate for any power variations and balance the PV output. But the output of the conventional power plant needs to be adjusted frequently to deal with the variations of PV power.
(a)
(b)
(c)
Figure 6. Network behavior due to sudden loss of PV power / when a conventional power plant is used to feed network (a) Voltage at the network main busbar (b) Frequency at the network main busbar (c) Relative rotor angle of generator 2
(a)
(b)
Figure 7. Network behavior due to sudden loss of PV power / when a grid source is used to feed the network (a) Voltage at the network main busbar (b) Frequency at the network main busbar
In this paper, the probable dynamic impact of integration PV power plant on test distribution network is investigated. The transient performance of the test distribution network with and without PV powers is analyzed. For this analysis, three possible transient scenarios are considered. Results related to voltage and frequency at the network main busbar in addition to generator 2 rotor angle for each of the three scenarios are illustrated. The results showed that integrating Zaouiet Kounta PV plant into distribution network has an adverse impact on network performance during transient conditions when a conventional power plant is used to feed the network. Fluctuations in voltage at the main busbar, relative rotor angle of generators, and variations in frequency are examples of this effect. Moreover, it has a slight effect on the network main busbar voltage when a grid source is used to feed the network. Therefore, appropriate control manners must be taking into consideration to alleviate the adverse impact on network performance during transient circumstances.
[1] Al Talaq, M., Belhaj, C.A. (2020). Optimal PV penetration for power losses subject to transient stability and harmonics. Procedia Computer Science, 175: 508-516. https://doi.org/10.1016/j.procs.2020.07.072
[2] Paital, S.R., Ray, P.K., Mohanty, A., Dash, S. (2018). Stability improvement in solar PV integrated power system using quasi-differential search optimized SVC controller. Optik, 170: 420-430. https://doi.org/10.1016/j.ijleo.2018.05.097
[3] Eltawil, M.A., Zhao, Z. (2010). Grid-connected photovoltaic power systems: Technical and potential problems—A review. Renewable and Sustainable Energy Reviews, 14(1): 112-129. https://doi.org/10.1016/j.rser.2009.07.015
[4] Khan, M.A., Arbab, N., Huma, Z. (2018). Voltage profile and stability analysis for high penetration solar photovoltaics. International Journal of Engineering Works, 5(5): 109-114. https://doi.org/10.5281/zenodo.1252381
[5] Karimi, M., Mokhlis, H., Naidu, K., Uddin, S., Bakar, A.A. (2016). Photovoltaic penetration issues and impacts in distribution network–A review. Renewable and Sustainable Energy Reviews, 53: 594-605. https://doi.org/10.1016/j.rser.2015.08.042
[6] Nwaigwe, K.N., Mutabilwa, P., Dintwa, E. (2019). An overview of solar power (PV systems) integration into electricity grids. Materials Science for Energy Technologies, 2(3): 629-633. https://doi.org/10.1016/j.mset.2019.07.002
[7] Gandhi, O., Kumar, D.S., Rodríguez-Gallegos, C.D., Srinivasan, D. (2020). Review of power system impacts at high PV penetration Part I: Factors limiting PV penetration. Solar Energy, 210: 181-201. https://doi.org/10.1016/j.solener.2020.06.097
[8] Mulenga, E. (2015). Impacts of integrating solar PV power to an existing grid. Case Studies of Mölndal and Orust Energy Distribution (10/0.4 kV and 130/10 kV) Grids. Master's thesis.
[9] Shah, R., Mithulananthan, N., Bansal, R.C., Ramachandaramurthy, V.K. (2015). A review of key power system stability challenges for large-scale PV integration. Renewable and Sustainable Energy Reviews, 41: 1423-1436. https://doi.org/10.1016/j.rser.2014.09.027
[10] Salih, Z.H., Hasan, G.T., Mohammed, M.A., Klib, M.A.S., Ali, A.H., Ibrahim, R.A. (2019). Study the effect of integrating the solar energy source on stability of electrical distribution system. In 2019 22nd International Conference on Control Systems and Computer Science (CSCS), pp. 443-447. https://doi.org/10.1109/CSCS.2019.00081
[11] Emmanuel, M., Rayudu, R., Burmester, D. (2016). Impact of large-scale integration of distributed photovoltaic with the distribution network. In 2016 IEEE International Conference on Power System Technology (POWERCON), pp. 1-6. https://doi.org/10.1109/POWERCON.2016.7753858
[12] Eftekharnejad, S., Vittal, V., Heydt, G.T., Keel, B., Loehr, J. (2012). Impact of increased penetration of photovoltaic generation on power systems. IEEE Transactions on Power Systems, 28(2): 893-901. https://doi.org/10.1109/TPWRS.2012.2216294
[13] Kumar, D.S., Sharma, A., Srinivasan, D., Reindl, T. (2019). Stability implications of bulk power networks with large scale PVs. Energy, 187: 115927. https://doi.org/10.1016/j.energy.2019.115927
[14] Renewable Energy and Energy Efficiency Program. March 2011, pp. 1-35. Available: https://taqaway.net/sites/default/files/Programme_ENR_et_efficacite_energetique_en.pdf, accessed on July 15, 2021.
[15] Kundur, P., Paserba, J., Ajjarapu, V., Andersson, G., Bose, A., Canizares, C., Vittal, V. (2004). Definition and classification of power system stability IEEE/CIGRE joint task force on stability terms and definitions. IEEE Transactions on Power Systems, 19(3): 1387-1401. https://doi.org/10.1109/TPWRS.2004.825981
[16] GE Corporate Research and Development. (2003). Reliable, low cost distributed generator/utility system interconnect. 2001 annual report, National Renewable Energy Laboratory, NREL/SR-560-34634, Golden, Colorado. Available: https://digital.library.unt.edu/ark:/67531/metadc1410727/, accessed on July 5, 2021.