Pawan Kumar Kushwaha* | Chayan Bhattacharjee
© 2020 IIETA. This article is published by IIETA and is licensed under the CC BY 4.0 license (http://creativecommons.org/licenses/by/4.0/).
OPEN ACCESS
For voltage stability assessment at a given operating point, various types of voltage stability indices (VSIs) have been proposed in the literature. In this paper, the voltage stability assessment of an IEEE-14 bus system is done for performance comparison of different types of VSIs available, under certain critical and practical stressed operating conditions (SOCs). The performance comparison of various VSIs under the considered SOCs is not reported in the literature. Such SOCs include the combinational occurrence of – variation in inductive loading, single line to ground (SLG) fault and effect of one generation unit tripped. These SOCs are the prime cause of voltage collapse of any node/line. The results show the performance of various VSIs with respect to line number, contingency ranking of the line, power margin, effects of loading and SLG fault. These VSIs are also instrumental in critical line and node analysis (CLNA) which is useful in the choice of proper location for reactive power compensation required. The simulated results provide the best performing VSI for accurate prediction of voltage instability under any considered SOC. This information is essential for voltage stability assessment of a particular line under multiple causes of voltage collapse.
contingency analysis, one generation unit tripped, power margin analysis, single line to ground fault, voltage stability indices and SLG fault
The restrictions due to environmental conditions such as climatic effect, change in landscape, restriction on land use, impact on nature, self-regulation approach of transmission and distribution companies and excessive assembling price of new power lines, enforce the prevailing electricity structure to function under the burdened situation. Any perturbation in this situation may cause voltage instability. Consequently, the investigation of voltage stability is vital for a power system. The dynamic and static approach of voltage stability is often used for the analysis of stable voltage points in a power system. More computational time is required for dynamic stability analysis compared to the static approach [1]. The stability of a power system using real power versus line voltage (PV) and reactive power versus line voltage (QV) curves are analyzed but these techniques are time-consuming. Therefore, the methods based on voltage stability indices (VSIs) are used for faster voltage stability estimation. A numeric value of VSIs specifies the voltage stability of the system. In the literature various types of VSIs are proposed under general system conditions like base loading, single continuous real load change, single continuous reactive load change and multiple real load change but correct choice of a VSI depends on the more severe stressed operating conditions of the power system. So for an appropriate selection of VSI, evaluation of its numeric value along with different performance analysis is essential. This is because different VSI may be appropriate under different SOCs and stability analysis for a particular line/node. A Fast Voltage Stability Index (FVSI) is proposed by Musirin and Rahman [1] for the prediction of the point of voltage collapse, maximum acceptable load, feeble bus in the system and the critical lines with respect to voltage stability in the system. But FVSI gives inaccurate result in case of real power increment, as it neglects the real power flow in the line. Moghavvemi and Omar [2] proposed the Line Stability Index (Lmn) which depends on the reactive power. Due to its negligence of real power flow and the consideration of shunt admittance to be approximately zero it gives less magnitude of Lmn while the line voltage is closer to its unstable point.
The Line Stability Factor (LQP) considering both real and reactive power provides a better result, as reported by Chebbo et al. [3]. But, as the effect of admittance and resistance is not considered, under heavy loading LQP gives a less accurate result. Line Stability Index (Lp) is proposed by Moghavvemi and Faruque [4]. which discusses the radial distribution voltage stability. But, because of neglecting the effect of reactive loading, Lp gives inaccurate result in case of increased reactive loading. Both the effects of real and reactive power loading are considered in Novel Line Stability Index (NLSI) as proposed by Yazdanpanah-Goharrizi and Asghari [5]. Therefore, NLSI gives more accurate result than earlier mentioned VSIs which neglect real and reactive power loading. But in the case of long distribution lines, NLSI gives less accurate result as the effect of line admittance is not considered. Next, because of the consideration of constant power factor in Voltage Collapse Proximity Indicator (VCPI), it gives less accurate result in varying load conditions [6]. Kanimozhi and Selvi [7] formulate a New Voltage Stability Index (NVSI) which considers the effect of both real and reactive load variation and also neglects the transmission line resistance. In the case of long transmission lines neglecting the transmission, line resistance leads to less accurate stability prediction by NVSI. A Voltage Reactive Power Index at Line (VQILine) is discussed by Althowibi and Mustafa [8] proposed based on the reactive power of the line. In case of more distance from the voltage collapse node, the accuracy level is less in VQILine. Further, for prediction of dynamic voltage collapse in the power system, a Power Transfer Stability Index (PTSI) is presented by Nizam et al. [9]. The PTSI is calculated by considering zero admittance of line, thus in case of large line admittance, this leads to the poor level of accuracy in the prediction of voltage stability. A new online VSI (VSI_1) is proposed which is based on the power margin, given by Gong et al. [10]. Due to an inaccurate prediction of power margin because of consideration of constant power load, this also gives a poor level of accuracy in the prediction of voltage collapse point. Makasa and Venayagamoorthy [11] presented a Voltage Stability Load Index (VSLI) which uses data from optimally located phasor measurement units (PMUs). PMUs require different methods for optimal placement which involved in VSLI makes it more complex.
A VSI based on maximum loading capability of the bus combined with Thevenin equivalent method which requires PMU data is further discussed in Maharjan and Kamalasadan [12]. Thevenin equivalent method requires PMU data which is large so computational time is more. An analytical approach to online tracking of Voltage Stability Margin (VSM) is proposed in Deng et al. [13]. Jian. But in case of varying load conditions, VSM gives less reliable result due to its consideration of constant power factor. In another work, voltage stability assessment based on the path of power transmission is formulated by Wang et al. [14]. The degree of voltage stability of power system is shown by voltage collapse proximity index (VCPI_1). This provides better result only if Thevenin’s equivalent impedance of the concerned node, for which VCPI_1 is calculated and considered equal to zero. For a composite load in case of a radial distribution network, a new VSI (VSI_2) is proposed by Chattopadhyay et al. [15]. If the load is less, the value of VSI_2 is also less hence the voltage stability of line is difficult to analyze. The Voltage Stability Margin Index (VSMI) is presented by He et al. [16] for the identification of large scale power system voltage problems. As in this case, line resistance and admittance are neglected, it gives a less reliable result. The concept of local monitoring of voltage collapse and Voltage Stability Load Bus Index (VSLBI) based on PMU is investigated in Milǒsević and Begović [17]. As a large amount of data is retrieved from PMU, the calculation of VSLBI is complex. Next, a VSI for radial distribution networks is presented by Eminoglu and Hocaoglu [18] which is based on transferred real and reactive powers in the network. The computational process used by Eminoglu and Hocaoglu [18] is convoluted because of dependency on large number of parameters. Next, the Line Collapse Proximity Index (LCPI) based on ABCD parameters of the transmission line is investigated by Tiwari et al. [19]. The computational time of LCPI is more for those nodes in power system which has a larger number of connected lines. The limitations of prior indices discussed above are removed by a more accurate line VSI (LVSI) [20]. The LVSI provides a more accurate and faster result due to it is calculated for all the lines simultaneously which is based on the ABCD parameter of line. Mahdad and Srairi [21] discussed MVA margin stability. The calculation of the MVA margin in different system loading conditions is more time-consuming because of involvement of more computational time.
It is reported in the study [6] that faults are considered as the only cause of voltage instability and few VSIs are computed for base loading only. Further, the evaluation of VSIs is not considered in different system loading conditions such as single continuous real and reactive loading, single maximum real and reactive loading, multiple real and reactive load change, etc. with any one reactive power support going off. Also, critical line and node analysis (CLNA) are not discussed in Singh and Tiwari [22] a specific focus on different system conditions based on the values of VSIs. It is also found that contingency analysis (CA) and power margin analysis (PMA) are reported in the studies [19, 20] but only for the base case loading, other loading conditions are not considered.
Thus from the above literature, the effectiveness of the VSIs has been investigated on a standard IEEE-14 bus system under stressed operating conditions (SOCs) like
Bulk variation in inductive loading.
Single line to ground (SLG) fault.
One generation unit tripped (OGT).
As IEEE-14 bus system is the ring main power system which has minimum number of generators compared IEEE-33 bus system and others, the impact on voltage stability will be the greatest in this system. Further, in most of the literature, it is found to have considered IEEE-14 bus system. Therefore, in this paper a standard IEEE-14 bus system is considered. SOCs which are considered are practical disturbances in power system on the basis of their chances to occur simultaneously as compared to normal operating conditions, considered in the literature. Also SOCs are considered on the basis of more chances to occur voltage instability compare to other operating conditions. In this paper, all VSIs of various lines are computed for different loading conditions and SOCs. An analysis of VSIs in SOCs with different system loading conditions is studied. CLNA are done separately for SOCs with different system loading conditions. CA is done for base load as well as pre-specified real and reactive load, multiple real and reactive load and combination of baseload, pre-specified real and reactive load, multiple real and reactive loads and combination of baseload, pre-specified real and reactive load and multiple real and reactive load (mixed load) cases. Power margin (PM) prediction by VSIs is extended in case of single continuous load change and single maximum load change. After discussing all the subcases the most performing VSI in a particular case is judged by accurate prediction of voltage stability and PM prediction. These are the extended contributions of this work which is not been previously reported.
The remaining paper is organized as follows: Section 2 represents mathematical expressions of indices. Problem formulation is discussed in Section 3. The simulation results and their discussion are presented in Section 4 and in Section 5 conclusion is drawn.
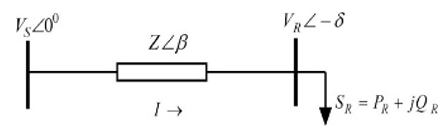
The line VSIs for a two-bus system as represented in Figure 1, are formulated in literature by considering the assumptions. The mathematical expressions of different VSIs obtained from the literature with their assumption and their critical values are listed in Table 1. These expressions are utilized for the calculation of their values in different system conditions. After computation and comparison of VSIs with their critical value for a line, the voltage stability of that line can be ascertained.
Figure 1. Two bus system supplying load through the transmission line [20]
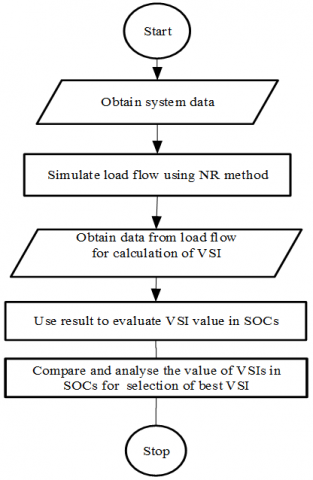
VSIs are computed for various operating conditions like baseload, varying load, and SOCs, on an IEEE 14 bus power system as shown in Figure 2a. The steps for calculation of various VSIs in different loading conditions are illustrated in Figure 2b. System data like resistance and reactance of line, generator real and reactive power, load real and reactive power and transformer parameter are obtained from standard IEEE 14 bus datasheet. The IEEE 14 bus Simulink model is developed with standard values of parameters for transmission lines, generators, transformers and loads in MATLAB. The IEEE 14 bus system is simulated and loadflow analysis is conducted using the Newton-Raphson (NR) method [20] as in the literature. Finally, the system data like sending and receiving end voltages (Vs, Vr), sending end and receiving end active power (Ps, Pr), sending end and receiving end reactive power (Qs, Qr) and power angle (δ) are obtained from load flow report after a successive simulation run as illustrated in Figure 2b. The VSIs for different buses are evaluated using the expression as shown in Table 1, based on system data obtained by load flow. Then the magnitude of VSIs is used to predict the stability condition of bus or line, Mega Volt Ampere (MVA) margin, location for volt-ampere reactive (VAR) compensator and the amount of VAR compensation required. The comparison of VSIs is done for the selection of the appropriate VSI in discussed cases. Table 2 shows the assessment methods, advantage and disadvantage of VSI.
The notation and meaning of different variables which are used in the Table 1 are as follows – sending end and receiving end voltages (VS, VR), sending end and receiving end active powers (PS, PR), sending end and receiving end reactive powers (QS, QR), power angle (δ), line resistance (R), line reactance (X), line impedance (Z), line susceptance (B), phase angle of parameter A (α), phase angle of parameter B (β), impedance angle of line (θ) and voltage difference between sending and receiving end voltages (∆V).
(a) IEEE-14 Bus System [11]
(b) Flow chart of the proposed method
Figure 2. Single line diagram of system and flow chart of the proposed method
Table 1. Expressions for assumed VSI with critical values
|
S. No |
Ref. |
VSI |
CV |
Mathematical Expressions |
Assumption |
|
1 |
1 |
FVSI |
1 |
$F V S I=\frac{4 Z^{2} Q_{R}}{V_{S}^{2} X}$ |
sin δ≈0, cos δ≈1, R sin δ≈0, X cos δ≈X |
|
2 |
2 |
Lmn |
1 |
$L_{m n}=\frac{4 X Q_{R}}{\left(V_{S} \sin (\theta-\delta)\right)^{2}}$ |
Y≈0, Effect of active power neglected |
|
3 |
3 |
LQP |
1 |
$L Q P=4\left(\frac{X}{V_{S}^{2}}\right)\left(Q_{R}+\frac{P_{S}^{2} X}{V_{S}^{2}}\right)$ |
Y≈0, R≈0 |
|
4 |
4 |
LP |
1 |
$L_{P}=\frac{4 R P_{R}}{\left(V_{S} \cos (\theta-\delta)\right)^{2}}$ |
Y≈0, Effect of reactive power neglected |
|
5 |
5 |
NLSI |
1 |
$N L S I=\frac{P_{R} R+Q_{R} X}{0.25 V_{S}^{2}}$ |
Y≈0, δ≈0 |
|
6 |
6 |
VCPI |
1 |
$V C P I(1)=\frac{P_{R}}{P_{R(\max )}}$ |
Constant power factor, Y≈0 |
|
7 |
7 |
NVSI |
1 |
$N V S I=\frac{2 X \sqrt{P_{R}^{2}+Q_{R}^{2}}}{2 Q_{R} X-V_{S}^{2}}$ |
Y≈0, R≈0 |
|
8 |
8 |
VQILine |
1 |
$V Q I_{\text {Line }}=\frac{4 Q_{R}}{|B| V_{S}^{2}}$ |
Y≈0, δ≈0 |
|
9 |
9 |
PTSI |
1 |
$P T S I=\frac{2 S_{R} Z(1+\cos (\theta-\emptyset)}{V_{S}^{2}}$ |
Y≈0 |
|
10 |
10 |
VSI_1 |
0 |
$V S I_{-} 1=\min \left(\frac{P_{m \arg i n}}{P_{\max }}, \frac{Q_{m \arg i n}}{Q_{\max }}, \frac{S_{m \arg i n}}{S_{\max }}\right)$ |
Y≈0, R≈0 |
|
11 |
11 |
VSLI |
1 |
$V S L I=\frac{4\left[V_{S} V_{R} \cos (\delta)-V_{R}^{2} \cos (\delta)\right]}{V_{S}^{2}}$ |
Y≈0 |
|
12 |
13 |
VSMs |
0 |
$V S M_{S}=\frac{S_{C R}-S_{L}}{S_{C R}}$ |
Constant power factor, Y≈0 |
|
13 |
14 |
VCPI_1 |
0 |
$V C P I_{-} 1=V_{R} \cos (\delta)-0.5 V_{S}$ |
Zth(s)≈0 |
|
14 |
15 |
VSI_2 |
1 |
$V S I_{-} 2=\frac{4 Q_{R}(R+X)^{2}}{X\left(V_{S}^{2}+8 R Q_{R}\right)}$ |
Y≈0, δ≈0 |
|
15 |
16 |
VSMI |
0 |
$V S L B I=\frac{V_{R}}{\Delta V}$ |
Y≈0, R≈0 |
|
16 |
17 |
VSLBI |
1 |
$V S L B I=\frac{V_{R}}{\Delta V}$ |
Zth(s)≈0 |
|
17 |
18 |
SI |
0 |
$S I=2 V_{S}^{2} V_{R}^{2}-V_{R}^{4}-2 V_{R}^{2}\left(P_{R} R+Q_{R} X\right)-Z^{2}\left(P_{R}^{2}+Q_{R}^{2}\right)$ |
Y≈0 |
|
18 |
19 |
LCPI |
1 |
$L C P I=\frac{4|A| \cos (\alpha)\left[P_{R}|B| \cos (\beta)+Q_{R}|B| \sin (\beta)\right]}{\left[V_{S} \cos (\delta)\right]^{2}}$ |
Lines are considered as pie modeled |
|
19 |
20 |
LVSI |
1 |
$(L V S I)_{j}=\frac{2 V_{R j} A_{j} \cos \left(\beta_{j}-\alpha_{j}\right)}{V_{S j} \cos \left(\beta_{j}-\delta_{S R j}\right)}$ |
|
Table 2. VSI with assessment method, advantage and disadvantage
|
S. No |
Voltage Stability Index |
Assessment Method |
Advantage and Disadvantage |
|
1 |
Fast Voltage Stability Index (FVSI) |
Run the load flow and with the help of data calculate FVSI. The trends of FVSI profiles were studied by increasing the reactive power loading in stages until the load flow solution fails to give any results. |
It is capable in determining the point of voltage collapse, maximum permissible load, weak bus and the most critical line in interconnected system. FVSI gives inaccurate result in case of real power increment. |
|
2 |
Line Stability Index (Lmn) |
Run the load flow with the help of computer programme and obtain the related data for calculation of Lmn. |
The method used is simple and requires less computational effort. Lmn gives inaccurate result in case of real power increment. |
|
3 |
Line Stability Factor (LQP) |
Run the load flow and with the help of data calculate LQP. The trends of LQP profiles were studied by increasing the constant P-Q loads until the load flow diverges. |
Fast computation and determination of the cause of voltage collapse. Under heavy loading LQP gives a less accurate result. |
|
4 |
Line Stability Index (Lp) |
Computer programme is developed and trends of Lp is studied for constant P-Q loads until the load flow diverges. |
The technique proposed here is quite easy to calculate and can be implemented in practice. Lp gives inaccurate result in case of increased reactive loading. |
|
5 |
Novel Line Stability Index (NLSI) |
Run the load flow and with the help of data calculate NLSI. The trends of NLSI profiles were studied by increasing the active and reactive power loading in stages until the load flow solution fails to give any results. |
This index provides more precise results than those which consider only reactive power. NLSI gives less accurate result as the effect of line admittance is not considered. |
|
6 |
Voltage Collapse Proximity Indicator (VCPI) |
Run the load flow and with the help of data calculate VCPI. |
Fast computation due to less parameter involvement. VCPI gives less accurate result in varying load conditions. |
|
7 |
New Voltage Stability Index (NVSI) |
A fuzzy logic based fast decoupled load flow method has been considered for obtaining data. |
Fast computation due to Fuzzy based load flow. It gives less accurate stability prediction in long transmission line. |
|
8 |
Voltage Reactive Power Index at Line (VQILine) |
Run the load flow and with the help of data calculate VQILine. |
It is accurate, fast, simple, and theoretically proven for calculating voltage stability at each individual line and finding accurate voltage collapse points. In case of more distance from the voltage collapse node, the accuracy level is less in VQILine. |
|
9 |
Power Transfer Stability Index (PTSI) |
The PSAT program is used for the simulations and obtained data is used to calculate PTSI. |
PTSI can be considered to be a more accurate compared to the VCPI. In case of large line admittance, this leads to the poor level of accuracy in the prediction of voltage stability. |
|
10 |
New Online VSI (VSI_1) |
Run the load flow and with the help of data calculate VSI_1. |
The simplicity of the algorithm makes it suitable for online applications. It gives a poor level of accuracy in the prediction of voltage collapse point in in varying power load. |
|
11 |
Voltage Stability Load Index (VSLI) |
Using data from optimally |
It can provide real time measurement. PMUs require different methods for optimal placement which involved in VSLI makes it more complex. |
|
12 |
Voltage Stability Margin (VSM) |
Using data from phasor measurement units (PMU) or load flow VSM is calculated. |
It is very helpful for operator to make decisions before voltage crisis in distribution network. In case of varying load conditions, VSM gives less reliable result. |
|
13 |
voltage collapse proximity index (VCPI_1) |
Run the load flow and with the help of data calculate VCPI_1. |
The method needs not to track the Thevenin equivalent parameters. Therefore, its speed is fast. This provides better result only if Thevenin’s equivalent impedance of the concerned node, for which VCPI_1 is calculated and considered equal to zero. |
|
14 |
New VSI (VSI_2) |
Run the load flow and with the help of data calculate VSI_2. |
It is capable of identifying weakest node of the In case of less load, the value of VSI_2 is also very less hence the voltage stability of line is difficult to analyze. |
|
15 |
Voltage Stability Margin Index (VSMI) |
Run the load flow and with the help of data calculate VSMI. |
The VSMI provides information about the weak locations and also As in this case, line resistance and admittance are neglected, it gives a less reliable result. |
|
16 |
Voltage Stability Load Bus Index (VSLBI) |
Using data from phasor measurement units (PMU) VSM is calculated. |
It can provide real time measurement. As a large amount of data is retrieved from PMU, the calculation of VSLBI is complex. |
|
17 |
Voltage Stability Index (VSI) |
Run the power flow solution of the system and calculate VSI. |
It computes the proximity of the bus which is the most The computational process is complex because of dependency on large number of parameters. |
|
18 |
Line Collapse Proximity Index (LCPI) |
Computer programme is developed and LCPI is calculated. |
It can be used to accurate contingency analysis. The computational time of LCPI is more for those nodes in power system which has a larger number of connected lines. |
|
19 |
Line Voltage Stability Index (LVSI) |
Run the load flow and with the help of data calculate LVSI. |
It may be used to estimate the stability margin MVA margin calculation in different system loading conditions is more time-consuming. |
In this study, bus no 1 is considered as slack bus and as proposed in the IEEE 14 bus system as shown in Figure 2a, whereas, the buses 2, 3, 6, and 8 are considered as PV buses and remaining buses as load buses. The system consists of 20 interconnected lines. Different VSIs are calculated using the data collected from load flow. The test results for different SOCs are presented in the following subsections under this section. VSIs for all the following general loading conditions, as obtained from the literature, are also computed but comparative simulated analyses are done only on the SOCs which are the extended effort of this work. The following are the general loading conditions.
Base loading
Single continuous real load change only
Single continuous reactive load change only
Single continuous real and reactive load change
Single maximum real load change only
Single maximum reactive load change only
Single maximum real and reactive load change
Multiple real load change only
Multiple reactive load change only
Multiple real and reactive load change
Only the considered SOCs are discussed in detail in the following subsections. For the selection of an appropriate VSI in a particular case, first, we should decide the most critical line based on voltage magnitude, active and reactive power margins. The line which has less voltage magnitude and power margin known by the data obtained from load flow analysis. After deciding the most critical line, Table 3 needs to be followed for selecting the most performing VSI in a particular SOC.
4.1 IEEE-14 bus system with an SLG fault in different lines
It is well known that in overhead transmission and distribution of electric power, the probability of fault occurrence is more than underground power dispatch. Type of faults that may occur is a single line to ground fault (SLG), double line to the ground fault, line to line fault and three-line to the ground fault. But due to its highest probability of occurrence, SLG fault is only considered in this work. The following four combinations of loading with SLG fault are considered
SLG fault in different lines one at a time under base case loading
SLG fault in different lines one at a time under single maximum real loading
SLG fault in different lines one at a time under single maximum reactive loading
SLG fault in different lines one at a time under single maximum real and reactive loading
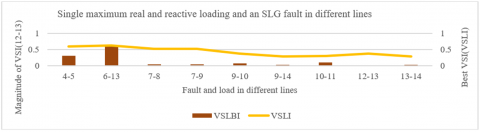
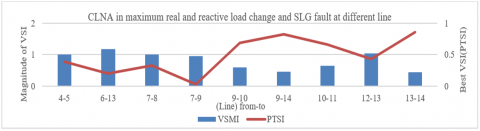
As the last case considered is the most critical above the others in terms of voltage instability, VSI performance is tested for this case only as shown in Figure 3. For any of the other cases, the best VSI may be followed. Figure 3 also shows how the most performing VSI (VSLI) performs for all the lines in the considered system. The best performing VSI is shown as a line chart on the secondary axis. This graphical representation is followed for all the remaining figures representing the best VSI performances.
4.1.1 System for single maximum real and reactive loads with an SLG fault in different lines tested one at a time
When both real and reactive single maximum load changes are considered with different SLG fault location, the range of variation in VSI magnitude is more than only single maximum real load change and less than only single maximum reactive load change as shown in Figure 3. The authors in the studies [11, 18-20, 22] have considered different loading conditions only without any line fault whereas in this work single maximum real and reactive loads with SLG fault in different lines are considered. Further, comparative analysis among various VSIs based on changes in their magnitude is demonstrated as in Figure 3. In this considered case best VSI is found VSLI and shown in the secondary axis in Figure 3.
4.2 System with one reactive power generation unit tripped
Here, one reactive power generation unit is considered absent along with different loading conditions, separately and also with mixed loading conditions. It is considered that node 8 of the IEEE 14-bus system shown in Figure 2a, supply no reactive power. This analysis helps us to know the capability of VSI to predict the voltage stability of the power system. The following combinations of loading are considered.
Base case loading
Base case loading and a single line to ground fault
Single maximum real and reactive load
Multiple real and reactive load
Mix case of the above combination
All the above cases are analyzed as done in section. 4.1. Results of the most critical case, which is the last case considered, in terms of voltage stability is demonstrated in Figure 4. This is discussed in the following subsection under this section. For any other cases, where the voltage degradation is less, in any line than this very case, the best performing VSI of the most critical case may be followed.
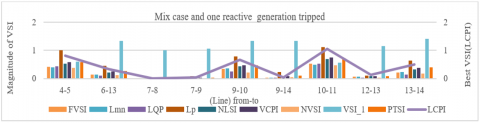
4.2.1 System with mixed loading case and one reactive power generation unit tripped
In a practical power system, consumer loads are usually of different types. Therefore, mixed case loading is considered as an important SOC for testing voltage collapse in lines. In this case, one reactive power support at node 8 is not supplying any reactive power with SLG fault at line 7-8. At Node-4 and node-9, the loads are changed with loading multiplier λ= 0.09 per unit (P.U) [19]. At node-10 single maximum real and reactive loading of 0.81 P.U is considered on the basis of convergence of load flow analysis. All other nodes are maintained at the baseload of the IEEE 14 bus system. Figure 4 represents the variation of VSIs in different lines. This work studied the mixed case loading with one reactive power support tripped. The results shown in Figure 4 compare the best VSI with other VSIs. In this considered case best VSI is found LCPI and shown in the secondary axis in Figure 4. This analysis is compared with similar approach in the literature. Tiwari et al. [19] have considered only the base case loading and heavy reactive loading and compared LCPI with Lmn, LQP, FVSI but didn’t consider the case reactive power support going off.
Critical line and node analysis (CLNA) are discussed by Tiwari et al. [19] but a specific emphasis on it regarding voltage instability is not discovered from the literature. In a power system, CLNA is crucial in deciding on a new load connection, an extension of the power line, location of reactive power compensation and an overall improvement in power quality. Following general loading conditions are considered which are obtained from literature.
Base case loading
Single maximum real loading
Single maximum reactive loading
Single maximum real and reactive loading
Multiple real loading
Multiple reactive loading
Multiple real and reactive loading
Base case loading with an SLG fault
Single maximum real and reactive loading with an SLG fault
Mixed loading case
All the above conditions are considered for testing voltage stability of lines but only results of critical conditions in which more voltage instability occurred are shown in the following subsections under this section.
Table 3. Selection of appropriate VSI
|
S. No |
Case (SOCs) |
Most Critical Line |
Name of VSIs which accurately judge the Line |
Best VSI |
Reason |
|
1 |
Single maximum real and reactive load with an SLG fault in different lines |
6-13 |
VSLI, VSLBI |
VSLI |
1. Magnitude is more close to its critical value. |
|
2 |
Mix loading case and one reactive generation tripped |
10-11 |
FVSI, Lmn, LQP, Lp, NLSI, VCPI, NVSI, VSI_1, LCPI, PTSI |
LCPI |
1. Magnitude is more close to its critical value. |
|
3 |
CLNA in single maximum real and reactive loading |
4-9 |
FVSI, Lmn, LQP, NLSI, VCPI, NVSI, VCPI_1, VSI_2, PTSI |
LQP |
1. Magnitude is not more close to its critical value because the line has some Qreserve and voltage magnitude is not lowest. |
|
4 |
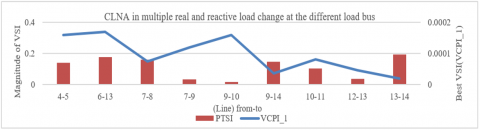
CLNA in multiple real and reactive load change at the different load bus |
13-14 |
VCPI_1, PTSI |
VCPI_1 |
1. Magnitude is more close to its critical value. |
|
5 |
CLNA in maximum real and reactive load change and SLG fault at different line |
13-14 |
VSMI, PTSI |
PTSI |
1. Magnitude is more close to its critical value. |
|
6 |
CLNA in mixed loading case |
10-11 |
FVSI, Lmn, LQP, NLSI, VCPI, NVSI, VSI_1, LCPI, PTSI |
LCPI |
1. Magnitude is more close to its critical value. |
|
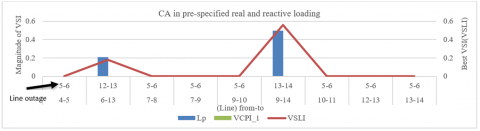
7 |
CA in pre-specified real and reactive loading |
13-14 |
Lp, VSLI, VCPI_1 |
VSLI |
1. Magnitude is more close to its critical value. |
|
8 |
CA in multiple real and reactive loading |
13-14 |
VCPI_1 |
VCPI_1 |
1. Magnitude is more close to its critical value. |
|
9 |
CA in mixed loading case |
5-6 |
FVSI, Lmn, LQP, NLSI, VCPI, NVSI, VSI_2, LCPI, VQILine, PTSI |
LCPI |
1. Magnitude is not more close to its critical value because line has some Qreserve and voltage magnitude is not lowest. |
|
10 |
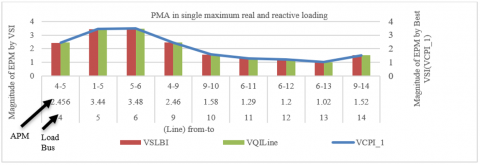
PMA in single maximum real and reactive loading |
- |
VCPI_1, VSLBI, VQILine |
VCPI_1 |
1. Most accurately judge the PMA. |
Figure 3. Graphical representation of VSIs in case of single maximum real and reactive loads with an SLG fault in different lines tested one at a time
Figure 4. Graphical representation of VSIs in case of mixed loading case and one reactive power generation unit tripped
(a) Graphical representation of VSIs with CLNA in single maximum real and reactive loading
(b) Graphical representation of VSIs with CLNA in multiple real and reactive load changes at the different load bus
(c) Graphical representation of VSIs with CLNA in maximum real and reactive load change and SLG fault at different line
(d) Graphical representation of VSIs with CLNA in mixed loading case
Figure 5. Graphical representation of VSIs with CLNA in various loading case
(a) Graphical representation of VSIs with CA in pre-specified real and reactive loading
(b) Graphical representation of VSIs with CA in multiple real and reactive loading
(c) Graphical representation of VSIs with CA in mixed loading case
Figure 6. Graphical representation of VSIs with CA in various loading case
4.3 System with CLNA
Critical line and node analysis (CLNA) are discussed by Tiwari et al. [19] but a specific emphasis on it regarding voltage instability is not discovered from the literature. In a power system, CLNA is crucial in deciding on a new load connection, an extension of the power line, location of reactive power compensation and an overall improvement in power quality. Following general loading conditions are considered which are obtained from literature.
Base case loading
Single maximum real loading
Single maximum reactive loading
Single maximum real and reactive loading
Multiple real loading
Multiple reactive loading
Multiple real and reactive loading
Base case loading with an SLG fault
Single maximum real and reactive loading with an SLG fault
Mixed loading case
All the above conditions are considered for testing voltage stability of lines but only results of critical conditions in which more voltage instability occurred are shown in the following subsections under this section.
4.3.1 System with CLNA in single maximum real and reactive loading
According to the cases considered in Section 4.3.1- 4.3.4, the values of VSI for most stressed lines and nodes are analyzed under different loading conditions. Figure 5a represents the variation in VSI magnitude for different lines. The change in magnitude and the superiority of LQP is shown in Figure 5a on the secondary axis. Further, this work studies single maximum real and reactive loading with CLNA which is a novel contribution of this work not discussed in the studies [1-16, 21-23]. Next, LQP is compared with other VSIs as shown in Figure 5a.
4.3.2 System with CLNA in multiple real and reactive load changes at the different load bus
Figure 5b represents the variation of VSIs magnitude for a different line. The simulated result validates VCPI_1 dominance and variation as plotted in Figure 5b on the secondary axis. Moreover, this work put efforts to study with CLNA in multiple real and reactive load changes at the different load bus, compare with other VSIs which is a novel contribution of this work not discussed in the studies [1-16, 21-23].
4.3.3 System with CLNA in maximum real and reactive load change and SLG fault at different line
Figure 5c represents the variation of VSIs magnitude for a different line. The simulated result validates the PTSI dominance and Variation as plotted in Figure 5c on the secondary axis. Additionally, this work put efforts to study with CLNA in maximum real and reactive load change and SLG fault at different lines, compare with other VSIs which is a novel contribution of this work not discussed in the studies [1-16, 21-23].
4.3.4 System with CLNA in mixed loading case
Figure 5d represents the variation of VSIs magnitude for a different line. The simulated result validates the LCPI dominance and Variation as plotted in Figure 5d on the secondary axis. Additionally, this work put efforts to study with CLNA in mixed loading cases at different lines, compare with other VSIs which is a novel contribution of this work not discussed in the studies [1-16, 21-23].
4.4 System with CA
As found from literature, that single line contingency analysis (CA) is done under base case loading only [19, 20] by removing one line at a time. From the solution of power flow study, all the VSIs are evaluated. For this analysis, four loading combinations are considered out of which three new loading cases with CA are considered as the novel work is done.
Base case loading
Pre-specified real and reactive loading
Multiple real and reactive loading
Mixed loading case
The effects of all the aforementioned loading cases are analyzed but only the results of novel loading cases which are more harmful in terms of voltage degradation, are described in the following subsections.
4.4.1 System with CA in pre-specified real and reactive loading
A condition of line outages with the respective stressed line is analyzed in this section under prespecified real and reactive loading (section 3.1.7). A similar type of analysis is done for multiple real and reactive loadings and for the mixed loading case. In this case, at node 6 prespecified real and reactive powers with value 1.74 P.U are considered. Figure 6a represents the variation of VSIs for different lines of the IEEE 14 bus system. The result also confirms the superiority and change in the magnitude of VSLI shown on the secondary axis in Figure 6a.
4.4.2 System with CA in multiple real and reactive loading
In this particular case, multiple real and reactive loads are considered with loading multiplier for which load flow is converged such as λ= 1.52 P.U at nodes 4, 5, 6, 9, 10, 11, 12, 13 and 14 of the considered system. Figure 6b represents the variation of VSIs for different lines. The simulated result validates VCPI_1 dominance and variation as plotted in Figure 6b on the secondary axis.
4.4.3 System with CA in mixed loading case
In the mixed loading case, load at node 6 is 1.74 P.U pre-specified loads are considered, with loading multiplier λ= 1.52 P.U at nodes 4, 5, 9, 10, 11, 12, 13 and 14 loads considered and the rest of the load are set at base case load. Figure 6c represents the variation of VSIs for different lines. In this considered case best VSI is found LCPI and shown in the secondary axis in Figure 6c.
4.5 System with PMA
Power margin analysis (PMA) of a line is done by different VSI for different loading conditions. By adding more loading cases the capability of power margin prediction by VSI is explored. The following are the general loading conditions considered (4).
Base loading
Single continuous real load change only
Single continuous reactive load change only
Single continuous real and reactive load change
Single maximum real load change only
Single maximum reactive load change only
Single maximum real and reactive load change
Multiple real load change only
Multiple reactive load change only
Multiple real and reactive load change
We go through all subcases but only simulated results of PMA in single continuous real and reactive loading are shown in the following subsections under this section. Other subcases are analyzed in a similar manner.
4.5.1 System with PMA in single continuous real and reactive loading
In this case, a single maximum real and reactive load changes at the different lines are considered and VSIs for those lines are calculated. For different values of VSI, the power margin is calculated as per [20]:
(1-VSIM)×MPM{when VSI value is less than 0.5} (1)
(VSIM) × MPM {when VSI value is greater than 0.5} (2)
Figure 7. Graphical representation of VSIs with PMA in single continuous real and reactive loading
In Eqns. (1) and (2), VSIM stands for VSI magnitude and MPM stands for maximum power margin. A similar type of analysis is done for the other cases with only the loading conditions being changed as discussed in section 4.5. In Figure 7, APM stands for actual power margin and EPM stands for evaluated power margin. This figure represents the variation of power margin by VSI magnitudes for different lines. In this considered case best VSI is found VCPI_1 and shown in the secondary axis in Figure 7.
In section 4.3.2, 4.4.2 and 4.5.1 the best performing VSI is VCPI_1 because real and reactive load change considers with multiple, single maximum, CLNA, CA, and PMA. The best performing VSI is found LCPI in section 4.2.1, 4.3.4, and 4.4.3 due to the consideration of mixed loading cases with OGT, CLNA, and CA. Section 4.1.1 and 4.4.1 shows that the VSLI is best performing VSI as real and reactive load change with single maximum, pre-specified, SLG and CA. After discussing all the cases it is observed that the best performing VSI is not changed if the base loading case is not changed and other auxiliary cases like CLNA, CA, PMA, OGT, and SLG are varying.
In this paper, VSIs of different lines in an IEEE 14 bus system has been examined under different stressed operating conditions of the lines. These are - base case loading, single continuous load change, single maximum load change, multiple load change, pre-specified real and reactive load change, single line to ground fault, one reactive power generation unit tripped and mixed loading case. Such system conditions are used for the selection of appropriate VSI based on its performance in a particular stressed operating condition of the lines/buses. The performance parameters of VSIs chosen are the magnitude of VSIs, the effect of loading on VSIs, effect of single line to ground fault on VSIs, the effect of any one reactive support going off on VSIs, critical line and node analysis, contingency analysis and accurate power margin prediction of lines. The graphical outputs clearly give the information of VSI on the basis of accuracy and effectiveness in the detection of voltage instability of lines during various changes in system conditions. The results show the capability of a specific VSI for a specific discussed case on different lines. Therefore, for a particular system condition, the performance of different VSIs for all lines needs to be referred from the concerned results given in the tabular form Table 3. Some new cases like the variation in inductive loading, Single line to ground (SLG) fault, One generation unit tripped (OGT) and variation of best performing VSI with respect to line are analyzed in the work which is not reported earlier but which is helpful to analyze the VSI behavior in more stringent line conditions with multiple causes of disturbances. The best performing VSI varies with respect to parameter and line which is a extended contribution and justified in section 4.1.1, 4.2.1, 4.3.1-4.3.4, 4.4.1-4.4.3 and 4.5.1. From the discussed cases it is found that the most performing VSI is not changed if the base loading case is same and other parameters like OGT, CA, CLNA, SLG, and PMA are altered. This work could be extended further towards analyzing the effects of all these conditions in larger IEEE bus systems.
[1] Musirin, I., Rahman, T.A. (2002). Novel fast voltage stability index (FVSI) for voltage stability analysis in power transmission system. Student Conference on Research and Development, Shah Alam, Malaysia, pp. 265-268. https://doi.org/10.1109/SCORED.2002.1033108
[2] Moghavvemi, M., Omar, F.M. (1998). Technique for contingency monitoring and voltage collapse prediction. IEE Proceedings-Generation, Transmission and Distribution, 145(6): 634-640. https://doi.org/10.1049/ip-gtd:19982355
[3] Chebbo, A.M., Irving, M.R., Sterling, M.J.H. (1992). Voltage collapse proximity indicator: Behaviour and implications. In IEE Proceedings C (Generation, Transmission and Distribution), 139(3): 241-252. https://doi.org/10.1049/ip-c.1992.0037
[4] Moghavvemi, M., Faruque, M.O. (2001). Technique for assessment of voltage stability in ill-conditioned radial distribution network. IEEE Power Engineering Review, 21(1): 58-60. https://doi.org/10.1109/39.893345
[5] Yazdanpanah-Goharrizi, A., Asghari, R. (2007). A novel line stability index (NLSI) for voltage stability assessment of power systems. In Proceedings 7th WSEAS Int. Conf. on Power Systems, pp. 164-167.
[6] Moghavvemi, M., Faruque, O. (1998). Real-time contingency evaluation and ranking technique. IEE Proceedings-Generation, Transmission and Distribution, 145(5): 517-524. https://doi.org/10.1049/ip-gtd:19982179
[7] Kanimozhi, R., Selvi, K. (2013). A novel line stability index for voltage stability analysis and contingency ranking in power system using fuzzy based load flow. Journal of Electrical Engineering & Technology, 8(4): 694-703. https://doi.org/10.5370/JEET.2013.8.4.694
[8] Althowibi, F.A., Mustafa, M.W. (2010). Line voltage stability calculations in power systems. 2010 IEEE International Conference on Power and Energy, Kuala Lumpur, pp. 396-401. https://doi.org/10.1109/PECON.2010.5697616
[9] Nizam, M., Mohamed, A., Hussain, A. (2006). Dynamic voltage collapse prediction in power systems using power transfer stability index. 2006 IEEE International Power and Energy Conference, Putra Jaya, pp. 246-250. https://doi.org/10.1109/PECON.2006.346655
[10] Gong, Y., Schulz, N., Guzman, A. (2006). Synchrophasor-based real-time voltage stability index. 2006 IEEE PES Power Systems Conference and Exposition, Atlanta, GA, pp. 1029-1036. https://doi.org/10.1109/PSCE.2006.296452
[11] Makasa, K.J., Venayagamoorthy, G.K. (2011). On-line voltage stability load index estimation based on PMU measurements. 2011 IEEE Power and Energy Society General Meeting, Detroit, MI, USA, pp. 1-6. https://doi.org/10.1109/PES.2011.6039882
[12] Maharjan, R., Kamalasadan, S. (2015). Voltage stability index for online voltage stability assessment. 2015 North American Power Symposium (NAPS), Charlotte, NC, pp. 1-6. https://doi.org/10.1109/NAPS.2015.7335245
[13] Deng, P., Sun, Y., Xu, J. (2009). A new index of voltage stability considering distribution network. 2009 Asia-Pacific Power and Energy Engineering Conference, Wuhan, pp. 1-4. https://doi.org/10.1109/APPEEC.2009.4918070
[14] Wang, L., Liu, Y., Luan, Z. (2005). Power transmission paths based voltage stability assessment. 2005 IEEE/PES Transmission & Distribution Conference & Exposition: Asia and Pacific, Dalian, pp. 1-5. https://doi.org/10.1109/TDC.2005.1546950
[15] Chattopadhyay, T.K., Banerjee, S., Chanda, C.K. (2014). Impact of distributed generator on voltage stability analysis of distribution networks under critical loading conditions. In 2014 1st International Conference on Non Conventional Energy (ICONCE 2014), pp. 288-291. https://doi.org/10.1109/ICONCE.2014.6808728
[16] He, T., Kolluri, S., Mandal, S., Galvan, F., Rasigoufard, P. (2004). Identification of weak locations in bulk transmission systems using voltage stability margin index. In IEEE Power Engineering Society General Meeting, pp. 1814-1819. https://doi.org/10.1109/PES.2004.1373193
[17] Milǒsević, B., Begović, M. (2003). Voltage-stability protection and control using a wide-area network of phasor measurements. IEEE Transactions on Power Systems, 18(1): 121-127. https://doi.org/10.1109/TPWRS.2002.805018
[18] Eminoglu, U., Hocaoglu, M.H. (2007). A voltage stability index for radial distribution networks. 2007 42nd International Universities Power Engineering Conference, Brighton, pp. 408-413. https://doi.org/10.1109/UPEC.2007.4468982
[19] Tiwari, R., Niazi, K.R., Gupta, V. (2012). Line collapse proximity index for prediction of voltage collapse in power systems. International Journal of Electrical Power & Energy Systems, 41(1): 105-111. https://doi.org/10.1016/j.ijepes.2012.03.022
[20] Ratra, S., Tiwari, R., Niazi, K.R. (2018). Voltage stability assessment in power systems using line voltage stability index. Computers & Electrical Engineering, 70: 199-211. https://doi.org/10.1016/j.compeleceng.2017.12.046
[21] Mahdad, B., Srairi, K. (2018). A new interactive sine cosine algorithm for loading margin stability improvement under contingency. Electrical Engineering, 100(2): 913-933. https://doi.org/10.1007/s00202-017-0539-x
[22] Singh, P., Tiwari, R. (2018). Distributed parameter-based voltage stability index for identification of critical lines and voltage stability margin in power system. Cogent Engineering, 5(1): 1515573. https://doi.org/10.1080/23311916.2018.1515573
[23] Billinton, R., Acharya, J.R. (2006). Weather-based distribution system reliability evaluation. IEE Proceedings-Generation, Transmission and Distribution, 153(5): 499-506. https://doi.org/10.1049/ip-gtd:20050427