Shanti Wahyuni Megasari*![]() | Reni Suryanita
| Reni Suryanita![]() | Antonius
| Antonius![]()
© 2025 The authors. This article is published by IIETA and is licensed under the CC BY 4.0 license (http://creativecommons.org/licenses/by/4.0/).
OPEN ACCESS
Geopolymer is an inorganic polymer formed from aluminosilicate material in fly ash from coal combustion waste, which is activated using sodium silicate and potassium hydroxide. This study utilized fly ash type F waste and coconut fiber sourced from local plantations. A series of tests were conducted to optimize the mechanical performance of compressive strength, flexural strength, and tensile strength of geopolymer mortar with different fiber content (0%, 0.25%, 0.5%, 0.75%, 1%, 1.5%, 1.75%, 2.00%) and aspect ratio of coconut fiber waste (L/D = 100, 200, 300). The mixture composition used an aggregate to fly ash ratio of 65%:35%, a fly ash to alkali ratio of 62%:38%, and a Na₂SiO₃ to KOH ratio of 2:1. The results showed that the addition of coconut fiber increased the compressive, flexural, and tensile strength and optimal performance was observed at a certain fiber content. However, excessive fibers reduce the mechanical performance of geopolymer mortar. This study offers an alternative to develop environmentally friendly mortars based on waste materials and promotes the use of natural fibers. Fiber-reinforced geopolymers show good resistance to acidic, sulfate, high-temperature, and chemical environments, exhibiting low shrinkage, improved ductility, better microcrack resistance, and better mechanical performance that contribute to sustainable construction practices.
geopolymer mortar, fly ash, compressive strength, flexural strength, coconut fiber, geopolymer model
Joseph Davidovits first coined the idea of a geopolymer for an alkaline binder of aluminosilicate in 1976 [1]. A geopolymer is a type of inorganic polymer that is formed through the polymerization of aluminosilicate materials containing silicon (SI), and aluminum (AI) in an alkaline environment. These materials typically include natural minerals like kaolinite or industrial by-products such as fly ash and slag. The process involves the activation of these materials with alkaline solutions (like sodium hydroxide or potassium hydroxide) to create a three-dimensional network of silicate and aluminate structures. Alumina-silicate oxides (Af+ in V-fold coordination) react chemically with a/kali polysilicates during geopolymerization to form polymeric Si-0-Al bonds; the resulting three-dimensional silico-aluminate structures range from amorphous to semi-crystalline and are of the Poly(sialate) type (-Si-O-Al-0-), Poly(sialate-siloxo) type (-Si-O-AlO-Si-0-), and Poly(sialate-disiloxo) type (-Si-O-Al-O-Si-O-Si-0-).
According to ACI 116R-00, fly ash is the result after the combustion of milled or powdered coal, the finely ground residue is transported to the particle removal system by waste gas from the combustion area [2]. Fly ash is in the ASTM class F category, where the material can be used as an alternative additive to improve mortar performance. Fly ash is ash with pozzolanic properties produced from the combustion of anthracite coal at a temperature of 1560℃ [3]. In a study conducted, to evaluate high-calcium fly ash-based geopolymer mortar reinforced with natural fibers, namely sisal fiber and coconut fiber, where the amount of fiber added was 0%, 0.5%, 0.75%, and 1.0% by volume, the test results showed that the flexural tensile strength and splitting tensile strength of the geopolymer mortar tended to increase with increasing fiber content [4]. Although the flexural tensile strength and splitting tensile strength increased with increasing fiber content, 1.00% fiber content was the limit because the workability of mixes with fiber content above 1.00% was low and the mixes were difficult to cast. 1.00% volume fraction is low and the mix is difficult to cast and compact. The flexural strength range of geopolymer mortars reinforced with natural fibers (SF and CF) was 5.3-6.6 MPa, higher than that of CGM (3.1 MPa) and geopolymer mortars reinforced with synthetic fibers or GF (3.1-3.7 MPa). This is due to the longer and larger dimensions of the natural fibers (SF and CF), flexural strength also increased with increasing fiber proportion, with the highest flexural to compressive strength ratio reaching 26.8% at 100% coconut fiber. The addition of coconut fiber to geopolymer mortars did not result in an increase in compressive strength. Instead, the compressive strength tended to decrease as the fiber content increased. The test results showed that the compressive strength of geopolymer mortar with natural fibers decreased as the amount of fiber added increased.
The combination of water glass and hydroxide was determined to be the best activator in terms of compressive strength, although this may vary depending on the precursor. 10 M potassium or sodium hydroxide proved to be the most effective activator for fly ashes [5].
In the study [6], the addition of bamboo fiber and toothpicks to the fiber concrete mixture has an impact on the mechanical properties of the concrete. The variations in the addition of bamboo fiber and toothpicks are 0.5%, 1%, 1.5%, and 2% with a fiber length of 25mm. The results of the study showed that the maximum compressive strength occurred with the addition of toothpick fiber with a percentage of 1% of 34.90 MPa. However, in the variations of 1.5% and 2% there was a decrease because the higher the percentage of fiber added, the more difficult it is for the concrete to be mixed properly, which has an impact on the difficulty of compaction. This can cause the formation of cavities in the concrete mixture that is not fully compacted, so that the concrete becomes less dense and reduces its compressive strength [7].
The selected fibers were treated with a 5% concentration alkali solution to improve their performance. Kenaf fiber, coconut fiber, oil palm fiber, class C fly ash, anhydrous sodium metasilicate (SMA) (53.00% SiO2 and 46.00% Na2O3), granite, granular blast furnace slag (GGBS), and river sand were the main materials used in this study. The flexural strength, splitting tensile strength and MOE were improved by incorporating 0.75% natural fibers into one-part geopolymer concrete [8]. One-part geopolymer concrete reinforced with kenaf, coconut and palm fiber showed an increase in flexural strength from 4.93 MPa to 7.87 MPa, 4.11 MPa to 6.04 MPa, and 4.02 MPa to 5.85 MPa, split tensile strength of one-part geopolymer concrete reinforced with kenaf, coconut and palm fiber increased from 3.3 MPa to 4.95 MPa, 3.25 MPa to 4.37 MPa, 2.95 MPa to 3.79 MPa, and MOE of one-part geopolymer concrete reinforced with kenaf, coconut and palm fiber increased from 37.77 GPa to 44.04 GPa, 37.77 GPa to 42.79 GPa, and 37.77 GPa to 39.61 GPa. However, the compressive strength and workability of geopolymer concrete slightly decrease with increasing fiber content. Scanning Electron Microscope (SEM) Definition Results shows how well the fibers fill the voids and cracks of the bridge in one-part geopolymer concrete [9].
The study [10] was conducted to determine the effect of adding coconut fiber to the concrete mixture on flexural strength, compressive strength, and split tensile strength. Fiber variations of 0.1, 0.2, 0.3, 0.4, 0.5, and 0.6% (weight) of the source material in the hybrid specimen. The compressive strength test was carried out on a mold size of 150 × 150 × 150 mm, the flexural strength test was carried out on a mold size of 150 × 150 × 700 mm, and the split tensile strength test was carried out on a mold size of 150 × 300 mm and will be tested at the age of 28 days. The test results showed that the compressive strength increased significantly by 5.13% and 5.6% after 7 and 28 days, respectively with a coconut fiber content of 0.2% of the binder and at a percentage of 0.4, its strength showed a decrease of 0.42% and 0.7% respectively for seven and twenty-eight days. The tensile strength and flexural separation increased when the amount of coconut fiber used was 0.2% thereafter.
In a study [11], the use of fiber can increase the compressive strength value. The test was carried out by making 15 test specimens for 3 variations where each variation was added with coconut fiber as much as 0.125%, 0.250% and 0.500% of the volume of the test specimen, where the test specimen will be tested at the age of 28 days. The test results showed that the addition of coconut fiber as much as 0.125% produced a compressive strength of 244.84 kg/cm2, for the addition of 0.250% fiber obtained a compressive strength of 184.327 kg/cm2. while for the addition of 0.50% produced a compressive strength of 272.14 kg/cm2, the results obtained the largest increase in concrete compressive strength occurred in concrete with the addition of 0.5% coconut fiber, which increased by 30% (272.14 kg/cm2) compared to normal concrete (210.06 kg/cm2). And there was a decrease in the addition of 0.25% fiber by 12% (184.33 kg/cm2), an increase in compressive strength of 16.56% and 29.55% from normal concrete.
The study was conducted to determine the effect of adding coconut fiber to the concrete mixture on flexural strength, compressive strength, and split tensile strength. Fiber variations of 0.1, 0.2, 0.3, 0.4, 0.5, and 0.6% (weight) of the source material in the hybrid specimen. The compressive strength test was carried out on a mold size of 150 × 150 × 150 mm, the flexural strength test was carried out on a mold size of 150 × 150 × 700 mm, and the split tensile strength test was carried out on a mold size of 150 × 300 mm and will be tested at the age of 28 days. The test results showed that the compressive strength increased significantly by 5.13% and 5.6% after 7 and 28 respectively with a coconut fiber content of 0.2% of the binder and at a percentage of 0.4, its strength showed a decrease of 0.42% and 0.7% respectively for seven and twenty-eight days. The tensile strength and flexural separation increased when the amount of coconut fiber used was 0.2% thereafter.
In this study, fiber variations of 0%, 0.25%, 0.5%, 0.75%, 1%, 1.25%, 1.50%, 1.75%, and 2.00% by weight of fly ash were used, with the aspect ratio (L/D) of coconut fiber waste set at 100, 200, and 300. The binder uses 100% fly ash as the basic material which comes from coal combustion waste using an alkali solution, namely KOH, to be able to react the polymerization process in geopolymer mortar. Cube test specimens with dimensions of 100 × 100 × 100 mm were used for compressive strength testing. Compressive strength testing was used at the age of 28 days with room temperature treatment.
The hypothesis in the study is that the utilization of coconut fiber waste with certain content variations and length ratios can improve the mechanical properties of geopolymer mortar, especially compressive strength, splitting tensile strength and flexural strength. This study also explores a prediction model to identify the optimal composition.
2.1 Materials
The main material used in this research was fly ash and coconut fiber. The fly ash used was taken from Tenayan Raya PLTU, Pekanbaru city, to determine the chemical and physical parameters of the fly ash content. The X-ray fluorescence (XRF) testing was performed at the chemistry laboratory of Padang State University.
Fine aggregate with a maximum particle size of 4.76 mm, either natural or processed. Processed fine aggregate is produced by crushing rocks and separating the particles through screening. To be used as an ingredient in geopolymer mortar mixing, fine aggregate must meet specification standards. Preliminary tests conducted on fine aggregate include water content testing, mud content testing, specific gravity testing, volumetric gravity testing, organic content testing, and sieve analysis testing.
Coconut fibers of varying lengths were used in this research. The fibers were obtained from coconut plantation waste in Indonesia. The dried coconut fibers were first cleaned to remove any attached husk, then measured and cut according to the required length variations. To determine the maximum load, strength, and strain, the coconut fibers were subjected to a tensile test.
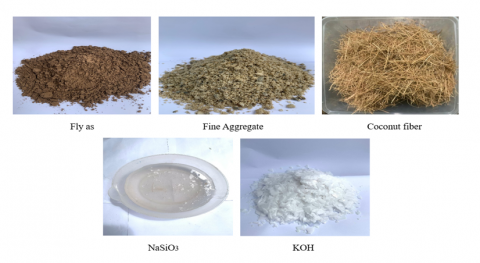
The raw materials were then activated by adding sodium silicate (Na₂SiO₃) and sodium hydroxide (NaOH) in a 2:1 ratio by weight of the binder. The components used to produce the geopolymer mortar include fine aggregate, fly ash, sodium hydroxide (NaOH), and sodium silicate (Na₂SiO₃). These materials are shown in Figure 1.
Figure 1. Geopolymer mortar material
2.2 Mix design
Coconut fiber fibers with aspect ratio of coconut fiber waste L/D of 100, 200, 300 were used with a percentage of 0%, 0.25%, 0.5%, 0.75%, 1%, (by weight of fly ash) Where the use of fibers in the mortar mixture can increase resistance to shock loads, shear strength, resistance to shrinkage, and fatigue resistance. 65% fine aggregate and 35% binder with fly ash, 62% binder as a substitute for cement and 38% alkali with a ratio of SS / SH 2: 1 using Na2SiO3 and KOH. The testing stage begins with testing the properties of fine aggregate, active X-Ray Fluorescence (XRF) of fly ash, and compressive strength testing. The concentration of the activator is calculated as the weight of alkali according to the ratio (SS = 2% and SH = 1%).
The compressive strength is calculated using Eq. (1)
$\sigma=\frac{\mathrm{P}_{\mathrm{maks}}}{A}$ (1)
where, σ is the compressive strength of the concrete (N/mm²), Pmaks is the maximum load (N), and A is the loaded surface area (mm²).
The split tensile strength of the specimen is determined using Eq. (2)
$\sigma_1=\frac{2 \mathrm{P}}{\pi \cdot l \cdot d}$ (2)
where, $\sigma_1$ is the splitting tensile strength (Mpa), P is the load at split time (N), L is the length (mm), and d is the diameter of test specimen (mm).
For flexural strength testing, it is determined using Eq. (3)
$\sigma_1=\frac{\mathrm{P} . \mathrm{L}}{\mathrm{b} . \mathrm{h}^2}$ (3)
where, $\sigma_1$ is the flexural strength of test specimen (MPa), P was the highest load read on the testing machine, L was the distance between two supports (mm), B was the width of the horizontal fracture cross section (mm), and H was the width of vertical direction fracture cross section (mm).
2.3 Preparation of test specimen
First, distilled water is mixed into potassium hydroxide (KOH) so that the KOH dissolves. After that, both solutions are added to sodium silicate (Na2SiO3), which is mixed until dissolved in one container. Mix the fine aggregate (passing sieve no. 4) and fly ash using a concrete mixer, then add coconut fiber to the mixture gradually until the mixture is even. After that, mix the alkali activator that has been dissolved with distilled water in a container into the concrete mixer gradually until homogeneous. Concrete mixers are used in the laboratory to prepare fresh mortar. The preparation of testing, including material procurement, preparation of testing instruments, and preliminary testing of materials.
Geopolymer specimen molds are used to produce mortar specimens in the form of cubes to be tested for compressive strength with a diameter of 50×50×50 mm with the number of test specimens for each variation being 6 test specimens and the total number of test specimens being 114, beam specimens to be tested for bending with a diameter of 150×150×600 mm with the number of test specimens for each variation being 3 test specimens and the total number of test specimens being 21, and cylindrical specimens to be tested for acoustics with a diameter of 98.0 mm and a height of 50 mm. The modulus test specimen mold was a cylinder with dimensions of 15 cm × 30 cm, with the number of test specimens for each variation being 3 test specimens and the total number of test specimens being 30.
2.4 Testing method
2.4.1 Compressive strength
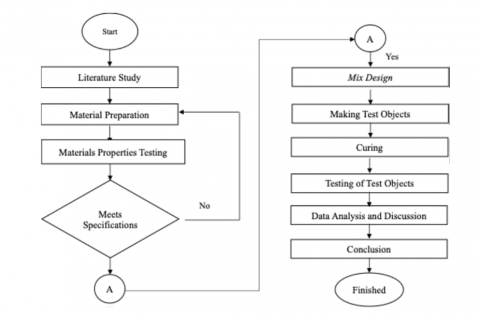
Compressive strength is one of the main properties in measuring the mechanical properties of building materials. The compressive strength of cubic specimens was determined using digital compression machine. Test specimens: A total of 6 cube samples measuring 100 × 100 × 100mm at each variation of fiber 0%, 0.25%, 0.5%, 0.75% and 1% (from the weight of fly ash). Figure 2 illustrates the details of experimental work from literature studies on coconut fiber geopolymer mortar to testing and analysis. Table 1 shows the recapitulation of geopolymer mortar mix requirements.
2.4.2 Flexural strength
Specimens tested for flexural strength was determined digital concrete beam, the test specimen was in the form of a block mold sample with dimensions of 150 × 600 mm.
2.4.3 Splitting tense strength
The splitting tensile strength test of geopolymer mortar uses a digital compression testing machine using a load-bearing steel bearing. The specimen tested is a cylindrical sample with a diameter of 15 and a height of 30 cm.
Figure 2. Research flow chart diagram
Table 1. Recapitulation of geopolymer mortar mix requirements
|
Testing Method |
Percentage Variation |
Final Aggregate |
Fly Ash |
Koh |
Na2Sio3 |
Aquadest |
Coconut Fiber |
|
(%) |
(Kg) |
(Kg) |
(Kg) |
(Kg) |
(Kg) |
(Kg) |
|
|
Compressive strength |
0.00 |
8.58 |
2.86 |
0.59 |
1.17 |
1.02 |
0.000 |
|
0.25 |
8.58 |
2.86 |
0.59 |
1.17 |
1.02 |
0.007 |
|
|
0.50 |
8.58 |
2.86 |
0.59 |
1.17 |
1.02 |
0.014 |
|
|
0.75 |
8.58 |
2.86 |
0.59 |
1.17 |
1.02 |
0.021 |
|
|
1.00 |
8.58 |
2.86 |
0.59 |
1.17 |
1.02 |
0.029 |
|
|
1.25 |
8.58 |
2.86 |
0.59 |
1.17 |
1.02 |
0.036 |
|
|
1.50 |
8.58 |
2.86 |
0.59 |
1.17 |
1.02 |
0.043 |
|
|
1.75 |
8.58 |
2.86 |
0.59 |
1.17 |
1.02 |
0.050 |
|
|
2.00 |
8.58 |
2.86 |
0.59 |
1.17 |
1.02 |
0.057 |
|
|
Flexural strength |
0.00 |
57.92 |
19.33 |
3.95 |
7.90 |
6.87 |
0.000 |
|
0.25 |
57.92 |
19.33 |
3.95 |
7.90 |
6.87 |
0.048 |
|
|
0.50 |
57.92 |
19.33 |
3.95 |
7.90 |
6.87 |
0.097 |
|
|
0.75 |
57.92 |
19.33 |
3.95 |
7.90 |
6.87 |
0.145 |
|
|
1.00 |
57.92 |
19.33 |
3.95 |
7.90 |
6.87 |
0.193 |
|
|
1.25 |
57.92 |
19.33 |
3.95 |
7.90 |
6.87 |
0.242 |
|
|
1.50 |
57.92 |
19.33 |
3.95 |
7.90 |
6.87 |
0.290 |
|
|
1.75 |
57.92 |
19.33 |
3.95 |
7.90 |
6.87 |
0.338 |
|
|
2.00 |
57.92 |
19.33 |
3.95 |
7.90 |
6.87 |
0.387 |
|
|
Tensile strength |
0.00 |
22.73 |
7.59 |
1.55 |
3.10 |
2.07 |
0.000 |
|
0.25 |
22.73 |
7.59 |
1.55 |
3.10 |
2.07 |
0.019 |
|
|
0.50 |
22.73 |
7.59 |
1.55 |
3.10 |
2.07 |
0.038 |
|
|
0.75 |
22.73 |
7.59 |
1.55 |
3.10 |
2.07 |
0.057 |
|
|
1.00 |
22.73 |
7.59 |
1.55 |
3.10 |
2.07 |
0.076 |
|
|
1.25 |
22.73 |
7.59 |
1.55 |
3.10 |
2.07 |
0.095 |
|
|
1.50 |
22.73 |
7.59 |
1.55 |
3.10 |
2.07 |
0.114 |
|
|
1.75 |
22.73 |
7.59 |
1.55 |
3.10 |
2.07 |
0.133 |
|
|
2.00 |
22.73 |
7.59 |
1.55 |
3.10 |
2.07 |
0.152 |
Initial material testing was carried out on the fly ash and coconut fiber used, including X-ray Fluorescence (XRF) testing on fly ash, and fiber tensile testing on coconut fiber, SEM analysis was also performed on the geopolymer mortar samples, with magnification to see the particles scattered on the samples.
3.1 Fly ash
Fly ash has been utilized in the removal of toxic materials, organic and inorganic compounds, and dyes in wastewater treatment. Additionally, it has the potential to offer beneficial applications in the construction industry, particularly in the manufacture of cement and concrete. Fly ash has been incorporated into cement in a reduced nanosized form to ensure durability and minimize the pore size of concrete to withstand adverse environments. Zeolite synthesis is a prominent and effective method for fly ash applications. Furthermore, fly ash has been employed for the purpose of ameliorating degraded soil [12, 13].
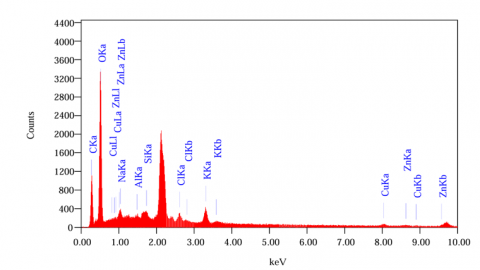
X-ray Fluorescence (XRF) testing is a methodical approach that aims to identify the elements present in a given sample. X-Ray Fluorescence (XRF) is a non-destructive analysis method used to determine the chemical composition of a solid sample. In this process, the fly ash sample is shot with primary X-rays, which will cause the elements in the sample to emit secondary X-rays or fluorescence. Each element produces its own characteristic energy, so that its concentration can be identified and measured based on the energy spectrum produced.
General steps of XRF testing include:
The fly ash used in this study was obtained from coal combustion in a Steam Power Plant. The results are in the form of a table of chemical composition (in %) of various oxides in the sample. The outcomes of the aforementioned testing are presented in Table 2. The analysis revealed that the composition of the fly ash material is dominated by oxides, specifically silicon oxide (SiO₂), with a percentage content of approximately 35.777%, followed by calcium oxide (CaO), aluminum oxide (Al₂O₃), and ferric oxide (Fe₂O₃), with percentage content ranging from 10-30%. The Si/Al ratio in fly ash will affect the speed and quality of geopolymerization reaction. Chemical and Mechanical Resistance depends on the content of CaO and SO₃ which will affect sulfate resistance and dimensional stability. The results of the XRF testing are presented in Table 2.
Table 2. X-ray fluorescence (XRF) test results
|
Compound |
Contents (%) |
|
Al2O3 |
14.338 |
|
SiO2 |
35.777 |
|
SO3 |
1.211 |
|
CaO |
10.824 |
|
Fe2O3 |
29.546 |
|
K2O |
1.735 |
|
TiO2 |
1.929 |
|
MnO |
0.402 |
|
P2O5 |
2.629 |
|
SrO |
0.267 |
|
Rb2O |
0.022 |
|
Y2O3 |
0.027 |
|
ZnO |
0.111 |
|
PbO |
0.022 |
|
Ag2O |
0.394 |
|
Eu2O3 |
0.299 |
|
In2O3 |
0.200 |
Based on the tests carried out, it shows that the fly ash content, SiO2 + Al2O3 + Fe2O3 ≥ 50%, 35.777% + 14.338 + 29.546 ≥ 50%, 79.662% > 50%, SO3 ≤ 5% 1.211% < 5%, CaO ≤ 18% 10.824% < 18%. The classification of fly ash classes based on chemical specifications can be concluded in the XRF test results obtained where the fly ash used is class F fly ash [8].
3.2 Coconut fiber
Coconut fiber is one of the strongest fibers among other fibers; coconut fiber can also be used as a concrete mixture to increase the strength of concrete. Because this fiber is one of the strongest fibers among natural fibers, it can be used in concrete mixtures to increase the resistance of concrete. They are also lightweight and readily available so they can be used in concrete reinforcement. The addition of coconut fiber significantly improves the engineering properties of concrete, such as tensile strength and flexural strength. According the study [14], tensile strength testing which is carried out with two methods, namely single fiber testing and composite fiber testing [3].
The coconut fiber used has undergone fiber tensile testing. When the fiber content is increased, the splitting tensile strength increases by a maximum of 5%. When the fiber content increases after this value, there is a decrease in tensile stress. This is due to the fact that tensile failure occurs due to the disruption of atoms and molecules in the concrete. When adding fibers, the fibers act as bonds that bind them together. The test results can be seen in Table 3, Table 4, Figure 3, and Figure 4.
Table 3. Single coconut fiber tensile test result
|
Testing |
Result |
|
Max load |
92 N |
|
Strength |
36.22 N/mm2 |
|
Gauge |
60 mm |
|
max disp |
28.923 mm |
|
Strain |
48.21 % |
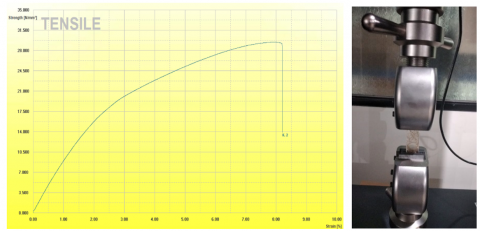
In Table 3, it can be seen that the results of the single fiber tensile test, with a fiber length of 60 mm, obtained a maximum load of 92 N, with a strength of 36.22 N/mm², a maximum Disp of 28.923 mm, and a strain of 48.21%. The test result graph can be seen in Figure 3.
Figure 3. Graph of tensile test results of single coconut fiber
Figure 4. Tensile test result graph of coconut fiber composite
Table 4 shows the results of tensile testing of composites on coconut fiber with a fiber length of 40 mm, obtained a maximum load of 3238 N, with a strength of 29,436 N/mm2, maximum Disp of 3,284 mm, and a strain of 8.21%. The graph of the test results can be seen in Figure 4.
Table 4. Tensile test result of coconut fiber composite
|
Testing |
Result |
|
Max load |
3238 N |
|
Strength |
29.436 N/mm2 |
|
Gauge |
40 mm |
|
max disp |
3.284 mm |
|
Strain |
8,21 % |
3.3 Scanning electron microscope (SEM)
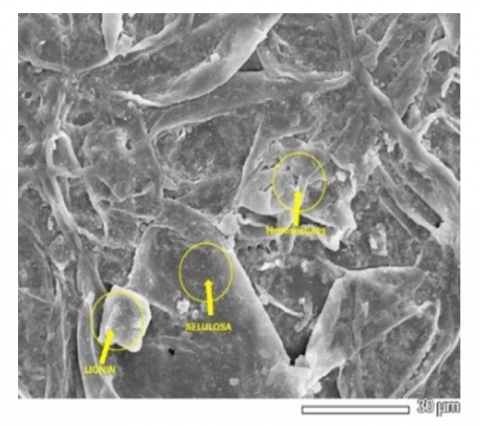
The characterization of the surface shape of the coconut fiber material is achieved through the use of a scanning electron microscope (SEM). The SEM, classified as a type of electron microscope, functions by means of analyzing the surface of the material using an electron beam [14]. The underlying principle of the SEM is that the surface of the material, when illuminated by electrons, will reflect the electron beam in all directions. Among these reflected beams, the electron beam with the highest intensity is detected by the detector incorporated within the SEM apparatus. The analysis process utilizes the Energy Dispersive X-ray Spectrometry (EDX) method to observe the morphological shape of the specimen surface. The results can be found in Figure 5 and Figure 6.
Based on the SEM results with a magnification of 300× in Figure 6, the morphological shape of a single coconut fiber can be observed, where there is a layer of lignin and hemicellulose that coats the cellulose attached to the surface of the coconut fiber, where a similar morphological shape is also obtained in previous research [15].
3.4 Compressive strength
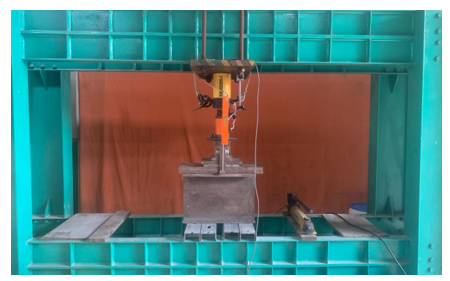
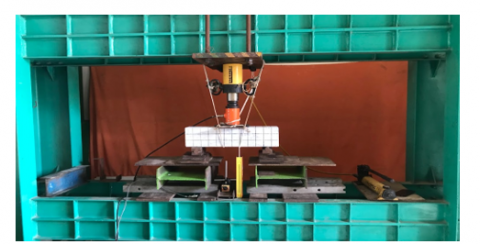
The compressive strength of mortar is the maximum load with a unit area of a cube-shaped mortar test object with a certain size and age. The compressive strength test on geopolymer mortar aims to determine the quality of the mortar in withstanding the load in units of kg/cm2. Compressive strength testing was carried out on mortar specimens with dimensions of 100 mm × 100 mm × 100 mm consisting of 6 specimens in each variation. The compressive strength of mortar is measured using a standard method, where the testing machine gradually applies a compressive load to the concrete sample until the material is damaged. The compressive strength test can be seen in Figure 7.
Figure 7. Geopolymer mortar compressive strength testing
The compressive strength testing is carried out on six cube samples, where the average of the compressive strength results is taken on the six cube samples, the results of the geopolymer mortar compressive strength test with a fiber mixture of 0%, 0.25%, 0.5%, 0.75% ,1%, 1.25%, 1.5%, 1.75%, 2.00% with a aspect ratio of coconut fiber waste L/D of 100, 200, 300 can be seen in Table 5. The compressive strength graph can be seen in Figure 8 and the visual appearance of the compressive strength test can be seen in Figure 9.
Table 5. Results of compressive strength testing of geopolymer mortar after 28 days
|
Percentage Variation |
L/D |
Compressive Strength |
|
|
|
|
MPa |
Kg/cm2 |
|
0 |
- |
9.28 |
94.73 |
|
|
100 |
11.82 |
118.15 |
|
0.25 |
200 |
10.04 |
99.07 |
|
|
300 |
9.20 |
91.96 |
|
|
100 |
12.65 |
126.48 |
|
0.5 |
200 |
10.00 |
100.20 |
|
|
300 |
8.89 |
88.90 |
|
|
100 |
12.87 |
128.74 |
|
0.75 |
200 |
10.02 |
99.97 |
|
|
300 |
8.51 |
85.13 |
|
|
100 |
12.86 |
128.64 |
|
1,00 |
200 |
9.70 |
96.98 |
|
|
300 |
7.80 |
77.99 |
|
|
100 |
12.39 |
123.88 |
|
1,25 |
200 |
9.22 |
92.23 |
|
|
300 |
7.23 |
72.28 |
|
|
100 |
11.51 |
115.07 |
|
1,5 |
200 |
8.61 |
86.10 |
|
|
300 |
5.80 |
58.00 |
|
|
100 |
10.10 |
101.00 |
|
1,75 |
200 |
8.29 |
82.87 |
|
|
300 |
5.33 |
53.33 |
|
|
100 |
9.82 |
98.20 |
|
2,00 |
200 |
8.20 |
81.97 |
|
|
300 |
4.37 |
43.73 |
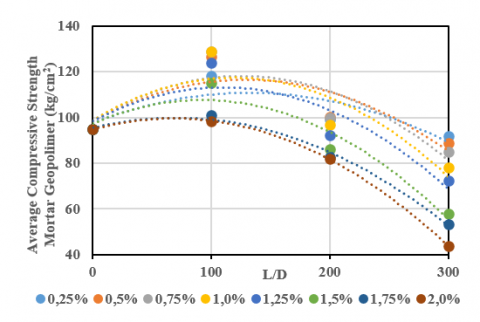
Based on the results of experimental testing in the laboratory obtained using second-order polynomial regression. The correlation coefficient (r) was obtained close to the value of 1, namely 0.9197 at L/D = 100, 0.9136 at L/D = 200 and 0.9752 at L/D = 300. Figure 10 shows the relationship between the addition of coconut fiber and the average compressive strength value.
Figure 8. Compressive strength graph
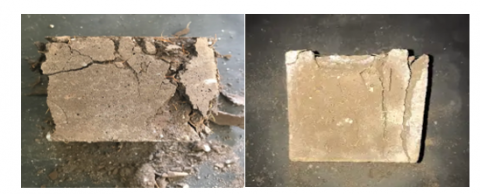
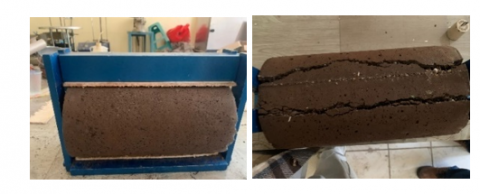
Figure 9. Visual appearance of geopolymer specimens after compressive strength test
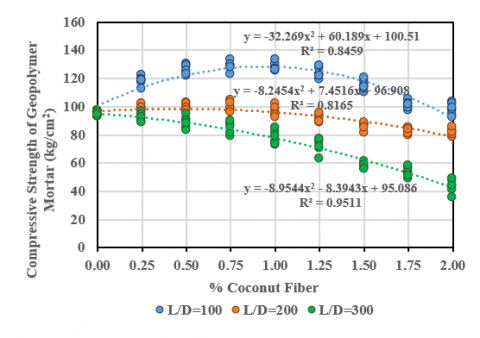
The compressive strength values can be predicted using the resulting y equation, and the x variable, namely the variation of % coconut fiber, this regression equation can be used to predict the compressive strength value of the test specimen, it can be seen in the graph above the specimen for the test object with L/D100, the equation y = -32.296x2 + 60.198x + 100,51, with an R2 value of 0.8459 and the largest compressive strength is at a variation of 0,75% addition of coconut fiber with an average compressive strength of 12,87 Mpa, however for L/D 200, obtained the equation y = -8.2454x2 + 7.4516x + 96.908 with an R2 value of 0.8165 the highest compressive strength was at 0,5 % addition of coconut fiber with average highest compressive strength 10,00 Mpa, and for the test specimen with L/D 300 was found that the specimen with addition of L/D 300 coconut fiber has shown no improvement at all, with the equation y = -8.9544x2 - 8.3943x + 95.086 with an R2 value of 0.9511. It can be observed that all percentage of coconut fiber with L/D=100 has the highest compressive strength value and can increase the compressive strength value of geopolymer mortar compared with no coconut fiber and with L/D=200 and L/D=300. The addition of coconut fiber by 0.25%; 0.5%; 0.75%; 1.0%; 1.25%; 1.50%; 1.75% and 2.0% can increase the compressive strength value of geopolymer mortar by 24.71%; 33.51%; 35.90%; 35.79%; 30.77%; 21.47%; 6.62% and 3.66% compared to without coconut fiber. In Figure 10 it can also be observed that the greater the L/D or the length of the coconut fiber, the lower the compressive strength value obtained.
The results of this study are in line with previous studies which reported that the addition of natural fibers such as hemp to geopolymer mortar can increase compressive strength to a certain level, but experience a decrease in strength at higher fiber content due to clumping and uneven fiber distribution [11].
The model of the relationship between the compressive strength of geopolymer mortar and the variation of coconut fiber length based on the experimental test results in the laboratory was obtained using 2nd order polynomial regression. The correlation coefficient (r) value was obtained close to the value of 1, namely 0.8035 at 0.25%, 0.8230 at 0.50%, 0.8494 at 0.75%, 0.8785 at 1.0%, 0.8979 at 1.25%, 0.9618 at 1.50%, 0.9969 at 1.75% and 0.9996 at 2.0%. This value shows that there is a very strong positive relationship between the percentage of coconut fiber and the compressive strength value where the correlation coefficient value is between 0.80-1.00. Figure 10 shows the relationship model of geopolymer mortar compressive strength.
Based on the relationship model obtained from the compressive strength value of geopolymer mortar with L/D variation of coconut fiber at 0.25%; 0.5%; 0.75%; 1.0%; 1.25%; 1.50%; 1.75% and 2.0%, it can be estimated the optimum value of L/D fiber that can produce the maximum compressive strength value.
Figure 10. Relationship model of geopolymer mortar compressive strength with variation of coconut fiber length
3.5 Flexural strength
Flexural strength geopolymer mortar test results with fibers, flexural strength is the ability of a material to withstand a load that causes bending. It is measured by testing a specimen subjected to a load at a specific point, usually the center, to determine how much the material can flex before failure. Flexural strength is important for materials that will experience tensile or flexural loads in structural applications [16]. Flexural strength testing was carried out on mortar specimens with dimensions of 150 mm × 150 mm × 600 mm consisting of 3 specimens for each variation. Flexural strength testing can be seen in Figure 11. The results of the geopolymer mortar flexural strength test with a mixture of 0%, 0.25%, 0.5%, 0.75% and 1% fibers with a length of 25 mm (L/D 100), 50 mm (L/D 200), 75 mm (L/D 300) can be seen in Table 6 and testing on flexural strength test specimens can be seen in Figure 11.
Figure 11. Geopolymer mortar flexural strength testing
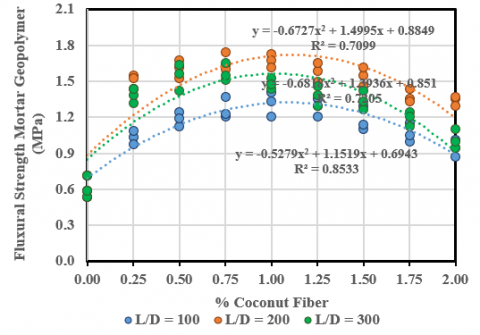
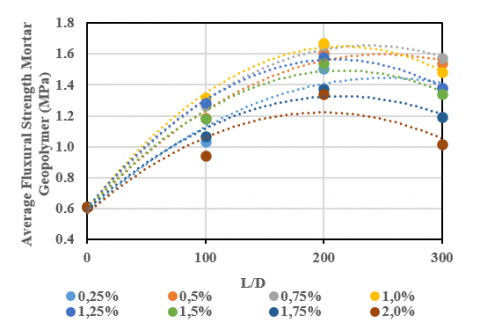
The results of the flexural strength test in Table 6, in the variation of the addition of coconut fiber waste with L/D 100, the average largest flexural strength 1.32 MPa at 1% fiber content, at L/D 200 the highest average flexural strength is 1.67 MPa at a variation of 1% fiber addition, for the variation with L/D 300 the average maximum flexural strength is 1.57 MPa with a variation of 0.75% fiber. The relationship between the percentage variation in each L/D with the flexural strength of geopolymer mortar can be seen in Figure 12.
Figure 12. Flexural strength graph
Table 6. Geopolymer mortar results
|
Percentage Variation (%) |
L/D |
Average Flexural Strength (MPa) |
|
0 |
- |
0.61 |
|
|
100 |
1.03 |
|
0.25 |
200 |
1.51 |
|
|
300 |
1.38 |
|
0.5 |
100 |
1.19 |
|
200 |
1.61 |
|
|
300 |
1.54 |
|
|
|
100 |
1.27 |
|
0.75 |
200 |
1.66 |
|
|
300 |
1.57 |
|
|
100 |
1.32 |
|
1.00 |
200 |
1.67 |
|
|
300 |
1.48 |
|
|
100 |
1.29 |
|
1.25 |
200 |
1.58 |
|
|
300 |
1.38 |
|
|
100 |
1.18 |
|
1.50 |
200 |
1.54 |
|
|
300 |
1.34 |
|
|
100 |
1.07 |
|
1.75 |
200 |
1.37 |
|
|
300 |
1.19 |
|
|
100 |
0.94 |
|
2.00 |
200 |
1.34 |
|
|
300 |
1.01 |
The addition of natural fibers such as sisal and coconut to geopolymer mortar has been proven to significantly enhance flexural strength. Typical values increased from approximately 3.1 MPa in control specimens to between 5.3 and 6.6 MPa, and even up to around 7.0 MPa at optimal fiber dosages (approximately 0.6–1% by volume). This improvement is attributed to the fibers’ effectiveness in bridging cracks and facilitating stress transfer within the matrix [17].
Based on the graph of the relationship between the addition of coconut fiber and flexural strength in Figure 12, the equation y obtained can be used as a basis for predicting Flexural strength values outside the variations used and R2 or the coefficient of determination can explain how much the ability of variable x, namely the variation in % coconut fiber, to explain the value of the dependent variable or y. The known regression equation can be used for the purpose of predicting or estimating the relationship between one variable and another, specimen for test object with L/D 200, obtained the equation y = -0,6727x2 + 1.4995x + 0,8849 with an R2 value of 0,7099 and the highest average flexural strength is in the variation of 1% fiber at 1,67 Mpa, in the flexural test specimen with L/D 300, it can be seen with the equation y = -0.6818x2 + 1.3936x + 0.851 with an R2 value of 0.7205, the highest average flexural strength is 1.57 Mpa, in the variation of adding 0,75% coconut fiber, and for the test object specimen L/D 100, obtained the equation y = - 0.5279x2 + 1.1519x + 0.6943x obtained an R2 value of 0.8533, with the highest average flexural strength found in the 1%, at 1.32 Mpa, The addition of coconut fiber with L/D=100 at 1.0% can increase the flexural strength value of geopolymer mortar up to 115.53% compared to that without coconut fiber. The addition of coconut fiber with L/D = 200 at 1.00% can increase the flexural strength value of geopolymer mortar up to 173.79% compared to that without coconut fiber. Meanwhile, the addition of coconut fiber with L/D = 300 of 0.75% can increase the flexural strength value of geopolymer mortar up to 157.28% compared to that without coconut fiber. The same thing is also seen in the addition of fiber length listed as L/D shows the greater the L/D of coconut fiber, the higher the flexural strength value obtained until getting the optimum point, then if you increase the L/D of coconut fiber, the flexural strength value will decrease, Figure 12 shows the relationship model of flexural strength of geopolymer mortar with variation of coconut fiber lengths, the visual appearance of mortar geopolymer mortar can be seen in Figure 13 and Figure 14 shows relationship model of flexural strength of geopolymer mortar with variation in length of coconut fiber.
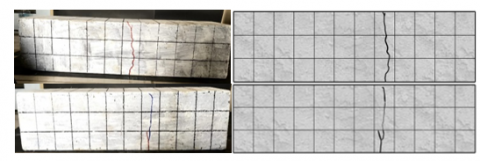
Figure 13. Visual appearance of geopolymer specimens after compressive flexural strength testing
Figure 14. Relationship model of flexural strength of geopolymer mortar with variation in length of coconut fiber
The model of the relationship between the flexural strength of geopolymer mortar and the variation of coconut fiber length based on the experimental test results in the laboratory was obtained using second-order polynomial regression. The correlation coefficient (r) values were obtained close to the value of 1, namely 0.9778 at 0.25%, 0.9956 at 0.50%, 0.9982 at 0.75%, 0.9985 at 1.0%, 0.9995 at 1.25%, 0.9934 at 1.50%, 0.9907 at 1.75% and 0.9403 at 2.0%. This value shows that there is a very strong positive relationship between the percentage of coconut fiber and the flexural strength value where the correlation coefficient value is between 0.80-1.00.
Based on the relationship model obtained from the flexural strength value of geopolymer mortar with variations in L/D of coconut fiber at 0.25%; 0.5%; 0.75%; 1.0%; 1.25%; 1.50%; 1.75% and 2.0%, it can be estimated the optimum value of L/D fiber that can produce the maximum flexural strength value.
3.6 Tensile strength
The tensile strength is a measure of the strength of concrete caused by a force that tends to separate part of the concrete or mortar due to pulling. Direct tensile strength testing aims to determine the tensile strength of the test object at the planned ratio [10]. The splitting tensile strength of mortar measured with a force to determine the splitting tensile strength limit of the test object is called splitting tensile strength. After being hardened, this mortar test object is placed parallel to the surface of the test object. The strength of the force that tends to separate part of the mortar due to pulling is called tensile strength. Direct tensile strength testing in mortar to determine the quality of the mortar from its direct tensile strength. The results of the geopolymer mortar splitting tensile strength test with a fiber mixture of 0%, 0.25%, 0.5%, 0.75%, 1%, 1.25%, 1.5%, 1.75% and 2% with L/D 100, 200 and 300 can be seen in Table 7 and the test on the tensile strength test object can be seen in Figure 15.
Figure 15. Geopolymer mortar split tensile strength testing
Table 7 summarizes the results obtained from the tensile testing of geopolymer mortar with different length of coconut fiber. The tensile strength values are also presented in Table 7. It should be noted that the values indicated in the tables are the average value obtained from three tested samples of test specimen. Figure 16 shows flexural strength graph.
Incorporating natural fibers such as sisal and coconut into geopolymer mortar has consistently demonstrated an enhancement in splitting tensile strength, with values ranging from approximately 2.2 to 3.3 MPa depending on the fiber type and dosage, in contrast to 1.5 to 2.5 MPa observed in control specimens [17].
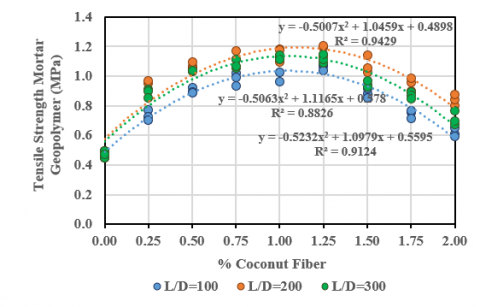
From Figure 16, it was noticed that the variation of with L/D 200 has the highest tensile strength among all, at 1.25% addition of coconut fiber with highest average tensile strength 1.18 MPa, it can be determined using equation y = -0.5007x2 + 1.0459x + 0.4898 with R2 value of 0.9429, with a difference of 143.96% compared to a geopolymer mortar with no fiber content. However, at L/D 300 highest average tensile strength was 1.13 MPa at the addition of 1% coconut fiber, it obtained equation y = -0.5063x2 + 1.1165x + 0.578 with coefficient of determination R2 = 0.8826, for the L/D 300 the highest tensile strength was 1,13 MPa, at 1% addition of fiber, the equation y = -0.5232x2 + 1.0979x + 0.5595 with R2 value of 0.9124.
Figure 16. Tensile strength graph
Table 7. Tensile strength test results
|
Percentage Variation (%) |
L/D |
Average Tensile Strength (MPa) |
|
0.00 |
- |
0.47 |
|
|
100 |
0.73 |
|
0.25 |
200 |
0.94 |
|
|
300 |
0.89 |
|
|
100 |
0.90 |
|
0.50 |
200 |
1.07 |
|
|
300 |
1.04 |
|
|
100 |
0.98 |
|
0.75 |
200 |
1.12 |
|
|
300 |
1.08 |
|
|
100 |
1.04 |
|
1.00 |
200 |
1.15 |
|
|
300 |
1.13 |
|
|
100 |
1.06 |
|
1.25 |
200 |
1.18 |
|
|
300 |
1.12 |
|
|
100 |
0.88 |
|
1.50 |
200 |
1.08 |
|
|
300 |
0.95 |
|
|
100 |
1.06 |
|
1.75 |
200 |
0.95 |
|
|
300 |
0.87 |
|
|
100 |
1.06 |
|
2.00 |
200 |
0.84 |
|
|
300 |
0.71 |
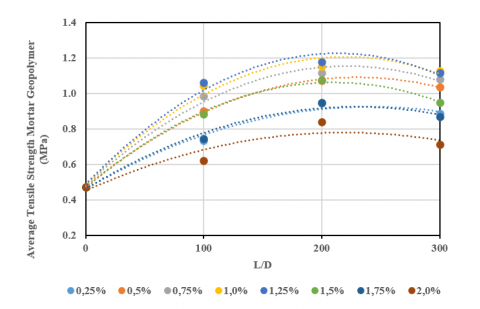
The relationship model of split tensile strength of geopolymer mortar with variation of coconut fiber length based on experimental test results in the laboratory was obtained using 2nd order polynomial regression. The correlation coefficient (r) was obtained close to the value of 1, namely 0.9914 at 0.25%, 0.9997 at 0.50%, 0.9959 at 0.75%, 0.9916 at 1.0%, 0.9933 at 1.25%, 0.9986 at 1.50%, 0.9915 at 1.75% and 0.9370 at 2.0%. This value shows that there is a very strong positive relationship between the percentage of coconut fiber and the split tensile strength value where the correlation coefficient value is between 0.80-1.00. Figure 17 shows relationship model of split tensile strength of geopolymer mortar with variation in length.
Figure 17. Relationship model of tensile strength of geopolymer mortar with variation in length of coconut fiber
Figure 18. Relationship between compressive strength and flexural strength of geopolymer mortar with L/D 100
Figure 19. Relationship between compressive strength and flexural strength of geopolymer mortar with L/D=200
Figure 20. Relationship between compressive strength and flexural strength of geopolymer mortar with L/D 300
Based on the relationship model obtained from the split tensile strength value of geopolymer mortar with varying percentage of coconut fiber at L/D = 100, L/D = 200 and L/D = 300, it can be estimated that the optimum value of fiber percentage that can produce the maximum split tensile strength value.
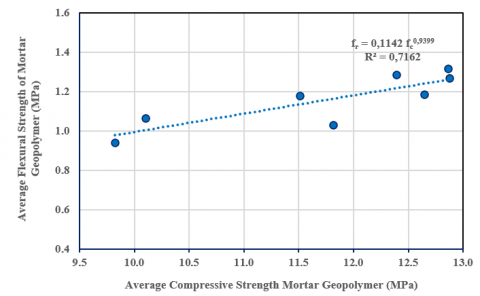
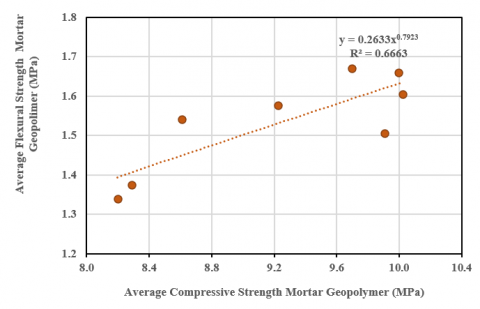
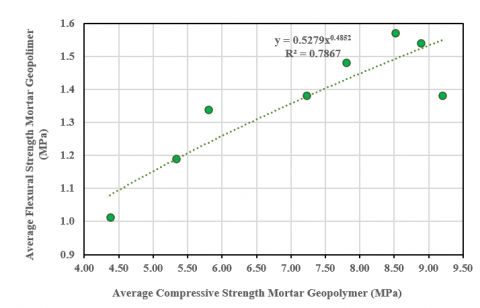
3.7 Relationship between compressive strength and flexural strength of geopolymer mortar
The relationship between compressive strength and flexural strength of geopolymer mortar with varying fiber length and fiber percentage is presented in Figure 18 for L/D=100, Figure 19 for L/D=200 and Figure 20 for L/D=300.
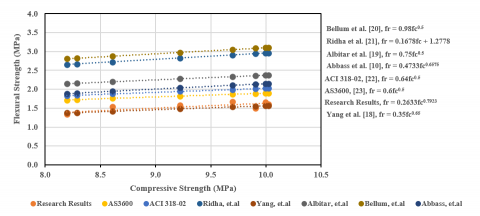
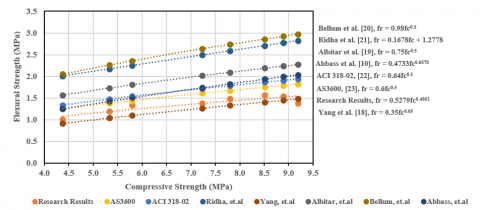
The recapitulation of the relationship model between compressive strength and flexural strength of geopolymer mortar for L/D 100 correlation model obtained fr = 0.1142 fc0.9399, with a coefficient of determination (r2) is 0.7162 with a correlation coefficient (r) is 0.8463. For L/D 200 relationship model obtained the equation fr = 0.2633fc0,7923, with coefficient of determination (r2) is 0.6663, with a correlation coefficient (r) of, 0.8163. For L/D 300 relationship model obtained the equation fr = 0.5279fc0,4852 with coefficient of determination (r2) is 0.7867 with a correlation coefficient (r) of 0.8870. The coefficient of determination (r2) and correlation coefficient (r) values greater than 0.8 indicate that there is a valid relationship with the regression equation.
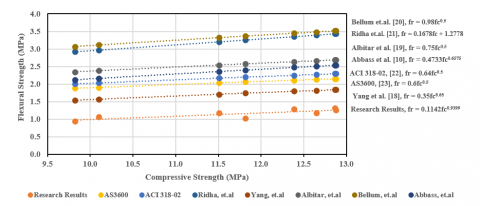
The relationship between compressive strength and flexural strength of geopolymer mortar with the addition of coconut fiber is similar to the results of researches [18-23]. The relationship between compressive strength and flexural strength of geopolymer mortar with the addition of coconut fiber shows a non-linear relationship using power regression or a stepwise regression model, except for the formula produced by the study [20] which uses linear regression.
The results of the relationship between the compressive strength and flexural strength of geopolymer mortar with the addition of coconut fiber at L/D = 100, L/D = 200, and L/D = 300 in this study and several previous studies show a directly proportional relationship. The lower the compressive strength of the geopolymer mortar with coconut fiber, the lower the flexural strength obtained. Although at L/D = 200 and L/D = 300, the flexural strength of the geopolymer mortar increased with the addition of coconut fiber until it reached an optimum value and then decreased. However, the coefficient of determination (r2) and correlation coefficient (r) values greater than 0.8 indicate the appropriate regression selection. Comparisons of the compressive strength and flexural strength models of geopolymer mortar with fiber addition can be seen in Table 8 and Figure 21 for L/D = 100, Table 9 and Figure 22 for L/D = 200, and Table 10 and Figure 23 for L/D = 300.
Table 8. Comparison of model relationship of compressive strength and flexural strength of geopolymer mortar with L/D=100
|
Experimental Results |
Model Relationship |
|||||||
|
Compressive Strength (MPa) |
Flexural Strength (MPa) |
[22] |
[23] |
[18] |
[19] |
[20] |
[21] |
[10] |
|
11.82 |
1.03 |
2.20 |
2.06 |
1.74 |
2.58 |
3.37 |
3.26 |
2.40 |
|
12.65 |
1.19 |
2.28 |
2.13 |
1.82 |
2.67 |
3.49 |
3.40 |
2.51 |
|
12.87 |
1.27 |
2.30 |
2.15 |
1.84 |
2.69 |
3.52 |
3.44 |
2.54 |
|
12.86 |
1.32 |
2.30 |
2.15 |
1.84 |
2.69 |
3.51 |
3.44 |
2.54 |
|
12.39 |
1.29 |
2.25 |
2.11 |
1.80 |
2.64 |
3.45 |
3.36 |
2.48 |
|
11.51 |
1.18 |
2.17 |
2.04 |
1.71 |
2.54 |
3.32 |
3.21 |
2.36 |
|
10.10 |
1.07 |
2.03 |
1.91 |
1.57 |
2.38 |
3.11 |
2.97 |
2.17 |
|
9.82 |
0.94 |
2.01 |
1.88 |
1.55 |
2.35 |
3.07 |
2.93 |
2.13 |
Figure 21. Comparison of model relationship of compressive strength and flexural strength of geopolymer mortar with L/D=100
Table 9. Comparison of model relationship of compressive strength and flexural strength of geopolymer mortar with L/D=200
|
Experimental Results |
Model Relationship |
|||||||
|
Compressive strength (MPa) |
Flexural strength (MPa) |
[22] |
[23] |
[18] |
[19] |
[20] |
[21] |
[10] |
|
9.91 |
1.51 |
2.03 |
1.90 |
1.57 |
2.38 |
3.11 |
2.96 |
2.16 |
|
10.02 |
1.61 |
2.02 |
1.90 |
1.56 |
2.37 |
3.10 |
2.96 |
2.15 |
|
10.00 |
1.66 |
2.03 |
1.90 |
1.57 |
2.37 |
3.10 |
2.96 |
2.15 |
|
9.70 |
1.67 |
1.99 |
1.87 |
1.53 |
2.34 |
3.05 |
2.91 |
2.11 |
|
9.22 |
1.55 |
1.94 |
1.82 |
1.48 |
2.28 |
2.98 |
2.83 |
2.04 |
|
8.61 |
1.47 |
1.88 |
1.76 |
1.42 |
2.20 |
2.88 |
2.72 |
1.95 |
|
8.29 |
1.37 |
1.84 |
1.73 |
1.38 |
2.16 |
2.82 |
2.67 |
1.90 |
|
8.20 |
1.34 |
1.83 |
1.72 |
1.37 |
2.15 |
2.81 |
2.65 |
1.89 |
Figure 22. Comparison of model relationship of compressive strength and flexural strength of geopolymer mortar with L/D=200
Table 10. Comparison of model relationship of compressive strength and flexural strength of geopolymer mortar with L/D=300
|
Experimental Results |
Model Relationship |
|||||||
|
Compressive Strength (MPa) |
Flexural Strength (MPa) |
[22] |
[23] |
[18] |
[19] |
[20] |
[21] |
[10] |
|
9.20 |
1.,38 |
1.94 |
1.82 |
1.48 |
2.27 |
2.97 |
2.82 |
2.04 |
|
8.89 |
1.54 |
1.91 |
1.79 |
1.45 |
2.24 |
2.92 |
2.77 |
1.99 |
|
8.51 |
1.57 |
1.87 |
1.75 |
1.41 |
2.19 |
2.86 |
2.71 |
1.93 |
|
7.80 |
1.48 |
1.79 |
1.68 |
1.33 |
2.09 |
2.74 |
2.59 |
1.83 |
|
7.23 |
1.38 |
1.72 |
1.61 |
1.27 |
2.02 |
2.63 |
2.49 |
1.74 |
|
5.80 |
1.34 |
1.54 |
1.45 |
1.10 |
1.81 |
2.36 |
2.25 |
1.50 |
|
5.33 |
1.19 |
1.48 |
1.39 |
1.04 |
1.73 |
2.26 |
2.17 |
1.42 |
|
4.37 |
1.01 |
1.34 |
1.25 |
0.91 |
1.57 |
2.05 |
2.01 |
1.25 |
Figure 23. Comparison of model relationship of compressive strength and flexural strength of geopolymer mortar with L/D=300
3.8 Relationship between compressive strength and tensile strength of geopolymer mortar
The relationship between compressive strength and split tensile strength of geopolymer mortar with varying fiber length and fiber percentage is presented in Figure 24 for L/D=100, Figure 25 for L/D=200 and Figure 26 for L/D=300.
Figure 24. Comparison of model relationship of compressive strength and tensile strength of geopolymer mortar with L/D=100
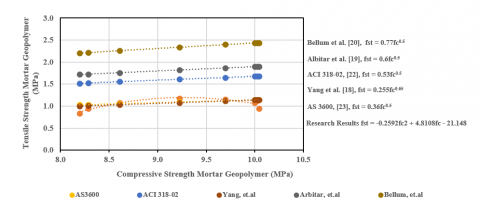
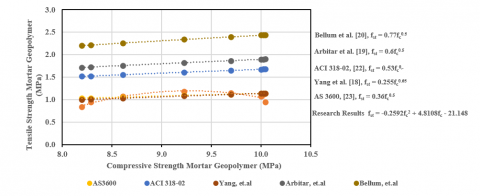
Figure 25. Comparison of model relationship of compressive strength and tensile strength of geopolymer mortar with L/D=200
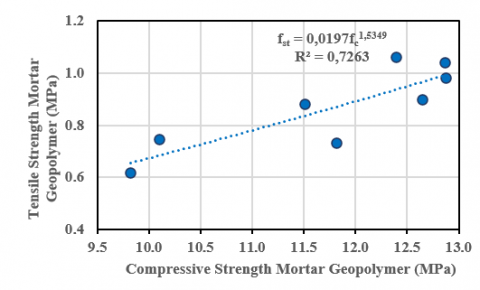
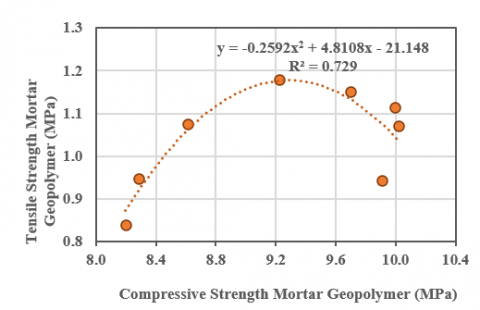
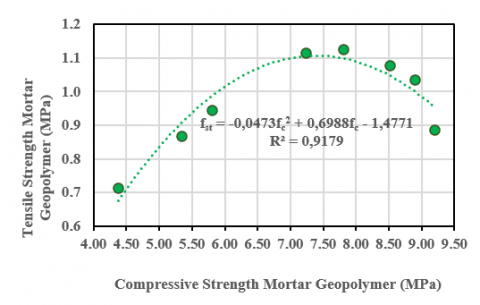
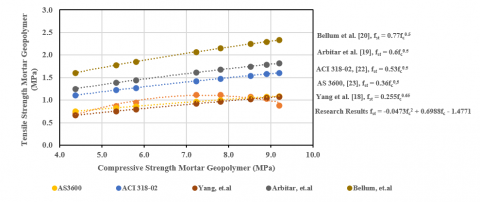
The recapitulation of the relationship model between compressive strength and flexural strength of geopolymer mortar For L/D 100 correlation model obtained fst = 0.0197 fc 1.5349, with coefficient of determination (r2) is 0.7263 with a correlation coefficient (r) of 0.8522, this indicates a valid relationship between the regression equations above, for L/D 200 relationship model obtained the equation fst = -0.2592 fc 2 + 4.8108 fc – 21.148, with coefficient of determination (r2) is 0,7290, with a correlation coefficient (r) of, 0.8538, for L/D 300 relationship model obtained the equation fst = -0.0473 fc 2 + 0.6988 fc – 1.4771 with coefficient of determination (r2) is 0.9179 with a correlation coefficient (r) of 0.9581.
Figure 26. Comparison of model relationship of compressive strength and tensile strength of geopolymer mortar with L/D=300
The relationship between compressive strength and tensile strength of geopolymer mortar with the addition of coconut fiber is similar to the results of researches [18-23]. The relationship between compressive strength and flexural strength of geopolymer mortar with the addition of coconut fiber shows a non-linear relationship using power regression or a stepwise regression model.
The results of the relationship between compressive strength and flexural strength of geopolymer mortar with the addition of coconut fibers both in this study and in some previous studies show a directly proportional relationship where the smaller the compressive strength of geopolymer mortar with coconut fibers, the lower the flexural strength value obtained in the addition of fibers with. Comparison of compressive strength model with flexural strength of geopolymer mortar with fiber addition can be seen in Table 11 for L/D=100, Table 12 for L/D=200 and Table 13 for L/D=300 and Figure 27 for L/D=100, Figure 28 for L/D=200 and Figure 29 for L/D=300.
Figure 27. Comparison of model relationship of compressive strength and tensile strength of geopolymer mortar with L/D=100
Table 11. Comparison of model relationship of compressive strength and tensile strength of geopolymer mortar with L/D=100
|
Experimental Results |
Model Relationship |
|||||
|
Compressive Strength (MPa) |
Tensile Strength (MPa) |
[22] |
[23] |
[18] |
[19] |
[20] |
|
11.82 |
0.73 |
1.82 |
1.24 |
1.27 |
2.06 |
2.65 |
|
12.65 |
0.90 |
1.88 |
1.28 |
1.33 |
2.13 |
2.74 |
|
12.87 |
0.98 |
1.90 |
1.29 |
1.34 |
2.15 |
2.76 |
|
12.86 |
1.04 |
1.90 |
1.29 |
1.34 |
2.15 |
2.76 |
|
12.39 |
1.06 |
1.87 |
1.27 |
1.31 |
2.11 |
2.71 |
|
11.51 |
0.88 |
1.80 |
1.22 |
1.25 |
2.04 |
2.61 |
|
10.10 |
0.75 |
1.68 |
1.14 |
1.15 |
1.91 |
2.45 |
|
9.82 |
0.62 |
1.66 |
1.13 |
1.13 |
1.88 |
2.41 |
Table 12. Comparison of model relationship of compressive strength and tensile strength of geopolymer mortar with L/D=200
|
Experimental Results |
Model Relationship |
|||||
|
Compressive Strength (MPa) |
Tensile Strength (MPa) |
[22] |
[23] |
[18] |
[19] |
[20] |
|
9.91 |
0.94 |
1.68 |
1.14 |
1.14 |
1.90 |
2.44 |
|
10.02 |
1.07 |
1.68 |
1.14 |
1.14 |
1.90 |
2.43 |
|
10.00 |
1.12 |
1.68 |
1.14 |
1.14 |
1.90 |
2.44 |
|
9.70 |
1.15 |
1.65 |
1.12 |
1.12 |
1.87 |
2.40 |
|
9.22 |
1.18 |
1.61 |
1.09 |
1.08 |
1.82 |
2.34 |
|
8.61 |
1.08 |
1.56 |
1.06 |
1.03 |
1.76 |
2.26 |
|
8.29 |
0.95 |
1.53 |
1.04 |
1.01 |
1.73 |
2.22 |
|
8.20 |
0.84 |
1.52 |
1.03 |
1.00 |
1.72 |
2.20 |
Table 13. Comparison of model relationship of compressive strength and tensile strength of geopolymer mortar with L/D=300
|
Experimental Results |
Model Relationship |
|||||
|
Compressive strength (MPa) |
Tensile strength (MPa) |
[22] |
[23] |
[18] |
[19] |
[20] |
|
9.20 |
0.89 |
1.61 |
1.09 |
1.08 |
1.82 |
2.34 |
|
8.89 |
1.04 |
1.58 |
1.07 |
1.06 |
1.79 |
2.30 |
|
8.51 |
1.08 |
1.55 |
1.05 |
1.03 |
1.75 |
2.25 |
|
7.80 |
1.13 |
1.48 |
1.01 |
0.97 |
1.68 |
2.15 |
|
7.23 |
1.12 |
1.42 |
0.97 |
0.92 |
1.61 |
2.07 |
|
5.80 |
0.95 |
1.28 |
0.87 |
0.80 |
1.45 |
1.85 |
|
5.33 |
0.87 |
1.22 |
0.83 |
0.76 |
1.39 |
1.78 |
|
4.37 |
0.71 |
1.11 |
0.75 |
0.67 |
1.25 |
1.61 |
Figure 28. Comparison of model relationship of compressive strength and tensile strength of geopolymer mortar with L/D=200
Figure 29. Comparison of model relationship of compressive strength and tensile strength of geopolymer mortar with L/D=300
The use of coconut fiber waste as reinforcement in geopolymer mortar has been proven to enhance its mechanical properties, including compressive, flexural, and split tensile strength. The optimum improvement was observed at a fiber content of 0.75% for compressive strength with L/D = 100, and at 1.0–1.25% for flexural and tensile strength with L/D = 200. Regression models developed for each strength type confirmed the strong relationship between fiber parameters and mechanical performance. However, excessive fiber content and longer fiber lengths led to a decline in performance due to fiber clumping and poor workability. These findings indicate that controlled addition of coconut fiber waste can produce an environmentally friendly and structurally improved geopolymer mortar, making it a promising material for sustainable construction applications.
[1] Davidovits, J. (1991). Geopolymers: Inorganic polymeric new materials. Journal of Thermal Analysis and Calorimetry, 37(8): 1633-1656. https://doi.org/10.1007/bf01912193
[2] Siswanto, E., Gunarto, A. (2019). Penambahan fly ash dan serat serabut kelapa sebagai bahan pembuatan beton. UKaRsT, 3(1): 56-65. https://doi.org/10.30737/ukarst.v3i1.352
[3] ASTM C78-02, Standard Test Method for Flexural Strength of Concrete (Using Simple Beam with Third-Point Loading).
[4] Wongsa, A., Kunthawatwong, R., Naenudon, S., Sata, V., Chindaprasirt, P. (2020). Natural fiber reinforced high calcium fly ash geopolymer mortar. Construction and Building Materials, 241: 118143. https://doi.org/10.1016/j.conbuildmat.2020.118143
[5] Loekito, I.P., Wardhono, A. (2019). Pengaruh variasi naoh dan Na2Sio3 terhadap kuat tekan dry geopolymer mortar pada kondisi rasio fly ash terhadap aktifator 2, 5: 1. Rekayasa Teknik Sipil, 1(1).
[6] Sahrudin, S., Nadia, N. (2016). Pengaruh penambahan serat sabut kelapa terhadap kuat tekan beton. Konstruksia, 7(2): 13-20. https://doi.org/10.24853/jk.7.2.%25p
[7] Badan Standarisasi Nasional. (2000). SNI 03-2834-2000, Tata cara pembuatan rencana campuran beton normal, BSN, Jakarta.
[8] American Standard Testing and Materials. (2019). ASTM C618-19. Standard Specification for Coal Fly Ash and Raw or Calcined Natural Pozzolan for Use in Concrete.
[9] Ayeni, I.S. (2024). Engineering properties of natural fibre-reinforced one-part geopolymer concrete. Construction and Building Materials, 456(1): 139161. https://doi.org/10.1016/j.conbuildmat.2024.139161
[10] Abbass, M., Singh, D., Singh, G. (2021). Properties of hybrid geopolymer concrete prepared using rice husk ash, fly ash and GGBS with coconut fiber. Materials Today: Proceedings, 45(6): 4964-4970. https://doi.org/10.1016/j.matpr.2021.01.390
[11] Bayuaji, R., Kurniawan, R.W., Yasin, A.K., Fatoni, H.A., Lutfi, F.M.A. (2016). The effect of fly ash and coconut fibre ash as cement replacement materials on cement paste strength. IOP Conference Series: Materials Science and Engineering, 128(1): 012014. https://doi.org/10.1088/1757-899X/128/1/012014
[12] Alterary, S.S., Marei, N.H. (2021). Fly ash properties, characterization, and applications: A review. Journal of King Saud University-Science, 33(6): 101536. https://doi.org/10.1016/j.jksus.2021.101536
[13] Neeraja, D., Wani, A.I., Kamili, Z., Agarwal, K. (2017). Study on strength characteristics of concrete using M-Sand and coconut fibers. IOP Conference Series: Materials Science and Engineering, 263(3): 032014. https://doi.org/10.1088/1757-899X/263/3/032014
[14] Kharin, A.Y. (2020). Deep learning for scanning electron microscopy: Synthetic data for the nanoparticles detection. Ultramicroscopy, 219: 113125. https://doi.org/10.1016/j.ultramic.2020.113125
[15] Ahmad, J., Madji, A., Al-Fakih, A., Deifalla, A.F., Althoey, F., Ouni, M.H.E., El-Shorbagy, M.A. (2022). Mechanical and durability performance of covonut fiber reinforced concrete: A state-of-the-art review. Materials, 15: 1-24. https://doi.org/10.3390/ma15103601
[16] Albitar, M., Ali, M.M., Visintin, P. (2017). Experimental study on fly ash and lead smelter slag-based geopolymer concrete columns. Construction and Building Materials, 141: 104-112. https://doi.org/10.1016/j.conbuildmat.2017.03.014
[17] Lv, C., Liu, J., Guo, G., Zhang, Y. (2022). The mechanical properties of plant fiber-reinforced geopolymers: A review. Polymers, 14(19): 4134. http://doi.org/10.3390/polym14194134
[18] Yang, C., Yang, K., Pan, Q., Chen, K., Zhu, X. (2017). Parameter and design method for alkali-activate lag concrete mix. Journal of Civil, Architectural and Environmental Engineering, 39(4): 122-127. http://doi.org/10.11835/j.issn.1674-4764.2017.04.019
[19] Albitar, M., Ali, M.M.S., Visitin, P., Drechsler, M. (2017). Durability evaluation of geopolymer and conventional concretes. Construction and Building Materials, 136: 374-385. https://doi.org/10.1016/j.conbuildmat.2017.01.056
[20] Bellum, R.R., Muniraj, K. Madduru, S.R.C. (2020). Exploration of mechanical and durability characteristics of fly ash-GGBFS based green geopolymer concrete. SN Applied Sciences, 2: 919. https://doi.org/10.1007/s42452-020-2720-5
[21] Ridha, N.; Prashant, K. (2019). Studies on strength properties of coconut fibre concrete. International Journal for Research in Applied Science and Engineering Technology, 7(7): 404-410. http://doi.org/10.22214/ijraset.2019.7061
[22] American Concrete Institute. (2002). ACI 318-02 Building Code Requirements for Structural Concrete and Commentary.
[23] Australian Standard. (2018). AS 3600 Concrete Structures.