Manar Assaf Al-Kinani![]()
© 2023 IIETA. This article is published by IIETA and is licensed under the CC BY 4.0 license (http://creativecommons.org/licenses/by/4.0/).
OPEN ACCESS
In this study, the Response Surface Methodology (RSM) was utilized to optimize process variables for butt friction stir welding (FSW) of aluminum alloys 6061 (AA 6061) and 7075 (AA 7075), known for their industrial relevance. The focus was placed on maximizing the ultimate tensile strength (UTS) and welding zone hardness (WZH) of the joints. The tool rotational speed (W) and welding speed (V) were investigated as key process parameters influencing the mechanical characteristics of the welds due to the plastic deformation of the base metals during FSW. Experiments were devised using a central composite design (CCD) and executed, with the outcomes evaluated via Minitab17 software. Subsequent analysis of variance (ANOVA) confirmed the adequacy of the developed models. It was discerned that both UTS and WZH are significantly affected by the linear and quadratic terms of W and V, as well as their interaction. Fracture characteristics of the welded joints were examined through scanning electron microscopy (SEM), correlating microstructural features with mechanical properties. Optimum welding conditions were identified at a tool rotational speed of 290 rpm and a welding speed of 13 mm/min, achieving an average UTS of 193.985 MPa and a WZH of 119.274 HV. The congruence between experimental results and predictive models underscores the reliability of the optimization process.
friction stir welding, 6061 and 7075 Al alloys, ultimate tensile strength, welding zone hardness and response surface methodology RSM
Metal joining processes are fundamental across manufacturing industries, enabling the production of complex structures that boast diverse material properties. Welding is widely recognized as a superior method for permanently fusing metals, offering enhanced joining characteristics in comparison to other semi-permanent or mechanical joining techniques [1]. Notably, friction stir welding (FSW) has emerged as a sophisticated process capable of joining materials below their melting points—materials otherwise challenging to weld using conventional techniques or those where traditional welding compromises the mechanical integrity of the material [2].
FSW presents several advantages over traditional welding methods; it is characterized by a reduced number of controllable parameters during the process, and is void of common welding defects such as porosity, oxidation, solidification cracking, and distortion. This environmentally conscious welding technique, known for its energy efficiency and minimal ecological impact, is thus considered a 'green' welding method [3]. Predominantly employed within the shipbuilding, marine, aerospace, automotive, and rail industries, FSW is instrumental in the joining of aluminum alloys and is also significantly beneficial to the aluminum extrusion sector [4].
The quality of the weld joint is, however, highly sensitive to alterations in FSW parameters, making the process's regulation a complex endeavor. The selection of appropriate parameters is essential for each new welded piece to ensure the joint meets the specified design requirements. Given the diverse applications of aluminum alloys in industry, automotive, and aerospace structures—where the integration of different materials, including various alloys, is commonplace—the implementation of friction stir welded components within these assemblies is increasingly prevalent [5].
1.1 Literature review
In the domain of metallurgical engineering, the mechanical properties and microstructural integrity of welded joints are of paramount importance. Chen et al. [6] explored the mechanical characteristics of 5083-7B04 welds, subjecting the 7B04 alloy to various heat treatment methods—namely artificial aging, natural aging, and annealing. It was observed that a superior interfacial bond with enhanced mechanical properties was achieved when the 7B04 alloy underwent artificial aging prior to being joined with the 5083 alloy, with the latter situated on the advancing side.
Further investigations into the welding of dissimilar alloys were conducted by Kalemba-Rec et al. [7], who identified a direct correlation between the tool rotation speed and the extent of material mixing in AA7075-AA5083 joints. The study highlighted that excessively high rotational speeds could induce defects such as voids, surface irregularities, tunneling, and porosity, while conversely, overly low speeds were associated with excessive heat input and related defects such as tunneling.
A meticulous selection of tool rotation and welding speed is deemed critical to achieving a defect-free joint boasting optimal mechanical and metallurgical properties. This sentiment was echoed in the work of Ghantas and Singhal [8], who successfully welded AA7039-T6. The experiments were structured using a response surface methodology’s central composite design (CCD-RSM) approach, and process parameter optimization was accomplished through the application of grey relational analysis, resulting in an enhanced grey relational grade under optimal conditions.
Baratzadeh et al. [9] delved into the mechanical characterization and microstructure of the FSW joint between AA-6063 and AA-6082 alloys, identifying improved process parameters for enhanced weld quality. Similarly, Nakowong and Sillapasa [10] leveraged parametric analysis via the Taguchi method to optimize the process variables of FSW, focusing on hardness, tensile strength, and microstructural properties in 5083 aluminum alloy welds.
The recognition of defects within FSW processes has been a topic of interest, as discussed by Hunt et al. [11]. Their research posits that an increase in welding speed is anticipated within industrial applications of the FSW method. However, the challenge lies in maintaining a defect-free welded zone at these elevated speeds. Their methodology proved effective in detecting defects, potentially reducing the cost of non-destructive evaluation (NDE) within industrial settings.
Harachai and Prasomthong [12] investigated the influence of process conditions on the mechanical properties of FSW joints, employing RSM and conducting experimental studies that varied work angle rotation speed and welding feed rate. A comprehensive analysis utilizing a Box-Behnken design (BBD), ANOVA, and S/N ratio was implemented to assess the performance characteristics of AA6061-T6 and AA5083 alloys within the FSW context. A mathematical model incorporating scanning electron microscopy provided insights into the effects of FSW conditions on the mechanical properties of aluminum alloys, concluding that the optimal parameters involved a work angle of 0.75°, a rotation speed of 777 rpm, and a welding speed of 44 mm/min.
Despite the breadth of research, there remains a scarcity of literature discussing the modeling and optimization of ultimate tensile strength (UTS) and weld zone hardness (WZH) for AA 6061 and AA 7075 alloys using RSM and the desirability function. Therefore, the present study seeks to fill this gap by integrating CCD with RSM in the experiment design to elucidate the variability inherent in each examined technological variable. Moreover, the research endeavors to ascertain the impact of tool rotation speed (W) and welding speed (V) on the ultimate tensile strength and weld zone hardness of FSWed joints.
2.1 Material and methods
In the current investigation, an aluminum alloy of grades 6061 and 7075 was employed. Al plates had the following measurements: 100 mm 50 mm 6 mm, and Tables 1 and 2 list their chemical and mechanical components. The above-mentioned Al alloy plates were joined together using the FSW machine, which has a milling machine power of 2.2kW/440V, 2000 revolutions per minute, and reach to 1000 mm per minute X axis welding speed. The tool is made of alloy steel X12, hardened at 1000 °C, and then quenched in oil. It has a pin with a right-handed screw and a flat shoulder with a 6 mm diameter. The pin has a 4 mm bottom and a 2 mm tip, and is tapered.
Table 1. The chemical composition of the workpiece
|
Material |
Si |
Fe |
Cu |
Mn |
Cr |
Zn |
Al |
|
AA6061-T6 |
0.62 |
0.45 |
0.20 |
0.08 |
0.09 |
0.03 |
Balance |
|
AA7075-T6 |
0.05 |
0.14 |
1.4 |
0.03 |
0.19 |
5.8 |
Balance |
Table 2. Mechanical properties of the materials used in the FSW process [5]
|
Metal |
TS (MPa) |
YS (MPa) |
% Elongation |
HV |
|
AA6061 |
315.0 |
287.0 |
12.0 |
107 |
|
AA7075 |
575.0 |
530.0 |
13.0 |
175 |
2.2 Mechanical testing
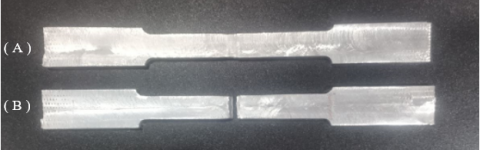
Using a universal tensile machine, a transverse tensile test was performed at room temperature. The tensile test specimens were prepared in accordance with ASTM E8 standard. It was made sure that the central portion of the welded zone was included in the gauge length of the tensile specimens. Specimens were fractured completely at a speed of 1 mm/min. Finally, the UTS for each specimen that was welded using various process settings was determined from the stress-strain curve. The tensile specimen is shown in subgraph (A) and (B) of Figure 1 before and after failure. Additionally, a Vickers tester (HVS-1000, China) with a dwell period of 15 s was used to conduct an ASTM E92 microhardness test on the FSWelded region throughout the stir zone (SZ) and heat affected zone (HAZ). Any two subsequent dents must be separated by the standard distance, which is 2.5 times the diagonal's average value. Our experiment's advancing and retreating sides are referred to as AA6061 and AA7075, respectively, because the advancing side has a stronger plastic flow [13]. Moreover, the AA6061 aluminum alloy has a higher flow since it is softer than AA7075. TESCAN VEGA 3 SBU noted the weld joints' optimal condition.
Figure 1. The specimen used in the tensile test; (A) before and (B) after the test
2.3 Methodology
To plan the tests, centered composite design, or CCD, has been used. It can effectively handle linear, quadratic, and interaction terms in process modeling and employs three levels for each parameter. In general, to gather sufficient data in order to create an appropriate second order regression response equation for a multi-factor process [14].
Here, two input process variables have been selected for the experimental study that resulted in heat input and later determined FSW joints of Al: tool rotating speed (W) and welding speed (V). Table 3 lists the values and levels of the input variables, and RSM based on CCD is used to optimize the experiment depended on 95% confidence interval [15, 16] to get higher UTS and minimal WZH values.
Table 3. FSW variables and their levels
|
Inputs |
Code |
Unit |
Level |
||
|
1 |
2 |
3 |
|||
|
Tool rotational speed |
W |
rpm |
250 |
500 |
750 |
|
Welding speed |
V |
mm/min. |
5 |
10 |
15 |
On the basis of the RSM's design, experiments were carried out in a CCD matrix, where the two factors (W and V) at three levels were selected. These experiments included 14 sets of real process parameters, which are shown in Table 4.
Table 4. DoE according to Taguchi and responses
|
S. No. |
W rpm |
V mm/min. |
UTS (MPa.) |
WZH (HV) |
|
01 |
750 |
10 |
190.00 |
112.425 |
|
02 |
500 |
10 |
187.03 |
116.025 |
|
03 |
250 |
10 |
184.30 |
120.165 |
|
04 |
500 |
5 |
197.00 |
115.089 |
|
05 |
500 |
10 |
187.10 |
115.980 |
|
06 |
500 |
10 |
187.15 |
115.944 |
|
07 |
500 |
15 |
171.39 |
114.522 |
|
08 |
500 |
10 |
187.17 |
115.890 |
|
09 |
250 |
15 |
168.78 |
118.671 |
|
10 |
750 |
15 |
174.00 |
111.075 |
|
11 |
250 |
5 |
194.00 |
119.265 |
|
12 |
750 |
5 |
200.00 |
111.615 |
|
13 |
500 |
10 |
187.20 |
115.836 |
|
14 |
500 |
10 |
187.22 |
115.899 |
3.1 Developing the mathematical models
The following equation can be used to express the response surface 'Y' using a polynomial regression:
$\begin{gathered}Y=\beta_0+\beta_1 W+\beta_2 V+\beta_{11} W^2+\beta_{22} V^2 +\beta_{12} \times V\end{gathered}$ (1)
ANOVA of RSM was used to predict the incorporated impact of the W and V factors on the responses' UTS and WZH. To determine the equation's coefficients, regression analysis employed the least squares method. With the use of the statistical Minitab program 17, the coefficient values in the polynomial Eqs. (2)-(3) were calculated.
The mechanical characteristics of the FSW joint were predicted using all of the response coefficients at confidence level 95%. The irrelevant response coefficients were removed without impacting the efficacy of the model in order to prevent the computing complexity of the generated model and the strenuous mathematical labor [17]. The completed regression model, together with significant control conditions, is provided below. It can be used to predict UTS and WZH of FSWelded joints.
$\begin{gathered}\mathrm{UTS}=194.531+0.012840 ~ \mathrm{W}-0.1220 ~ \mathrm{V}-0.11805 \mathrm{~V}^2 -0.000156 \mathrm{~W} \times \mathrm{V}\end{gathered}$ (2)
$\begin{gathered}\mathrm{WZH}=121.073-0.021067 ~\mathrm{W}+0.8477 ~\mathrm{V}+ 0.000006 \mathrm{~W}^2-0.04522 ~\mathrm{V}^2\end{gathered}$ (3)
3.2 Verifying the accuracy of the developed model
The created models appear to be quite good based on the obtained the coefficient of determination R2 values for UTS and WZH, which are 0.9771 and 0.9654, respectively. The statistical findings of the models were used to calculate the efficacy of the constructed models, as shown in Table 5.
Table 5. ANOVA for the developed models
|
UTS (MPa.) |
Source |
DF |
Seq SS |
Contribution |
Adj SS |
Adj MS |
F-Value |
P-Value |
|
Model |
4 |
1061.54 |
100.00% |
1061.54 |
265.384 |
87529.40 |
0.000 |
|
|
Linear |
2 |
1031.52 |
97.17% |
1031.52 |
515.761 |
170109.08 |
0.000 |
|
|
W |
1 |
47.71 |
4.49% |
47.71 |
47.714 |
15737.23 |
0.000 |
|
|
V |
1 |
983.81 |
92.68% |
983.81 |
983.808 |
324480.93 |
0.000 |
|
|
Square |
1 |
29.86 |
2.81% |
29.86 |
29.862 |
9849.27 |
0.000 |
|
|
V2 |
1 |
29.86 |
2.81% |
29.86 |
29.862 |
9849.27 |
0.000 |
|
|
Interaction |
1 |
0.15 |
0.01% |
0.15 |
0.152 |
50.17 |
0.000 |
|
|
W×V |
1 |
0.15 |
0.01% |
0.15 |
0.152 |
50.17 |
0.000 |
|
|
Error |
9 |
0.03 |
0.00% |
0.03 |
0.003 |
|
|
|
|
Lack-of-Fit |
4 |
0.00 |
0.00% |
0.00 |
0.001 |
0.14 |
0.960 |
|
|
Pure Error |
5 |
0.02 |
0.00% |
0.02 |
0.005 |
|
|
|
|
Total |
13 |
1061.56 |
100.00% |
|
|
|
|
|
|
WZH (HV) |
Model |
4 |
92.2062 |
99.97% |
92.2062 |
23.0515 |
7263.42 |
0.000 |
|
Linear |
2 |
88.5416 |
96.00% |
88.5416 |
44.2708 |
13949.50 |
0.000 |
|
|
W |
1 |
88.0594 |
95.47% |
88.0594 |
88.0594 |
27747.06 |
0.000 |
|
|
V |
1 |
0.4822 |
0.52% |
0.4822 |
0.4822 |
151.95 |
0.000 |
|
|
Square |
2 |
3.6646 |
3.97% |
3.6646 |
1.8323 |
577.34 |
0.000 |
|
|
W2 |
1 |
0.0431 |
0.05% |
0.3650 |
0.3650 |
115.02 |
0.000 |
|
|
V2 |
1 |
3.6215 |
3.93% |
3.6215 |
3.6215 |
1141.10 |
0.000 |
|
|
Error |
9 |
0.0286 |
0.03% |
0.0286 |
0.0032 |
|
|
|
|
Lack-of-Fit |
4 |
0.0055 |
0.01% |
0.0055 |
0.0014 |
0.29 |
0.870 |
|
|
Pure Error |
5 |
0.0231 |
0.03% |
0.0231 |
0.0046 |
|
|
|
|
Total |
13 |
92.2347 |
100.00% |
|
|
|
|
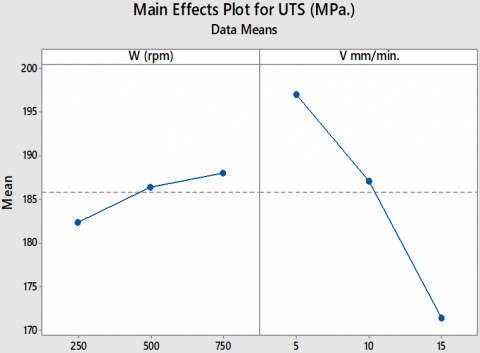
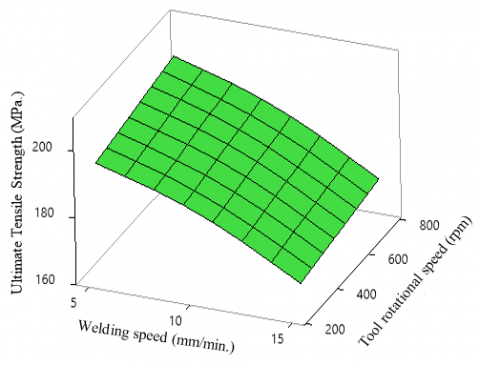
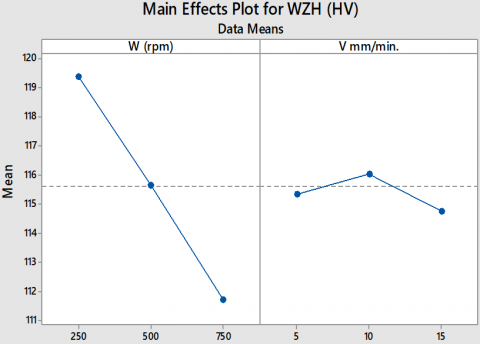
As illustrated in Figure 2, Table 5 shows that the ultimate tensile strength is influenced by the rotation speed by 4.49% and the welding speed by 92.68%. Therefore, the welding speed has more impact than the tool rotation speed on the tensile strength, also the combination effect of W and V on UTS is shown in Figure 3 in 3D surface plot although it has little effect on the UTS. However, the confidence interval used in this analysis was 95%. Therefore, all parameters with a p-value less than 0.05 that are linear, square, or interaction-related become significant. This doesn't include the squared tool rotation speed, which the backward elimination technique omitted. As indicated in Figure 4, the impact of tool rotating speed on hardness is 95.47%, while the impact of welding speed is 0.52%. In contrast to the interaction between rotating speed and welding speed, which was avoided using the same process, the linear and square hardness are important features.
The 'Lack-of-Fit' in Table 5 for two responses (UTS and WZH) has a p-value above the crucial value of 0.960 and 0.870, respectively, which is greater than 0.05, suggesting that the models have adequate fit. It follows that the UTS and WZH values of the weld can be accurately predicted using regression models. Additionally, because the models' R2 values are close to 1, they can be used to create prediction equations.
Figure 2. Main effect plots for UTS
Figure 3. Response surface plot of UTS versus W and V
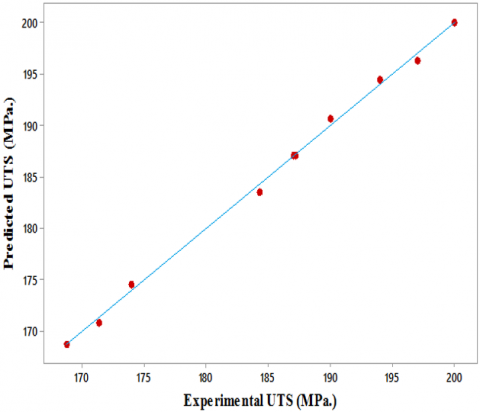
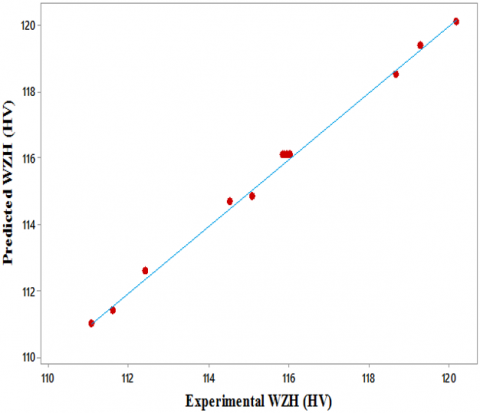
The UTS and WZH were predicted using mathematical models, and the models were also validated using generated scatter plots, as shown in subgraphs (a) and (b) of Figure 5, respectively. The experimental and predicted values resulting from the models are distributed at both ends and quite close to the 45° line, which obviously shows an accurate match of the developed mathematical models and demonstrates the suitability of the models.
Figure 4. Main effect plots for WZH
(a)
(b)
Figure 5. Scatter plot for: (a) UTS; and (b) WZH of FSW of AA6061 and AA7075
3.3 Optimization analysis
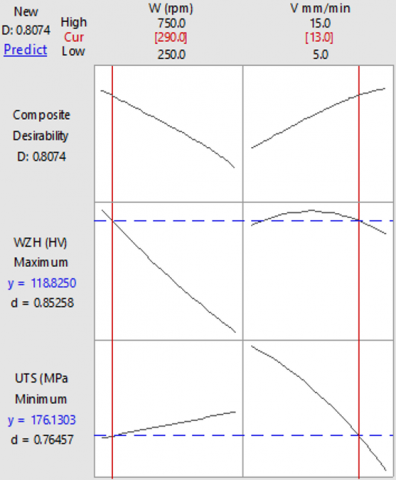
The effects of FSW for AA 6061 and AA 7075 alloys on the weld's UTS and WZH values were investigated using multiple response optimization. Table 6 displays these outcomes. As illustrated in Figure 6, it was noted that the optimum parameters for the experiment were a W of 290 rpm and a V of 13 mm/min, which produced an average UTS of 193.985 MPa and an average WZH of 119.274 HV.
Table 6. Multiple response prediction
|
Variable |
Setting |
|||
|
W |
290 |
|||
|
V |
13 |
|||
|
Response |
Fit |
SE Fit |
95% CI |
95% PI |
|
UTS |
176.130 |
0.048 |
(176.112, 176.220) |
(176.107, 176.314) |
|
WZH |
118.825 |
0.041 |
(118.715, 118.873) |
(118.704, 118.930) |
The overall desirability function, which has a range of 0 to 1, is a dimensionless performance measure created by the desirability technique using the various response values as input. The method described above yielded the predicted optimal results (UTS 176.130 MPa and WZH 118.825 HV). Figure 7 illustrates the composite desirability (D) equal to 0.8074 obtained from the optimization function of design expert software.
Figure 6. Optimal results in FSW welding
3.4 Confirmation analysis
A 290 rpm tool rotation and 13 mm/min welding speed were the optimal FSW parameters. To verify the findings, the experiment was conducted once more. For the confirmation analysis, the tool rotation and welding speed were changed to 290 rpm and 13 mm/min. respectively. The UTS and WZH values of two welded workpieces were examined to ascertain the response.
Table 7 displays the experimental confirmation of the mean UTS value was found to be 172.753 MPa with a 1.954% error, while for the WZH value was found to be 114.325 HV with a 3.936% error. The result of the confirmation experiment, i.e., the total error, was within the allowable range.
Figure 7. Interaction plot for UTS and WZH
Table 7. Experimental confirmation of the mean UTS and WZH
|
Response |
Optimization Approach |
Confirmatory Experiment |
Error (%) |
|
UTS |
176.130 |
172.753 |
1.954 |
|
WZH |
118.825 |
114.325 |
3.936 |
3.5 Microstructure analysis
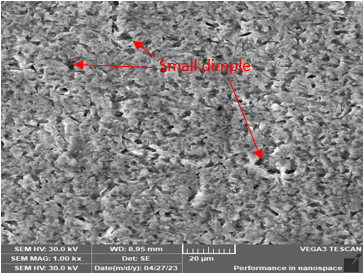
Fractures happened in the weld area, precisely where the faults were located, in the case of welds that were manufactured under ideal conditions. SEM examinations of the fracture surfaces provided this assurance (Figure 8). However, the presence of distinctive dimples on the fracture surface also suggests that the fracture was primarily ductile, with voids forming and coalescing.
Figure 8. SEM micrographs showing fracture surface characteristics of tensile specimens at optimal conditions
1. As the tool's rotating speed rises, UTS really rises as well, and welding speed will have the reverse effect on UTS.
2. WZH has actually reduced as tool rotating speed has increased, whereas WZH has actually increased up to 10 mm/min and started to diminish at 15 mm/min as welding speed has increased.
3. Using 6061 on the advancing side and 7075 on the retreating side, with a 290 rpm and 13 mm/min as tool rotational and welding speed respectively, the defect-free joint with the best mechanical properties was created.
4. CCD modeling based on an ANOVA analysis showed that the terms W, V, V2, and W×V have a substantial impact on UTS. Furthermore, W2 had no significantly impact on the UTS model. An analysis of hardness revealed that the terms W, V, V2, and W2 greatly impacted WZH, however the terms interaction did not.
5. Using a desirability function technique, mechanical properties were simultaneously optimized. These results indicate an optimum value that, at a 290-rpm rotational speed and 13 mm/min welding speed produces a 176.130 MPa UTS and a 118.825 HV joint WZH.
6. The experimental results showed that the suggested strategy was capable of predicting the optimum value with an error that was less than 5%. To do this, confirmatory research was used to validate the identified optimum value.
7. Joint surface fractures in the stir zone were inspected, and a minor dimpled fracture surface was seen in the intermediate zone.
[1] Senthil, S.M., Kumar M.B., Dennison, M.S. (2022). A contemporary review on friction stir welding of circular pipe joints and the influence of fixtures on this process. Advances in Materials Science and Engineering, 1-25. https://doi.org/10.1155/2022/1311292
[2] Kaygusuz, E., Karaomerlioğlu F., Akıncı, S. (2023). A review of friction stir welding parameters, process and application fields. Turkish Journal of Engineering, 7(4): 286-295. https://doi.org/10.31127/tuje.1107210
[3] Kumar, B.V., Upender, K., Ramana M.V., Sreenivasarao, M.S. (2023). Visual inspection on friction stir welded dissimilar aluminum alloy AA6082-AA5083 using conventional and hybrid tool pin profiles. Materials Today: Proceedings. https://doi.org/10.1016/j.matpr.2022.12.234
[4] Thomas, W.M., Johnson, K.I., Wiesner, C.S. (2003). Friction stir welding–recent developments in tool and process technologies. Advanced engineering materials, 5(7): 485-490. https://doi.org/10.1002/adem.200300355
[5] Seshu Kumar, G.S.V., Anshuman, K., Rajesh, S., Raju Chekuri, R.B., Ramakotaiah, K. (2022). Optimization of FSW process parameters for welding dissimilar 6061 and 7075 Al alloys using Taguchi design approach. International Journal of Nonlinear Analysis and Applications, 13(1): 1011-1022. http://doi.org/10.22075/ijnaa.2021.24678.2795
[6] Chen, Y., Ding, H., Cai, Z., Zhao, J., Li, J. (2017). Microstructural and mechanical characterization of a dissimilar friction stir-welded AA5083-AA7B04 butt joint. Journal of Materials Engineering and Performance, 26: 530-539. http://doi.org/10.1007/s11665-016-2482-9
[7] Kalemba-Rec, I., Kopyściański, M., Miara, D., Krasnowski, K. (2018). Effect of process parameters on mechanical properties of friction stir welded dissimilar 7075-T651 and 5083-H111 aluminum alloys. The International Journal of Advanced Manufacturing Technology, 97: 2767-2779. https://doi.org/10.1007/s00170-018-2147-y
[8] Ghangas, G., Singhal, S. (2018). Modelling and optimization of process parameters for friction stir welding of armor alloy using RSM and GRA-PCA approach. Materials Research Express, 6(2): 026553. https://doi.org/10.1088/2053-1591/aaed9b
[9] Baratzadeh, F., Boldsaikhan, E., Nair, R., Burford, D., Lankarani, H. (2020). Investigation of mechanical properties of AA6082-T6/AA6063-T6 friction stir lap welds. Journal of Advanced Joining Processes, 1: 100011. https://doi.org/10.1016/j.jajp.2020.100011
[10] Nakowong, K., Sillapasa, K. (2021). Optimized parameter for butt joint in friction stir welding of semi-solid aluminum alloy 5083 using Taguchi technique. Journal of Manufacturing and Materials Processing, 5(3): 88. https://doi.org/10.3390/jmmp5030088
[11] Hunt, J.B., Mazzeo, B.A., Sorensen, C.D., Hovanski, Y. (2022). A generalized method for in-process defect detection in friction stir welding. Journal of Manufacturing and Materials Processing, 6(4): 80. https://doi.org/10.3390/jmmp6040080
[12] Harachai, K., Prasomthong, S. (2023). Investigation of the optimal parameters for butt joints in a friction stir welding (FSW) process with dissimilar aluminium alloys. Materials Research Express, 10(2): 026514. https://doi.org/10.1088/2053-1591/acbb54
[13] Chumaevskii, A., Amirov, A., Ivanov, A., Rubtsov, V., Kolubaev, E. (2023). Friction stir welding/processing of various metals with working tools of different materials and its peculiarities for titanium alloys: A review. Metals, 13(5): 970. https://doi.org/10.3390/met13050970
[14] Botha, N., Inglis, H.M., Coetzer, R., Labuschagne J.W.J. (2021). Statistical design of experiments: An introductory case study for polymer composites manufacturing applications. Matec Web, 347(28): 1-12. https://doi.org/10.1051/matecconf/202134700028
[15] Aamir, M., Tolouei-Rad, M., Giasin, K., Vafadar, A. (2020). Feasibility of tool configuration and the effect of tool material, and tool geometry in multi-hole simultaneous drilling of Al2024. The International Journal of Advanced Manufacturing Technology, 111: 861-879. https://doi.org/10.1007/s00170-020-06151-7
[16] Rambabu, G., Naik, D.B., Rao, C.V., Rao, K.S., Reddy, G.M. (2015). Optimization of friction stir welding parameters for improved corrosion resistance of AA2219 aluminum alloy joints. Defence Technology, 11(4): 330-337. https://doi.org/10.1016/j.dt.2015.05.003
[17] Al-Shafaie, S.H. (2018). Multi-objective optimization to improve surface integrity in wedm of al/wcp metal matrix composites using grey relational analysis. Journal of Engineering and Applied Sciences, 13(24): 10173-10181. https://doi.org/10.36478/jeasci.2018.10173.10181