Latifa Louetri*![]() | Abdessalam Nouaouria
| Abdessalam Nouaouria![]() | Mohamed Salah Nouaouria
| Mohamed Salah Nouaouria![]()
©2023 IIETA. This article is published by IIETA and is licensed under the CC BY 4.0 license (http://creativecommons.org/licenses/by/4.0/).
OPEN ACCESS
This investigation focuses on the experimental determination of critical mechanical properties of various granular materials, namely cement, sand, wheat, granulated sugar, and wheat flour, which are essential in the design of silos. These properties, crucial for defining the behavior of materials stored in silos through numerical methods, have been less documented in existing literature. Conducted at the Research Laboratory of Civil Engineering and Hydraulics of 8 May 1945 University, Guelma, Algeria, a series of geotechnical tests, including triaxial, ring shear, and Oedometric tests, were employed to ascertain a range of properties: internal friction angle, apparent cohesion, specific weight, elastic modulus, Poisson ratio, particle-to-steel wall friction coefficient, and dilatancy angle. It was observed that sand and sugar exhibit the highest rigidity, as indicated by their elastic moduli. In terms of compressibility, sugar, wheat, and wheat flour demonstrated the greatest extent. Discrepancies between the results of triaxial and shear tests suggest a probable influence of material consolidation methods on outcomes. While certain findings aligned with previous studies, discrepancies in materials like cement and sand necessitate additional testing for verification. This study proposes recommended values for these mechanical properties, contributing significantly to the field of silo design.
Oedometric test, ring shear test, triaxial test, elastic modulus, dilatancy angle, internal friction angle, Poisson ratio, particle-to-steel wall friction coefficient
Research endeavors in silo design have traditionally focused on the dual aspects of structural behavior and the properties of stored materials [1]. The advent of numerical methods has significantly enhanced the understanding of silos' dynamic behavior [2]. These techniques facilitate the modeling of bulk material behavior, encompassing aspects such as the filling and emptying processes and the impact of hopper eccentricity [3].
The proliferation of numerical methods spurred advancements in models for characterizing the behavior of stored materials, thereby broadening the scope of research into their mechanical properties [4]. While existing literature offers insights into the internal friction angle, apparent cohesion, and specific weight of these materials, there remains a notable scarcity of data on the dilatancy angle and Poisson ratio [1]. This gap extends to the elastic modulus, a key parameter in characterizing the elastic deformation of granular materials, integral to numerical models [5, 6]. Historically, the lack of specific values necessitated reliance on either data from other researchers or arbitrary selections, leading to potential inaccuracies in numerical model solutions [1, 6].
In addressing these gaps, experimental research has played a pivotal role. Molenda and Stasiak's [7] work is exemplary, utilizing uniaxial compression tests to ascertain the elastic constants of cereal grains. Their methodology employed the linear unloading phase for calculating the grains' elastic constants (elastic modulus E and Poisson ratio ν). Findings revealed an increase in the elastic modulus E of cereal grains with seed moisture content, ranging from 6.6 kPa to 23.6 kPa. Variations in Poisson ratio were observed, ranging from 0.22 in wheat (10.8% moisture content) to 0.15 in barley (15.3% moisture content), and between 0.24 in rapeseed (6% moisture content) to 0.10 in rapeseed (15% moisture content).
The exploration of mechanical properties in various granular materials has been extensively documented. Moya et al. [1] investigated a range of materials including Krona barley, Kym barley, Rapeseed, Eulalia chickpea, Sunflower, Camacho wheat, Camarma triticale, Senda vetch, Vereda vetch, and Lentil vetch. Their study highlighted a congruence in the values of internal friction angles derived from both triaxial and direct shear tests. Notably, the circular shear cell in the direct shear test yielded the most consistent results. Similarities were also observed in the measurement of the dilatancy angle across square and circular shear cells. The specific weight, or the gravitational force per unit volume, remained unaffected by varying velocities in the experiment. However, the void ratio values varied depending on the type of Oedometer apparatus used, while the Poisson ratio values were influenced by the velocity during testing.
Further, Molenda et al. [8] examined the mechanical properties of food powders, including Wheat, Lentils, Sugar, and Wheat flour, in two distinct laboratories. Their findings underscored the critical need for stringent consistency in material state, apparatus, and experimental settings. This requirement highlights the imperative for international standardization in evaluating the mechanical properties of characteristic materials.
Additionally, Moya et al. [2] focused on granular agricultural materials such as Amelia chickpea, Flaxseed, Lentil, Rice, Rye, and Horzal wheat. Their research revealed discrepancies in the behavior of agricultural grain samples compared to traditional soil mechanics of sand when subjected to direct shear and triaxial tests. It was deduced that the specific weight of these materials is independent of the test velocity. Notably, the Poisson ratio values for flaxseed, lentil, Horzal wheat, and Camarma triticale were higher, deviating from other parameters. A linear relationship was established between the angle of internal friction, dilatancy angle, Young's modulus, and specific weight, while an inverse relationship was noted with the Poisson ratio.
In their seminal work, Ramirez et al. [9] examined the mechanical properties of six powdered agricultural materials, including barley flour, maize flour, wheat flour, granulated sugar, and confectioners’ sugar, with an emphasis on silo design applications. This study revealed variations in results between triaxial and direct shear apparatuses, likely attributable to differences in material consolidation prior to measurement. Among the materials tested, granulated sugar exhibited the highest rigidity. In triaxial tests, wheat barley and soya flours demonstrated the most plastic behavior. Notably, soya flour presented a dilatancy angle comparable to that of tested soil, whereas other materials, except confectioners’ sugar, showed lower dilatancy angles. Confectioners’ sugar was found to have the highest elastic modulus, while maize flour emerged as the most rigid among the flours.
Gonzalez et al. [10] reported on the experimental determination of various microscopic properties of maize grains and olives. These included particle density, elastic modulus, particle-to-wall coefficient of restitution, particle-to-particle coefficient of restitution, and the particle-to-wall coefficient of friction. These properties are integral for Discrete Element Method (DEM) simulations. Challenges were encountered in developing tests for non-regular particles, particularly in determining restitution coefficients for maize grains.
Further, Moya et al. [11] investigated the mechanical properties of granular agricultural materials such as Kym barley, Corn, Prevision oats, Sunflower, Lentil vetch, and Camacho wheat, which are pertinent in silo design. Their research compared traditional and modern numerical methods in silo design, revealing that various granular agricultural materials stored in silos require conventional geotechnical equipment. Their findings indicated that material properties remained consistent regardless of test velocity, with the exception of the Poisson ratio. The study also found that simplified devices and procedures can be effectively employed with agricultural grains. Additionally, no significant differences were observed in the outcomes of direct shear tests on both preconsolidated and unconsolidated samples, whether using square shear boxes or circular shear cells.
Alonso et al. [12] embarked on a comprehensive study involving both experimental and numerical approaches to determine the mechanical properties of polygonal wood particles, focusing on their flow behavior in silos. To facilitate this, methods for parameter determination were proposed for use in a DEM. The derived parameters were integrated into the internally developed SPOLY software, designed for calculating the DEM model using sphere-polyhedron elements. Model validation was achieved through a two-dimensional physical model, introducing prismatic particles with polygonal cross sections into a silo featuring variable aperture and hopper angle. Validation involved an in-depth comparison of computed flow rates, displacement profiles, and clogging thresholds from SPOLY against experimental results. The study’s success underscores the effectiveness of miniature triaxial tests, grain-surface profilometry, inclined slope tests, and numerical analysis of intra-granular stresses in establishing contact-deformation relations for realistic DEM modeling of flow in angular-shaped particles.
Lopes et al. [6] conducted research on the mechanical characteristics of grain silos, pertinent for simulation designs. Their findings indicated that the estimated Poisson ratio, particularly at increased moisture content, consistently showed higher values compared to actual measurements. Similarly, both estimated and actual values for the elastic modulus increased with higher moisture content in the samples. Furthermore, they noted a decrease in the dilatancy angle with rising moisture content and compressive stresses.
Zeng and Wang [13] presented a study on the shear and dilatancy behavior of wheat in silos under varying densities and normal stresses. Their objective was to establish a quantitative model linking the peak friction angle and maximum dilatancy angle of stored wheat. Results showed an increase in both peak and internal friction angles with the relative density of the wheat sample. Denser samples exhibited enhanced dilation, indicated by higher dilatancy angles, while increased normal stress suppressed dilation. Applying Bolton’s theory, they deduced the relationship between peak friction angle and maximum dilatancy angle, taking into account the relative density effect. This work led to the development of an advanced model for evaluating the peak shear behavior of wheat in silos, considering the dilatancy of the stored grain.
Gallego et al. [14] dedicated their research to the mechanical properties of wood pellets, particularly for use in DEM simulations. The study comprehensively measured the particle density, modulus of elasticity, particle-particle and particle-wall coefficients of restitution, and coefficients of friction for wood pellet particles. A significant finding of this study was the strong correlation (R2 = 0.96) between the particle-wall coefficient of restitution and the impact velocity (related to the height of drop) of the wood pellet particle. Additionally, a noteworthy decrease in the longitudinal modulus of elasticity of wood pellets was observed with increasing moisture content, evidenced by a substantial coefficient of correlation (R2 = 0.94).
Further, Moya et al. [15] investigated the mechanical properties of wheat, maize, and wood pellets. This encompassed the internal angle of friction, Poisson ratio, Young’s modulus, apparent specific weight, and moisture content, determined through geotechnical assays such as direct shear, triaxial assay, and oedometers. The internal angle of friction, particle-wall coefficient of friction, and apparent specific weight for these materials aligned with existing literature. Notably, the direct shear assay yielded significantly lower internal angles of friction for maize and wood pellets compared to triaxial testing, potentially due to particle orientation and arrangement. The particle-wall coefficient of friction was found to be comparable or greater than previously reported values for all three materials, reflecting the diversity of materials studied.
The bibliographic research conducted as part of this study highlighted a scarcity of information regarding the elastic modulus, particle-to-wall friction coefficient, dilatancy angle, and Poisson ratio for sand and cement. Therefore, the current work aims to conduct an experimental study to determine these mechanical properties, essential for predicting the material load on silo walls and understanding their interaction with stored materials. Focusing on cement, sand, wheat, granulated sugar, and wheat flour, a series of tests were conducted at the Research Laboratory of Civil Engineering and Hydraulics of the 8 May 1945 University in Guelma, Algeria.
The material properties determined in this work are the internal friction angle (ϕ), the apparent cohesion (C),the particle-to-wall friction coefficient (µ), the dilatancy angle (ψ), the Poisson ratio (ν), the elastic modulus (E), and the specific weight (γ).The materials used in this study are local ones; CPJ-CEM II/A 42.5 cement manufactured at the HadjarSoud plant in Skikda Algeria, fine sand from the Annaba beach (Algeria), durum wheat from the Annaba field (Algeria) and wheat flour extracted from Annaba field wheat, and granulated sugar. Sampling and sample preparation were carried out in accordance with Eurocode 1 part 4 [16].
2.1 Triaxial test
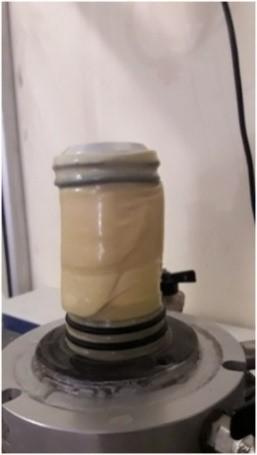
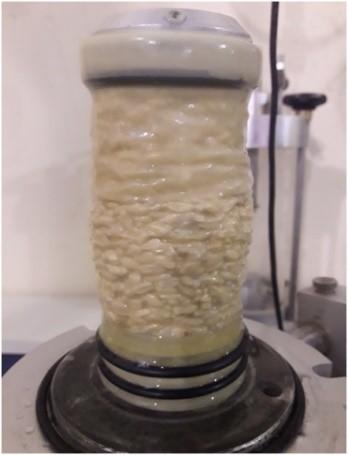
The triaxial test is carried out according to the European standard (Eurocode 1 part 4) for all samples. The sample is placed in a mould with a diameter of 50 mm and a height of 100 mm according to NF P94-074 [17] in three layers (Figure 1). Each layer is compacted at a rate of 25 strokes. The mould is placed in the triaxial cell where a progressive axial force is applied until 20% of the axial strain is reached (the maximum rate allowed by standards) [11]. The data logger unit records the axial forces and the vertical displacements. The drainage conduits were not used (untrained test). The tests are carried out for three values of the confining pressures equal to 100,200 and 300 kPa successively constant during the test. With a deformation velocity of 0.51 mm/min.The test is repeated three times for each value of the confining pressures at each applied pressure to determine the mean value. These parameters were used by Ramírez et al. [9], and Moya et al. [11].
The apparent cohesion and the internal friction angle are one of the parameters determined by the triaxial test. These parameters are used in the standard calculations and the analytical methods, as well as in the numerical methods. The internal friction angle varies depending on the compressibility of the upper layers or/and because of the moisture of the material itself [18, 19]. This angle affects the different types of flows that occur in the silo and the rupture plane generation of the ensiled material [18]. Apparent cohesion and internal friction angle are calculated from the recorded data by using Mohr's circle envelope.
The horizontal-to-vertical pressure ratio k0 was also determined by the triaxial test, using the same velocity of 0.51 mm/min and by applying the same confining pressures of 100, 200, and 300 kPa. This parameter can be determined by Eq. (1) [16].
$_{{{k}_{0}}=\frac{{{\sigma }_{x}}}{{{\sigma }_{y}}}}$ (1)
k0 is the horizontal-to-vertical pressure ratio.
σx is the horizontal stress applied to the sample.
σy is the maximal vertical stress applied to the sample.
(a) Wheat flour sample.
(b) Wheat sample
Figure 1. Triaxial tests on wheat flour and wheat
The following equation Eq. (2) is used, from which we can determine the Poisson ratio:
$_{{{k}_{0}}=\frac{{{\sigma }_{x}}}{{{\sigma }_{y}}}=\frac{\nu }{1-\nu }}$ (2)
where, ν is the Poisson ratio.
Therefore:
$_{\nu =\frac{{{k}_{0}}}{1+{{k}_{0}}}}$ (3)
An approximate value for k0 can also be determined by the following equation:
$_{{{k}_{0}}=1.1*(1-\sin (\varphi ))}$ (4)
ϕ is the internal friction angle.
The factor (1.1) in the expression is used to represent the difference between the calculation of this parameter under zero wall friction and when the friction is present.
2.2 Ring shear test
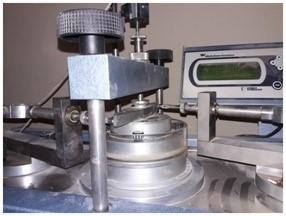
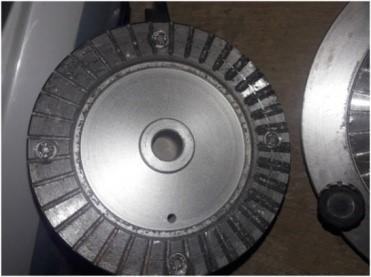
This device allows the sample to undergo continuous and-unlimited shear deformation on annular samples, without having to stop and change the direction of the shear movement [20]. The device is annular (Figure 2), with an outer diameter of 10 cm and an inner diameter of 7 cm. The samples are placed in the device mould, for the largest grains, such as wheat, they will be arranged to avoid voids as much as possible, and then vertical pressure and shear forces with a velocity of 0.32 mm/min are applied.
Figure 2. Ring shear apparatus
Three vertical pressure values are respectively applied as follows: 100, 200 and 300 kPa. These parameters (velocity and pressure) have been used by Ramírez et al. [9]. The vertical and horizontal displacements and the shear forces are recorded automatically using a data logger unit. According to a standard [21], the shear stress can be determined using the following equation:
$_{\tau =\frac{3*({{F}_{1}}-{{F}_{2}})*l}{4\pi (R_{2}^{3}-R_{1}^{3})}}$ (5)
τ is the shear stress.
F1 and F2 are the loads on the rings.
R1 and R2 are the inner and outer sample radius.
From the regression curve relating the shear stress and the normal stress obtained by this test, we can determine the apparent cohesion and the internal friction angle.
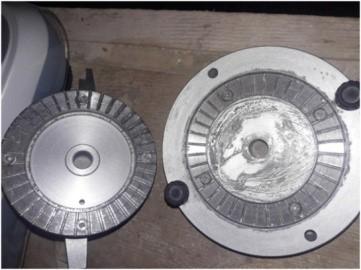
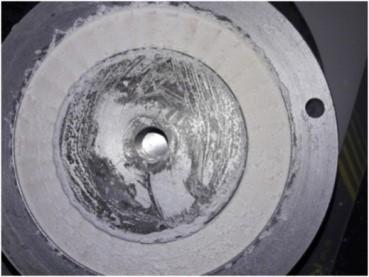
One of the parameters necessary to define the grain-silo wall interaction is the particle-to-wall friction coefficient. To determine this parameter by the shear test, the quantity of material studied is half the volume of the mould to ensure that the friction is between this material and the upper part of the mould. The particle-to-wall friction coefficient determined in this work is concerning the steel wall, for this case the two porous discs are replaced by two steel discs (Figure 3) to simulate the steel silo wall. This parameter can be determined by the shear test in which:
$_{\mu =\tan {{\varphi }_{w}}}$ (6)
ϕw is the particle-to-wall friction angle.
µ is the particle-to-wall friction coefficient.
Or using:
$_{\mu =\frac{{{\tau }_{r}}}{{{\sigma }_{n}}}}$ (7)
σn is the normal stress.
${\tau }_{r}$ is the tangential stress.
These expressions are used in previous works as [1, 2, 6, 9, 16].
Figure 3. Top and bottom steel discs to simulate the steel silo wall
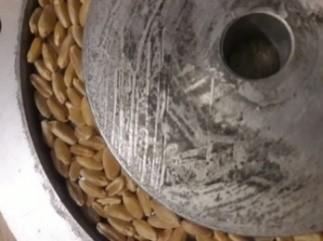
The dilatancy angle is a necessary parameter to use in the elastic-plastic model [2], and to define the flow law that determines the plastic displacement direction [18]. In the literature, it has been demonstrated that the influence of the dilatancy angle is not significant on the pressure distribution on the silo wall in the case of static analysis [22]. The ring shear box has been used to determine the dilatancy angle of the materials studied (Figure 4). With the same condition of a shear velocity of 0.32 mm/min, as used by Ramírez et al. [9] investigation, and by applying the vertical pressures of 100, 200 and 300 kPa, the vertical and horizontal displacement values and the friction forces were automatically recorded by the data logger unit. The tests are repeated three times for each applied pressure.
Figure 4. Wheat and Wheat flour in the ring shear box
The dilatancy angle is determined from the following expression used in studies [1, 2, 6, 9, 16]:
ψ is the dilatancy angle in degree.
∆εv is the change in vertical displacement as a function of time.
∆εh is the variation of horizontal displacement as a function of time.
h0 is the initial sample height.
L is the initial sample length.
$_{\psi =\frac{\frac{\Delta {{\varepsilon }_{v}}}{{{h}_{0}}}}{\frac{\Delta {{\varepsilon }_{h}}}{L}}}$ (8)
2.3 Oedometric test
In the Oedometric test, the sample is placed in the apparatus mould of 70 mm of diameter. Vertical pressures are applied. The values of these pressures in the Oedometric test are doubled in every step with respect to the last one, and then the change in height is recorded. The vertical pressures used to determine the Oedometric modulus are: 5.6, 12.5, 25, 50, 100, 200 and 400 kPa. This latter can be calculated from:
$_{{{E}_{e}}=\frac{\Delta P}{-\frac{\Delta h}{{{h}_{0}}}}}$ (9)
∆P is the pressure change applied to the sample during the test.
∆h is the height variation during the Oedometric test.
h0 is the initial sample height.
Ee is the Oedometric modulus of the sample.
The elastic modulus can be computed using Eq. (10), this equation is used in some studies [1, 2, 6, 9, 16], which shows a relationship between the Oedometric modulus and the Poisson ratio:
$_{E={{E}_{e}}\frac{1-\nu -2{{\nu }^{2}}}{1-\nu }}$ (10)
Ee is the Oedometric modulus.
E is the elastic modulus.
ν is the Poisson ratio.
The Specific weight is one of the principal parameters used in the numerical calculations and the analytical ones for modeling the ensiled materials in silos.
The specific weight for the materials in question has been determined by the Oedometric test. Where the vertical pressure is applied to the sample respectively and the change in the sample height is noted and the volume is therefore calculated. The regression curve for each material was plotted using:
$_{{{\gamma }_{r}}=A*{{P}^{b}}}$ (11)
A and b are constants estimated statistically.
p is the applied pressure.
γr is the specific weight in (kN/m3).
The internal friction angle results and the apparent cohesion obtained from the two tests: triaxial (velocity of 0.51 mm/min) and ring shear tests (velocity of 0.32 mm/min) are presented in Table 1.
We can observe that the internal friction angle values obtained from the triaxial test are relatively higher than those obtained by the ring shear test. The two tests are completely different, in the ring shear test the deformation plan is predefined, whereas the triaxial test generally represents the real behavior. For the cement, the triaxial values are 21.76% greater than the values obtained by the ring shear test.
For the sand, wheat, granulated sugar and the wheat flour, the values obtained by the triaxial test are 20.32%, 13.04%, 25.67% and 38.42%, respectively greater than those obtained by the ring shear test. According to Ramírez et al. [9], this circumstance is due to the method with that the material is consolidated. In the ring shear apparatus, the consolidation process entails the application of vertical pressure to the upper part of the sample. Nevertheless, in the triaxial test, the consolidation process occurs as a result of the imposition of fluid pressure on the specimen. In the previous instance, consolidation exhibits a greater degree of homogeneity [9].
For the apparent cohesion, a greater value is obtained for the cement, wheat, and granulated sugar in the triaxial test. This could be due to the moisture content. We observe that the values found by the triaxial test are different from those obtained by the ring shear test, the type of the materials inside the box and the orientation of the grains could play an important role, the way to take the results too. For the cement, the apparent cohesion obtained by the triaxial test is equal to 10.77 kPa, for the sand, wheat, granulated sugar and wheat flour the values are: 4.49, 14.43, 9.72 and 3.56 kPa by the same test. However, the values obtained by the ring shear test are 1.05, 4.2, 4.15, 0.99 and 13.77, respectively for cement, sand, wheat, granulated sugar and wheat flour.
Table 1. Internal friction angle and apparent cohesion (mean ± standard deviations)
|
|
Internal Friction Angle (°) |
Apparent Cohesion (kPa) |
||
|
Material |
Triaxial Test |
Ring Shear Test |
Triaxial Test |
Ring Shear Test |
|
Cement |
34±0.71 |
26.6±0.49 |
10.77±0.71 |
1.05±0.37 |
|
Sand |
31±0.74 |
24.7±0.67 |
4.49±0.25 |
4.20±0.35 |
|
Wheat |
23±0.70 |
20±0.76 |
14.43±0.55 |
4.15±0.39 |
|
Gran-Sugar |
37±0.85 |
27.5±0.45 |
09.72±0.72 |
0.99±0.10 |
|
Wheat Flour |
38±0.34 |
23.4±0.37 |
3.56±0.41 |
13.77±0.61 |
Table 2. Values of k0 and Poisson ratio determined from Eq. (4)
|
|
k0 Coefficient |
Poisson Ratio |
||
|
Material |
Triaxial Test |
Ring Shear Test |
Triaxial Test |
Ring Shear Test |
|
Cement |
0.48 |
0.50 |
0.33 |
0.33 |
|
Sand |
0.53 |
0.63 |
0.35 |
0.39 |
|
Wheat |
0.67 |
0.74 |
0.40 |
0.42 |
|
Gran-Sugar |
0.44 |
0.60 |
0.30 |
0.38 |
|
Wheat Flour |
0.42 |
0.71 |
0.30 |
0.41 |
Using the values of internal friction angle for the triaxial and the ring shear test, and by applying the indirect method by the Eq. (4), Poisson ratio values can be determined using Eq. (3). Table 2 shows the values of k0 and the Poisson ratio by the two tests.
Table 3. k0 values determined from the Eq. (1)
|
Material |
k0 Coefficient |
||
|
100 kPa |
200 kPa |
300 kPa |
|
|
Cement |
0.185 |
0.220 |
0.233 |
|
Sand |
0.143 |
0.164 |
0.226 |
|
Wheat |
0.315 |
0.363 |
0.392 |
|
Gran-Sugar |
0.183 |
0.196 |
0.253 |
|
Wheat Flour |
0.227 |
0.201 |
0.225 |
Using these values and applying the equation Eq. (3), the Poisson ratio can be determined and shown in Table 3.
In Table 4, it can be observed that the values of the Poisson ratio increase with increasing the applied pressure. For the cement, the Poisson ratio varied from 0.16 to 0.19. For the sand, the values ranged from 0.12 to 0.18, for the wheat, they varied from 0.24 to 0.28, for the granulated sugar, they went from: 0.15 to 0.2 and for the wheat flour, the values are between 0.17 and 0.18.
Table 4. Poisson ratio calculated from (1) (mean±standard deviations)
|
Material |
Poisson Ratio |
||
|
100 kPa |
200 kPa |
300 kPa |
|
|
Cement |
0.16±0.02 |
0.18±0.02 |
0.19±0.04 |
|
Sand |
0.12±0.03 |
0.14±0.03 |
0.18±0.02 |
|
Wheat |
0.24±0.06 |
0.27±0.05 |
0.28±0.04 |
|
Gran-Sugar |
0.15±0.03 |
0.16±0.07 |
0.20±0.04 |
|
Wheat Flour |
0.18±0.02 |
0.17±0.23 |
0.18±0.02 |
Table 5. Oedometric modulus (kPa) for different materials at different pressures
|
Applied Vertical Stress (kPa) |
Oedometric Modulus, Ee (kPa) |
||||
|
Cement |
Sand |
Wheat |
Gran-Sugar |
Wheat Flour |
|
|
5.6 |
5600 |
5910 |
1520 |
3220 |
1250 |
|
12.5 |
18730 |
2020 |
1510 |
1960 |
460 |
|
25 |
21590 |
2640 |
1210 |
2080 |
620 |
|
50 |
20650 |
3770 |
1460 |
2120 |
880 |
|
100 |
29690 |
5430 |
1590 |
3510 |
1250 |
|
200 |
20650 |
8260 |
1990 |
4240 |
1680 |
|
400 |
13240 |
12750 |
2670 |
4970 |
2330 |
|
200 |
14340 |
13330 |
2790 |
5010 |
2430 |
|
100 |
7820 |
7140 |
1470 |
2510 |
1240 |
|
50 |
3960 |
3800 |
740 |
1300 |
620 |
|
25 |
2160 |
2070 |
400 |
660 |
320 |
|
12.5 |
1440 |
1040 |
210 |
330 |
170 |
|
5.6 |
820 |
600 |
120 |
180 |
90 |
Table 5 presents the Oedometric modulus values for the various materials investigated in this work. This modulus is computed from Eq. (9) as shown above. The Oedometric tests were performed in the Public Works Laboratory (LTP- Est Annaba, Algeria). The samples are subjected to a loading-unloading cycle whose pressure values are: 5.6, 12.5, 25, 50, 100, 200 and 400 kPa. The sample remains under a load increment for at least 24 hours.
Table 6 presents the elastic modulus results, computed by Eq. (10) and using the mean value of the Poisson ratio shown in Table 4.
This test procedure has been used in several works [2, 8, 9] and by other authors to determine the elastic modulus of various granular materials and powders (wheat, sugar, wheat flour and powder, etc.) that can be stored in silos. During the test, the elastic modulus increases with increasing the value of the pressure. At first, the grains are in a dispersed state, and as the test progresses, they begin to arrange for greater compactness up to a steady state. The tests do not give a fixed value, but a series of values in the range of 80 to 2300 kPa for the cement, 560 to 12630 kPa for the sand, 100 to 2280 kPa for the wheat, 170 to 4660 kPa for the granulated sugar, and 80 to 2240 kPa for the wheat flour.
Table 6. Elastic modulus (kPa) for different materials at different pressures
|
Applied Vertical Stress (kPa) |
Elastic Modulus, E (kPa) |
||||
|
Cement |
Sand |
Wheat |
Gran-Sugar |
Wheat Flour |
|
|
5.6 |
2630 |
5600 |
1240 |
3000 |
1150 |
|
12.5 |
2280 |
1910 |
1230 |
1820 |
420 |
|
25 |
2350 |
2500 |
990 |
1940 |
570 |
|
50 |
3750 |
3570 |
1190 |
1970 |
810 |
|
100 |
1780 |
5140 |
1300 |
3260 |
1150 |
|
200 |
1700 |
7820 |
1620 |
3950 |
1540 |
|
400 |
2260 |
12080 |
2180 |
4620 |
2140 |
|
200 |
2300 |
12630 |
2280 |
4660 |
2240 |
|
100 |
1170 |
6760 |
1200 |
2330 |
1140 |
|
50 |
590 |
3600 |
610 |
1210 |
570 |
|
25 |
300 |
1960 |
320 |
610 |
290 |
|
12.5 |
150 |
980 |
170 |
310 |
150 |
|
5.6 |
80 |
560 |
100 |
170 |
80 |
The ring shear test is used to determine the particle-to-wall friction coefficient of the materials studied (Figure 5). As it has been previously mentioned, this coefficient is determined for a steel wall. The sample was subjected to vertical pressures of 100, 200 and 300 kPa, respectively, and shear forces at a velocity of 0.32 mm/min. The Eq. (7) was used to determine the particle-to-steel wall friction coefficient. Table 7 shows the values of this parameter obtained under different vertical applied pressures.
(a) Test applied to wheat
(b) Test applied to granulated sugar
Figure 5. Test to determine particle-to- steel wall friction coefficient
Table 7. Particle-to- steel wall friction coefficient at different pressures applied (mean±standard deviations)
|
Particle-to-the Steel Wall Friction Coefficient |
|||
|
|
100 kPa |
200 kPa |
300 kPa |
|
Cement |
0.62±0.09 |
0.58±0.09 |
0.58±0.05 |
|
Sand |
0.43±0.07 |
0.34±0.09 |
0.36±0.04 |
|
Wheat |
0.17±0.01 |
0.29±0.05 |
0.32±0.04 |
|
Gran-Sugar |
0.50±0.05 |
0.54±0.05 |
0.46±0.04 |
|
Wheat Flour |
0.43±0.06 |
0.47±0.07 |
0.29±0.04 |
The values of this parameter varied from 0.58 to 0.62 for the cement, for the sand it varied from 0.34 to 0.43 kPa, and from 0.17 to 0.32 kPa for the wheat, for the granulated sugar it varied from 0.46 to 0.54 kPa and finally, for the wheat flour it varied from 0.29 to 0.47 kPa.
The roughness of the ring, particle sizes, and moisture content can vary in results. it was observed that a layer of the material (e.g., cement, sugar, wheat flour) stuck in the voids of the ring, this might have led to the shearing taking place a few millimeters below the surface. As a consequence, the adhesion reduces and the value of this parameter is then reduced with increasing the value of the vertical applied pressure.
For the determination of the dilatancy angle, ring shear tests were undertaken. After consolidating the sample, a vertical pressure of 200 kPa is applied and the sample is then sheared. The vertical and horizontal displacements are recorded and the dilatancy angle is determined from the Eq. (8).
Table 8 shows the dilatancy angle obtained from the various materials studied at a pressure of 200 kPa. Generally, this latter is taken as a nominal pressure in the Oedometer test. The dilatancy angle obtained by this pressure (200 kPa) is zero for the cement, sand and granulated sugar, a value of 13.27° is obtained for the wheat and 1.25° for the wheat flour. In the literature, it has been proved that, when the material to be stored in a silo has a smaller grain size, dilatancy needs not to be taken into account in the design of silos [9]; it should, however, be considered when the materials are granular. This agrees with our results.
Table 8. Dilatancy angle obtained at a vertical pressure of 200 kPa (mean± standard deviations)
|
Material |
Dilatancy Angle (°) |
|
Cement |
0±0.00 |
|
Sand |
0±0.00 |
|
Wheat |
13.27±1.69 |
|
Gran-Sugar |
0±0.00 |
|
Wheat Flour |
1.25±0.31 |
Table 9 shows the equations for the regression curves relating specific weight to the applied pressure for each material and the square root of the determination coefficient (R):
Table 9. Regression curves for each material and the square root of the determination coefficient, R
|
Materials |
Regression Curves |
R |
|
Cement |
γr =12.61 p^0.003 |
0.992 |
|
Sand |
γr= 16.22 p^0.001 |
0.999 |
|
Wheat |
γr= 8.458 p^0.001 |
0.996 |
|
Gran-Sugar |
γr= 9.3 p^0.001 |
0.992 |
|
Wheat Flour |
γr= 8.101p^0.002 |
0.997 |
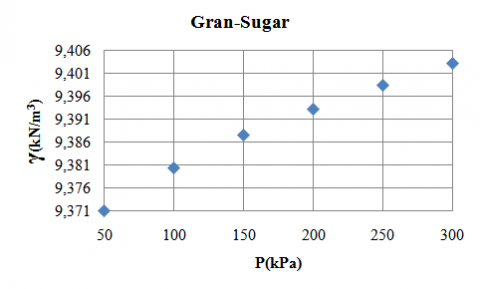
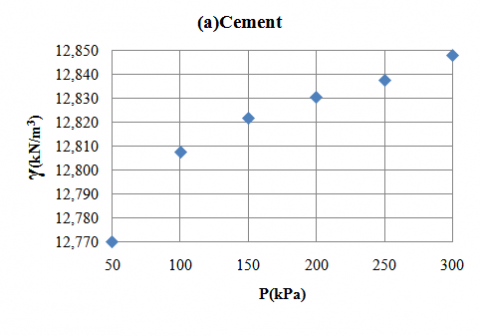
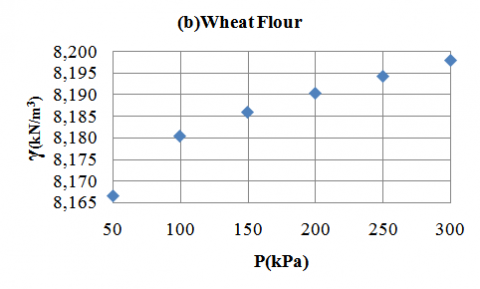
The regression curve for each material was plotted using Eq. (11). We can notice that R (square root of determination coefficient) of the curves is in the order of 0.99, which explains a strong correlation between the specific weight and the applied pressure. We can also notice that the specific weight of each material increases with increasing the applied pressure. Figures 6, 7 and 8 show the specific weight as a function of the applied vertical pressure.
Figure 6. Specific weights of Gran-Sugar according to the applied pressures
Figure 7. Specific weights of: a) Cement, b) Sand according to the applied pressures
Figure 8. Specific weights of: a) Wheat, b) Wheat flour according to the applied pressures
Concerning the internal friction angle, and as has also been mentioned, the results obtained by the triaxial test are greater than those obtained by the ring shear test. One of the parameters that might reflect the internal friction angle is the increase of the rigidity, caused for example the moisture content, where the particle matter overlaps more over the course of the consolidation process, allowing the sample to become more consolidated [9]. The results obtained in this study for wheat are relatively similar to those obtained by other authors. The internal friction angle obtained in the triaxial test has only one degree higher than that obtained by Moya et al. [11] for the Camacho wheat, and two degrees lower than the value obtained by Moya et al. [2]. However, the value obtained in the ring shear test is lower only by two degrees from that obtained by Molenda et al. [8] with the same device and the same velocity. The two results (triaxial and ring shear test results) are lower than the value proposed by the Eurocode standard [16], which is equal to 30°. However, the internal friction angle of the granulated sugar obtained in the triaxial test is two degrees higher than that obtained by Ramírez et al. [9] and five degrees higher than the value proposed by the Eurocode standard [16], while the value obtained in the ring shear test is three degrees lower than the value obtained by Ramírez et al. [9] and Molenda et al. [8]. For the wheat flour, the value obtained in the triaxial test is four degrees higher than the value obtained by Ramírez et al.[9] and six degrees for that obtained by Molenda et al. [8] with the same velocity and four degrees lower than the value proposed by the Eurocode standard [16] which is equal to 42°.The ring shear value is lower than the values obtained by Ramírez et al. [9] and Molenda et al. [8].The differences could be attributed to the apparatus used or the way the test was conducted. It should be noted that the value obtained for the sand in the triaxial test is five degrees lower than the value proposed by the Eurocode standard [16], and four degrees lower than the value used in a study by Goodey et al. [23] for the numerical model. The value obtained in the triaxial test for the cement is four degrees lower than the value proposed by the Eurocode standard [16]. The mechanical properties of these materials (sand and cement) are rarely found in the literature, and in most cases do not exist, for this reason, we recommend further tests for these two ones, to obtain comparable results.
Some discrepancies were observed between the apparent cohesion values obtained in the triaxial test and the ring shear test, except in the case of the sand. Generally, granular agricultural materials do not have cohesion. A small value of cohesion was obtained by the two tests for the materials studied. However, these values are usually small (<10 kPa). These values appear because of the moisture content of the grains. For this reason, it is called apparent cohesion [8]. The apparent cohesion is generally obtained from the regression curve in the ring shear test and from the Mohr coulomb curve in the triaxial test. The minor variations in their slope caused relatively great variations in the apparent cohesion. This limitation should be taken into account when using these results. When comparing the results obtained for the granulated sugar by the ring shear test, we found the value 0.99 kPa higher than the value obtained by Ramírez et al. [9], which equals zero. For the wheat flour, the value obtained by the triaxial test is 3 kPa higher than the value obtained by the same author.
The Poisson ratio is obtained using Eq. (3) by computing k0 from the equations Eq. (4) or Eq. (2). The value obtained by the Eq. (4) is not used to determine the remaining parameters, since the reliability of this method has been brought into some doubt [9]. Generally, as a sample becomes more consolidated with confinement, a reorganization of the particles takes place, this will be more notable as the confining pressure increases. So when increasing the confinement pressures applied, the samples became more and more rigid, and less compressible, and the lateral thrust they transmitted was greater. As a consequence, the value of the lateral pressure ratio becomes greater and the value of the Poisson ratio is lower. The highest value of the Poisson ratio is obtained for wheat, which presents the least rigidity. For the other materials, the values of the Poisson ratio are lower than the last one. These materials behave in a more plastic fashion. The Poisson ratio values obtained for the wheat flour under three confinement pressures respectively are relatively constant, which means that this material has certain rigidity. When comparing the results of this parameter with those obtained in the literature, we found that the value obtained for the wheat is similar to the ones obtained by Moya et al. [11] for the Camacho wheat. The value recommended by Molenda et al. [8] for the wheat flour belongs to the range obtained in the present work. The same note for the granulated sugar whose range is very close to the value proposed by the same authors.
The elastic modulus results have shown a decrease in the pressure of (12.5 kPa) compared to the first loading cycle, this phenomenon is due to a sudden fall in the porosity index. The maximum young modulus values are obtained at the first unloading cycle for all the materials studied. It can also be noticed that sand and granulated sugar are the most rigid materials, these materials have the highest value of young modulus. The elastic modulus values correspond to those obtained in the unloading cycles [2, 9, 8, 11]. Thus, the possible influence of the initial plastic behavior of the samples when subjected to compression was prevented.
The highest value obtained for the particle-to-wall friction coefficient was for the granulated sugar and the cement. It must be noted that the ring has been prepared by linear drilling to represent the wall roughness. So these values are obtained for the rough steel wall. We can observe that the smaller value is obtained for the wheat: by applying vertical pressure, the material with a smaller grain size will be consolidated and the friction is between two surfaces. However, for wheat, the quantity of material studied is half the volume of the mould to ensure that the friction is between the surface of the ring and grains, the adhesion is smaller, so we obtain a smaller particle-to-wall friction coefficient. In exception, the case of granulated sugar, where when applying the pressures, the sugar becomes stiffer, a layer of this sugar stuck in the drilling of the surface. So, shearing takes place few millimeters below the ring surface. Thus, reducing the adhesion; which decreases this coefficient. For the smaller grain size, the sample behaves as a united body, and the coefficient is then higher. When comparing the results obtained for this parameter with those in the literature, we found that the results obtained for the granulated sugar include the value recommended by Ramírez et al. [9] and the value proposed by the Eurocode standard [16].For the wheat flour, the range obtained includes the value proposed by the same authors [9],the values recommended by Moya et al. [2] and Molenda et al. [8], the value proposed by Moya et al. [11] and the Eurocode standard [16]. For the sand, the range obtained is quite close to the value used in studies [23, 24] in the numerical model. Finally, the values proposed by the Eurocode standard [16] are pretty close to those obtained in the present work. The dilatancy angle depends on the lateral pressure and the vertical ones, as reported by Moya et al. [2]. With values falling as the latter increases. When increasing the vertical stress, the horizontal displacement is hindered, and the overall resistance to shear increases [9]. As has been reported by other researchers, the orientation of the grains during the test is another parameter that can influence on the results of this parameter using the same sample subjected to different test conditions. In the present work, the value of 200 kPa has been used to calculate this parameter. As has been previously mentioned, this latter is taken as a nominal pressure in the Oedometric test. There is a lack of dilatancy values as well as those of the elastic modulus and the Poisson ratio in the literature. In this case, we found difficulties to compare the results of the present work. The results are compared with the values used in the numerical models, where for the sand, the dilatancy angle obtained is the same used in studies [23, 24]. For the wheat, the value obtained is quite close to the value obtained by Moya et al. [2] equal to 17.6. For the granulated sugar, the value of zero is the same as recommended in study of Ramírez et al. [9].
Several parameters may influence the specific weight: the grain size, porosity index, moisture content, and the behavior of the material itself even with the applied pressures. As already mentioned, a sample becomes more consolidated with confinement, for example, in the case of the granulated sugar, samples became more and more rigid with increasing confinement pressure, and since these samples were less compressible. As a consequence, there was a difference in pressures between the upper and the lower parts of this material stored inside silos. It should be noted that granulated sugar, wheat flour, and wheat have the lowest compressibility. While the sand and cement have fairly high compressibility: A = 16.22 and A = 12.61, respectively.
By comparing the results obtained with those of the literature, we found that the value obtained for the sand, wheat and granulated sugar are pretty close to those by the Eurocode standard [16] and Goodey and Brown [24], while for the cement the value found is 3 kPa lower than the value proposed by the Eurocode standard [16]. For the wheat flour, the value obtained in the present work is 1 kPa higher than the value proposed by the Eurocode and 2 kPa higher than the value used standard of Goodey and Brown [24] for the numerical model, and the value recommended [9], respectively.
This work presents the results of the experimental tests undertaken at the Research Laboratory of Civil Engineering and Hydraulics in Guelma, Algeria, to determine the mechanical characteristics of the following materials: cement, sand, wheat, granulated sugar and wheat flour. These results are necessary for silos design. Some of these, such as dilatancy angle, Poisson ratio and elastic modulus, are not mentioned and taken into account in standards for the silo design (e.g. the Eurocode standard). The characteristics determined are necessary for numerical methods such as finite element and discrete element methods for the nonlinear behavior modeling of the materials (elastic-plastic behavior) and for defining the interaction between the silo wall and the stored material. The conclusions drawn from this work are:
1. By determining the internal friction angle, the triaxial and the Ring shear results are different, probably due to the method by which the materials are consolidated. Generally, the triaxial test represents the real behavior of the material. The deformation plan is predefined in the ring shear test, which is not the case for the triaxial test.
2. As a general trend, the results obtained in the present work are similar to those in the literature. Because of the lack of tests applied to some materials, such as cement and sand; we have found it difficult to compare the results to know their reliability. For this reason, we recommend future tests for these materials.
3. The particle-to-wall friction coefficient is determined for a steel wall. Tests for determining this parameter with a concrete wall would be recommended.
4. When determining the particle-to-wall friction coefficient, it has been concluded that the materials with smaller grain size will be consolidated by applying the confining pressure, thus, the friction occurs between two surfaces, instead the materials with larger grain size where the friction is produced between the grains and the ring surface. This latter gives a smaller friction coefficient.
5. With regards to the Poisson ratio, when increasing the confinement pressures applied, the samples became rigid, and less compressible, the lateral thrust they transmitted will be greater. As a consequence, the value of the lateral pressure ratio becomes greater and the value of the Poisson ratio become lower.
6. The highest Poisson ratio is obtained for the wheat, which presents the least rigidity of this material. For the wheat flour, the values of this parameter under three confinement pressures respectively are relatively constant, which means that this material has certain rigidity.
7. The determination of the elastic modulus has showed that wheat flour has the lower young modulus; thus, this material is the least rigid material. However, sand and granulated sugars have the highest ones which mean that they are the most rigid materials.
8. The specific weight increases with increasing the applied pressure. The study of this parameter has proven that granulated sugar, wheat flour, and wheat have the lowest compressibility, while sand and cement have the highest one.
9. The change in several parameters should be taken into account when determining these parameters such as moisture content, porosity index, grain size, the behavior of the materials again the applied pressure
10. The geotechnical essays can be used to determine the different mechanical properties needed to the numerical design of silos and analytical calculation. These parameters are used to define the behavior of the stored material.
11. Tests should be undertaken to have a means of comparison to these results and to confirm these conclusions.
Table 10. Mechanical properties recommended for the studied material
|
Materials |
ϕ(°) |
C (kPa) |
E(kPa) |
ν |
ψ (°) |
µ |
γ(kN/m3) |
|
Cement |
34 |
1.05 |
1170 |
0.19 |
0 |
0.62 |
12.57 |
|
Sand |
31 |
4.2 |
6760 |
0.18 |
0 |
0.43 |
16.27 |
|
Wheat |
23 |
4.15 |
1200 |
0.28 |
13.27 |
0.32 |
8.49 |
|
Gran-Sugar |
37 |
0.99 |
2330 |
0.2 |
0 |
0.5 |
9.34 |
|
Wheat Flour |
38 |
3.56 |
1140 |
0.18 |
1.25 |
0.43 |
4.90 |
As has been previously mentioned, the lack of data in the literature for some variables such as the Poisson ratio, young modulus, and dilatancy angle, some of these parameters are not taken into account in standards (e.g., Eurocode). Table 10 presents the results recommended in this work for the studied materials.
The authors would like to thank the Public Works Laboratory (LTP- Est Annaba, Algeria) and their engineers for their help in carrying out the Oedometic test.
|
Ee |
The Oedometric Modulus |
|
E |
The elastic modulus |
|
ν |
The poisson ratio |
|
∆P |
The pressure change applied to the sample during the test |
|
∆h |
The height variation during the Oedometric test |
|
h0 |
The initial sample height |
|
σn |
The normal stress |
|
τr |
The tangential stress |
|
ψ |
The dilatancy angle in degree |
|
∆εv |
The change in vertical displacement as a function of time |
|
∆εh |
The variation of horizontal displacement as a function of time |
|
L |
The initial sample length |
|
ϕw |
The particle-to-wall friction angle |
|
µ |
The particle-to- wall friction coefficient |
|
k0 |
The horizontal-to-vertical pressure ratio |
|
σx |
The horizontal stress applied to the sample |
|
σy |
The maximal vertical stress applied to the sample |
[1] Moya, M., Ayuga, F., Guaita, M., Aguado, P. (2002). Mechanical properties of granular agricultural materials. Transactions of the ASAE, 45(5): 1569-1577. https://doi.org/10.13031/2013.11062
[2] Moya, M., Guaita, M., Aguado, P., Ayuga, F. (2006). Mechanical properties of granular agricultural materials, part2. Transactions of the ASABE, 49(2): 479-489. https://doi.org/10.13031/2013.20403
[3] Ayuga, F., Aguado, P., Gallego, E., Ramírez, Á. (2005). New steps towards the knowledge of silos behavior. International Agrophysics, 19(1):7-17.
[4] Ayuga, F., Aguado, P., Gallego, E., Ramírez, A. (2006). Experimental tests to validate numerical models in silos design. ASABE Annual International Meeting, Portland, Oregon, 064002. https://doi.org/10.13031/2013.20896
[5] Stasiak, M., Molenda, M., Banda, M., Gondek, E. (2015). Mechanical properties of sawdust and woodchips. Fuel, 159: 900-908. https://doi.org/10.1016/j.fuel.2015.07.044
[6] Lopes Neto, P.J., Nascimento, J.W., Marques, I.J., Costa, C.A. (2016). Mechanical properties of Grain in silos for simulation designs. Engenharia Agrícola, 36(4): 573-580. https://doi.org/10.1590/1809-4430-Eng.Agric.v36n4p573-580/2016
[7] Molenda, M., Stasiak, M. (2002). Determination of the elastic constants of cereal grains in a uniaxial compression test. International Agrophysics, 16(1): 61-65.
[8] Molenda, M., Stasiak, M., Moya, M., Ramirez, A., Horabik, J., Ayuga, F. (2006). Testing mechanical properties of food powders in two laboratories- degree of consistency of results. Institute of Agrophysics, Polish Academy of Sciences, 20(1): 37-45.
[9] Ramírez, A., Moya, M., Ayuga, F. (2009). Determination of the mechanical properties of powdered agricultural products and sugar. Particle & Particle Systems Characterization, 26(4): 220-230. https://doi.org/10.1002/ppsc.200800016
[10] Gonzalez-Montellano, C., Fuentes, J.M., Ayuga-Tellez, E., Ayuga, F. (2012). Determination of the mechanical properties of maize grains and olives required for use in DEM simulations. Journal of Food Engineering, 111(4): 553-562. https://doi.org/10.1016/j.jfoodeng.2012.03.017
[11] Moya, M., Aguado, P.J., Ayuga, F. (2013). Mechanical properties of some granular agricultural materials used in silo design. International Agrophysics, 27(2): 181-193. https://doi.org/10.2478/v10247-012-0084-9
[12] Alonso, M.F., Ramirez, G.A., González, M.C., Balaam, N., Hanaor, D.A.H., Flores-Johnson, E.A., Gan, Y.X., Chen, S.M., Shen, L.M. (2013). Experimental and numerical determination of mechanical properties of polygonal wood particles and their flow analysis in silos. Granular Matter, 15: 811-826. https://doi.org/10.1007/s10035-013-0443-7
[13] Zeng, C., Wang, Y. (2019). The shear strength and dilatancy behavior of wheat stored in silos. Complexity. https://doi.org/10.1155/2019/1547616
[14] Gallego, E., Fuentes, J.M., Ruiz, A., Hernández Rodrigo, G., Aguado, P., Ayuga, F. (2020). Determination of mechanical properties for wood pellets used in DEM simulations. International Agrophysics, 34(4): 485-494. https://doi.org/10.31545/intagr/130634
[15] Moya, M., Sánchez, D., Villar-García, J.R. (2022). Values for the mechanical properties of wheat, maize and wood pellets for use in silo load calculations involving numerical methods. Agronomy, 12(6): 1261. https://doi.org/10.3390/agronomy12061261
[16] Eurocode 1, Part 4. (2006). Basis of design and actions on structures. Part 4: Actions on Structures. Silos and Tanks. CEN, Brussels. https://www.phd.eng.br/wp-content/uploads/2015/12/en.1991.4.2006.pdf.
[17] NFP94-074: Norme française. (1994). Sols: Reconnaissance et essais- Essail’appareil triaxial de révolution. https://pdfcoffee.com/nfp94-074pdf-5-pdf-free.html.
[18] Guaita, M., Couto, A., Ayuga, F. (2003). Numerical simulation of wall pressure during discharge of granular material from cylindrical silos with eccentric hoppers. Biosystems Engineering, 85(1): 101-109. https://doi.org/10.1016/S1537-5110(03)00037-0
[19] Louetri, L.(2009). Contribution à la modélisation numérique du comportement des silos lors du remplissage et de la vidange [Evaluation numérique du chargement de la matière ensilée sur les parois des silos]. Ph.D. dissertation. Department of Civil Engineering, University of BadjiMokhar, Annaba, Algeria. https://biblio.univ-annaba.dz/wp-content/uploads/2014/09/LOUETRI-Latifa.pdf.
[20] Hammoud, F. (2006). Contribution à l’étude de la résistance au cisaillement à l’interface sol cohérent matériau solide dans le domaine des grands déplacements. Ph.D.dissertation. Department of Civil Engineering, university of Hadj Lakhdar, Batna, Algeria. http://eprints.univ-batna2.dz/182/1/HAMMOUD%20Fa
rid.pdf.
[21] ASTM D6467-13. (2016). Standard test method for torsional ring shear test to determine drained residual shear strength of cohesive soils. https://tajhizkala.ir/doc/ASTM/D6467-13.pdf.
[22] Louetri, L., Djeghaba, K., Gallego, E. (2015). Numerical simulation of reinforcement in steel slender silos having concentric hopper with carbon fiber-reinforced polymer composites. European Journal of Environmental and Civil Engineering, 20(7): 809-830. https://doi.org/10.1080/19648189.2015.1084378
[23] Goodey, R.J., Brown, C.J., Rotter, J.M. (2003). Verification of 3D model for filling pressures in square thin - walled silos. Engineering Structures, 25(14): 1773-1783. https://doi.org/10.1016/j.engstruct.2003.07.003
[24] Goodey, R.J., Brown, C.J. (2004). The influence of the base boundary condition in modeling filling of metal silo. Computers and structures, 82(7-8): 567-579. https://doi.org/10.1016/j.compstruc.2004.02.003