Amardeepak Mahadikar* | Elliriki Mamatha | Sanjeeva Murthy | Narayana B. Doddapattar
© 2020 IIETA. This article is published by IIETA and is licensed under the CC BY 4.0 license (http://creativecommons.org/licenses/by/4.0/).
OPEN ACCESS
Aluminium is one of the widely used metals in industrial sector owing to its specific features and its commercial production started in late 19th century. In its natural form it is combined with oxygen and other elements and is the third most abundant metal in the earth’s crust. It can be machined easily and has a Face Centred Cubic (FCC) structure. Aluminium alloys are an attractive alternative to ferrous materials for tribological applications due to their low density and high thermal conductivity. The microstructure of aluminium alloys can be modified and mechanical properties can be improved by alloying, cold working and heat treatment. The present work mainly focuses on the study of the effect of variation in composition on the wear characteristics and compressive strength of aluminium alloy Al6463 by varying the compositions of the two major alloying elements, Magnesium (Mg) and Silicon (Si) in the alloy. Four specimens of the aluminium alloy Al6463 are prepared each for Magnesium composition varying b/w (0.5 to 0.875%) and Silicon composition varying b/w (0.2 to 0.575%). Wear and compression tests were carried out as per ASTM standard. The results of the wear test indicate that the least wear rate was obtained for specimens of 0.750% Mg and 0.575% Si composition of the alloy Al6463 at a higher load of 1.5 kg. Also, the compression test results indicate that the specimens with 0.750% Mg and 0.575% Si compositions of the alloy Al6463 exhibit better compressive strength.
aluminium alloy, magnesium, silicon, wear, compressive strength, material composition (MC)
Aluminium and its alloys occupy a third place among commercially used engineering materials. These alloys have superior properties like excellent corrosion resistance, high electrical and thermal conductivity, high ratio of strength to weight, good machinability, formability and workability, high fatigue strength, low cost, etc. These unique characteristics of the aluminium alloys paved the way for new applications in the automotive industry [1]. However, besides these advantages, the engineering applications of some aluminium alloys are restricted due to their low resistance to abrasion and poor surface properties. The addition of alloying elements and application of appropriate heat treatment processes improves the tribological and mechanical properties of aluminium alloys. Enhanced friction and good wear resistance are desirable in applications like engine blocks and cylinder liners, brake rotors, connecting rods and pistons, gears, suspension components.
According to Carle and Blount [2] 20% of the total weight of the car is contributed by the body of the car and hence a significant weight reduction can be achieved by using aluminium alloys. This weight reduction helps to reduce the fuel consumption and CO2 emission, Chang et al. [3]. There is a high potential for increment in the use of aluminium within car body based on an analysis of the Average Compound Annual Growth Rate (CAGR) [4].
Pure aluminium melts at a temperature of 650℃ whereas aluminium alloys do not melt at a fixed temperature but over a range of temperatures which depends on the chemical composition. Aluminium-Lithium (Al-Li) alloys are the preferred choice in aerospace applications due to their lightweight and durability, Mohamed and Ismail [5]. According to Lee et al. [6] Al6061, a typical Al-Mg-Si (Aluminium-Magnesium-Silicon) alloy, is an age-hardening alloy that can be strengthened appreciably by heat treatment. The aluminium alloys of the 2XXX, 6XXX and 7XXX series belong to the group of heat-treatable alloys, while most of the alloys of the 1XXX, 3XXX, 4XXX and 5XXX series are mechanically workable alloys.
A recent industrial review revealed that there are hundreds of components from structural to engine in which the aluminium alloy is being developed for a variety of applications [7]. It is also predicted that for aluminium alloys demand increased globally at an average rate of 20% per year.
Riyadh et al. [8] studied the effect of load and speed on sliding friction coefficient of aluminium-silicon alloy using a pin-on-disk with different loads (10, 20 and 30N) at three speeds (200, 300 and 400 rev/min). Factors that have significant influence were identified. Experimental results showed that load and speed affect the coefficient of friction and wear rate of the alloy. The wear rate increased with increasing load and decreased with increasing sliding distance. The friction coefficient decreased with increasing sliding speed and decreased with increasing load. The load and sliding speed affect the frictional force. Frictional force and wear rate can be minimized by maintaining appropriate sliding speeds and loads.
Ravindran et al. [9] investigated the influence of percentages of reinforcement, load, sliding speed and sliding distance on both the wear and friction coefficient using pin-on-disk apparatus with the tests based on the design of experiments. Increasing the percentage of graphite reinforcement decreased the hardness of the composite. The sliding distance and load applied influenced the wear and friction coefficient. The study also revealed that the wear resistance of aluminium composites significantly improved by the addition of hard reinforcement (SiC) and soft reinforcement (graphite).
Palanikumar et al. [10] studied the wear behaviour of Al6061-T6 discontinuously reinforced with silicon carbide (SiC) and Aluminium oxide (Al2O3) composite. The test specimens were prepared as per ASTM standard. The experiments were conducted using a pin-on-disc wear test apparatus. Empirical relation is established to estimate the wear using statistical regression analysis and Analysis of Variance (ANOVA). The results indicated that the wear resistance of the 15% hybrid composite is better than that of the 5% composite.
Bao et al. [11] investigated the effect of TiC additions on the compressive and shear strength of Aluminium matrix composite using the stir casting method. When the loading was parallel to the hot-pressing direction of the material, lower compressive strength was obtained than when the loading was perpendicular to the hot-pressing direction.
Ravikumar et al. [12] investigated mechanical and microstructural characteristics of aluminium 6063 matrix composites. The composites were prepared by stir casting technique and reinforced with titanium carbide. Mechanical tests such as tensile, impact and hardness tests were performed for mechanical characterization of composites. Phase identification and fracture mechanism were studied by using the X-ray diffraction technique and SEM (Scanning Electron Microscopy). The results showed that the addition of titanium carbide (TiC) resulted in an increase of density, tensile strength and hardness of composites by 7.8, 19.5 and 20% respectively whereas the elongation and impact strength of the composites decreased by 35 and 31% respectively.
Mamatha et al. [13] studied the functionality of lubrication on squeeze film by using Reynolds’ equation and discussed the load effect in between the two smooth moving surface plates. The focus of the work is to optimize wear and energy losses that reduce the friction of the plates. A mathematical model is presented to analyze the effect of viscosity variation in squeeze films for both parallel and circular plates. Authors obtained various parametric results to show the effect of squeeze film on wear and energy losses.
Kumar et al. [14] investigated physical, mechanical properties and wear behaviour of Al7075 composites filled with nickel powder. The composites were prepared by stir casting method with four different percentages of nickel powder. The results of the experiments indicated that with the addition of reinforcement impact strength, compressive strength and Vicker's hardness of the composites increased while the flexural strength decreased. The wear mechanism of the composites was studied using SEM. Based on the investigations made the authors suggested the application of these composites as gear material.
Rahman et al. [15] studied the mechanical properties and wear behaviour of Al6061matrix with steel machining chips as the reinforcement. The composite was fabricated by stir casting method. The results of the investigation revealed an improvement in mechanical and tribological properties of the composite by using steel machining chips powder as the reinforcement.
The aluminium alloy was cast using the basic compositions and the two major alloying elements Mg and Si that have a significant effect on the properties of the alloy Al6463 were studied. Magnesium percentage was varied from 0.5% to 0.875% and Silicon percentage was varied from 0.2% to 0.575%. The specimens were prepared as per the ASTM standard for wear and compression tests and the experimentation was conducted. The equipment used to conduct the wear and compression tests are shown in Figures 1 and 2. The general composition of Al6463 is shown in Table 1.
Table 1. Chemical composition of aluminum alloy Al6463 in weight percentage
|
Weight% |
Al |
Si |
Fe |
Cu |
Mn |
Mg |
Zn |
Others each |
Others total |
|
Al 6463 |
Bal |
0.2 to 0.6 |
0.15 max |
0.20 max |
0.05 max |
0.45 to 0.9 |
0.05 max |
0.05 max |
0.15 max |
Regression Analysis is a statistical approach for predictive values with one or more responses. This approach can be applied to assess the effect of predictive values.
Let yi,=1, 2, -------r be the load level response values and the mean values is $\bar{y}$ then the statistical tools that are incorporated for the problem are:
Now representing wear as a response function of aluminium alloy Al6463 that can be expressed as a function difference of initial and final values.
To find significant factors regression analysis is one of the good tools that are used to calculate the wear rate with various weights.
Correlation equation is:
$R^{2}=1-\frac{\sum_{j=1}^{n} \hat{\varepsilon}_{j}^{2}}{\sum_{j=1}^{n}\left(y_{j}-\bar{y}\right)^{2}}=\frac{\sum_{j=1}^{n}\left(\hat{y}_{j}-\bar{y}\right)^{2}}{\sum_{j=1}^{n}\left(y_{j}-\bar{y}\right)^{2}}$
And regression lines:
$y^{\prime} y-n \bar{y}^{2}=\hat{y}^{\prime} \hat{y}-n(\overline{\hat{y}})^{2}+\hat{\varepsilon}^{\prime} \hat{\varepsilon}$
It can be expressed in the summation form as:
$\sum_{j=1}^{n}\left(y_{j}-\bar{y}\right)^{2}=\sum_{j=1}^{n}\left(\hat{y}_{j}-\bar{y}\right)^{2}+\sum_{j=1}^{n} \hat{\varepsilon}_{j}^{2}$
The wear test is conducted as per ASTM standard code ASTM G99-17 to study the tribological behaviour of the specimen by varying the loads in the order 0.5, 1 and 1.5 kg and varying the track radii 30, 40 and 45 mm respectively. The speed was kept constant at 1000 rpm and time was set to 180 seconds. The specimen dimensions for wear test were length 50mm and diameter 12 mm. The Ducom pin-on-disk wear test apparatus was used to conduct the wear test as shown in Figure 1. The pin specimen is held in contact with the rotating disk through an arm carrying the load. Wear is calculated by the difference in specimen weight before and after the test. An accelerated loss of material from the operating surfaces as a result of relative motion is commonly referred to as wear which can be expressed in grams (g) or milligrams (mg). It can be converted into volume loss by considering its density.
Figure 1. Wear test apparatus
$V_{l m}=\frac{\text {Weight}(g)}{\text {Density}\left(g / m m^{3}\right)}$
where, Vlm is the Volume loss or Volume of the material removed (mm3).
Wear rate is defined as the volume or mass of material removed per unit time or per unit sliding distance.
The Wear rate (Wr) is calculated by the volume loss method using the formula:
$W_{r}=\frac{V_{l m}}{L o a d^{*} S D}$
where, SD is the sliding distance in N – m.
The compression test was performed to study the mechanical behaviour of aluminium alloy Al6463 with varying percentage composition of Mg and Si. The Universal testing machine used in this study is TUE 600 as shown in Figure 2. This equipment is used to conduct the compression test for specimens of aluminium alloy Al6463 with varying Mg and Si% compositions. The compression test is conducted as per the ASTM code E9 i.e., standard test method for compression testing of metallic materials at room temperature. The specimen dimensions for the compression test are diameter 12.7 mm and length 25.4 mm respectively.
Figure 2. Universal testing machine TUE 600
6.1 Wear test
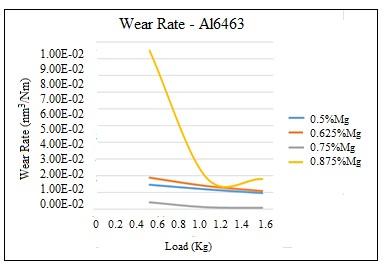
Figure 3 shows the graphical representation of wear test results given in Table 2 for Al6463 with Mg% variation. The results of the wear test indicate that the specimen with 0.75% Mg composition of the alloy Al6463 gives the least wear at a high load value of 1.5 kg whereas 0.875% Mg composition specimen gives the highest wear rate compared to other specimens at a low load value of 0.5 kg.
Figure 4 shows the graphical representation of wear test results given in Table 3 for Al6463 with Si% variation. It shows that the specimen with 0.575% Si gives the least wear at a high load of 1.5 kg whereas the specimen of 0.45% Si of the alloy Al6463 gives the highest wear rate as compared to other specimens at a low load value of 0.5 kg.
Figure 3. Graphical representation of wear test results for Al6463 with Mg% composition variation
Figure 4. Graphical representation of wear test results for Al6463 with Si% composition variation
Figure 5. Graphical representation of compression test results for Al6463 with varying Mg% composition
Table 2. Wear test results for aluminium alloy Al6463 with Mg% variation
|
Specimen |
Load (kg) |
Initial weight (g) |
Final weight (g) |
Wear rate (mm3/Nm) |
|
0.500% |
0.5 |
15.791 |
15.780 |
1.45E-02 |
|
1 |
15.780 |
15.762 |
1.18E-02 |
|
|
1.5 |
15.762 |
15.740 |
9.64E-03 |
|
|
0.625% |
0.5 |
15.250 |
15.231 |
1.87E-02 |
|
1 |
15.231 |
15.203 |
1.38E-02 |
|
|
1.5 |
15.203 |
15.170 |
1.08E-02 |
|
|
0.750% |
0.5 |
14.482 |
14.478 |
3.94E-03 |
|
1 |
14.478 |
14.476 |
9.86E-04 |
|
|
1.5 |
14.476 |
14.474 |
6.57E-04 |
|
|
0.875% |
0.5 |
14.472 |
14.400 |
9.47E-02 |
|
1 |
14.400 |
14.371 |
1.91E-02 |
|
|
1.5 |
14.371 |
14.330 |
1.80E-02 |
Table 3. Wear test results for Al6463 with Si% variation
|
Specimen |
Load (kg) |
Initial weight (g) |
Final weight (g) |
Wear rate (mm3/Nm) |
|
0.200% |
0.5 |
14.321 |
14.317 |
3.944E-03 |
|
1 |
14.317 |
14.315 |
9.861E-04 |
|
|
1.5 |
14.315 |
14.308 |
2.301E-03 |
|
|
0.325% |
0.5 |
15.934 |
15.920 |
1.227E-02 |
|
1 |
15.920 |
15.916 |
1.753E-03 |
|
|
1.5 |
15.916 |
15.909 |
2.045E-03 |
|
|
0.450% |
0.5 |
14.380 |
14.361 |
1.665E-02 |
|
1 |
14.361 |
14.341 |
8.765E-03 |
|
|
1.5 |
14.341 |
14.310 |
9.057E-03 |
|
|
0.575% |
0.5 |
15.997 |
15.994 |
2.958E-03 |
|
1 |
15.994 |
15.985 |
4.437E-03 |
|
|
1.5 |
15.985 |
15.983 |
6.574E-04 |
6.2 Compression test
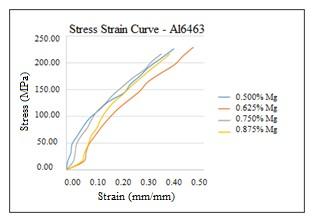
Table 4 gives the stress-strain data obtained from the compression test performed on the aluminium alloy Al6463 with varying Magnesium percentage. Figure 5 shows the graphical representation of the data given in Table 4. The results indicate that the specimen with 0.75% Mg of the alloy Al6463 has lower stress levels as compared to other specimens for the same range of loads followed by 0.875%, 0.5% and 0.625% Mg respectively.
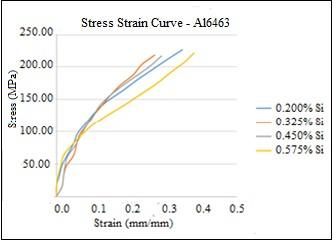
Table 5 gives the stress-strain data obtained from the compression test on the aluminium alloy Al6463 with varying Silicon percentage. Figure 6 shows the graphical representation of the data given in Table 5. The results indicate that the specimen with 0.575% has lower stress levels as compared to other specimens for the same range of loads. In other words, the specimen with 0.575% Si can withstand greater loads followed by 0.45%, 0.325% and 0.2% Si respectively.
Figure 6. Graphical representation of compression test results for Al6463 with varying Si% composition
Table 4. Compression test results for Al6463 with varying Mg% composition
|
Load (P) |
0.5% |
0.625% |
0.75% |
0.875% |
||||
|
Stress |
Strain |
Stress |
Strain |
Stress |
Strain |
Stress |
Strain |
|
|
kN |
MPa |
mm/mm |
MPa |
mm/mm |
MPa |
mm/mm |
MPa |
mm/mm |
|
2.000 |
16.014 |
0.004 |
16.429 |
0.063 |
15.591 |
0.024 |
15.665 |
0.054 |
|
4.000 |
32.029 |
0.016 |
32.857 |
0.071 |
31.182 |
0.031 |
31.329 |
0.065 |
|
6.000 |
48.043 |
0.020 |
49.286 |
0.083 |
46.773 |
0.035 |
46.994 |
0.079 |
|
8.000 |
64.057 |
0.039 |
65.715 |
0.106 |
62.365 |
0.051 |
62.658 |
0.089 |
|
10.000 |
80.072 |
0.059 |
82.143 |
0.130 |
77.956 |
0.075 |
78.323 |
0.110 |
|
12.000 |
96.086 |
0.083 |
98.572 |
0.157 |
93.547 |
0.091 |
93.988 |
0.124 |
|
14.000 |
112.101 |
0.118 |
115.000 |
0.189 |
109.138 |
0.110 |
109.652 |
0.144 |
|
16.000 |
128.115 |
0.154 |
131.429 |
0.228 |
124.729 |
0.142 |
125.317 |
0.169 |
|
18.000 |
144.129 |
0.209 |
147.858 |
0.268 |
140.320 |
0.169 |
140.982 |
0.205 |
|
20.000 |
160.144 |
0.232 |
164.286 |
0.295 |
155.912 |
0.205 |
156.646 |
0.236 |
|
22.000 |
176.158 |
0.268 |
180.715 |
0.343 |
171.503 |
0.240 |
172.311 |
0.272 |
|
24.000 |
192.172 |
0.299 |
197.144 |
0.394 |
187.094 |
0.283 |
187.975 |
0.307 |
|
26.000 |
208.187 |
0.343 |
213.572 |
0.425 |
202.685 |
0.311 |
203.640 |
0.346 |
|
28.000 |
226.283 |
0.390 |
229.524 |
0.462 |
216.561 |
0.345 |
216.501 |
0.376 |
Table 5. Compression test results for Al6463 with varying Si% composition
|
Load (P) |
0.2% |
0.325% |
0.45% |
0.575% |
||||
|
Stress |
Strain |
Stress |
Strain |
Stress |
Strain |
Stress |
Strain |
|
|
kN |
MPa |
mm/mm |
MPa |
mm/mm |
MPa |
mm/mm |
MPa |
mm/mm |
|
2.000 |
16.220 |
0.000 |
15.591 |
0.016 |
15.446 |
0.016 |
0.000 |
0.000 |
|
4.000 |
32.439 |
0.008 |
31.182 |
0.020 |
30.892 |
0.020 |
15.863 |
0.000 |
|
6.000 |
48.659 |
0.016 |
46.773 |
0.028 |
46.337 |
0.024 |
31.726 |
0.004 |
|
8.000 |
64.878 |
0.031 |
62.365 |
0.047 |
61.783 |
0.031 |
47.589 |
0.012 |
|
10.000 |
81.098 |
0.047 |
77.956 |
0.055 |
77.229 |
0.051 |
63.452 |
0.020 |
|
12.000 |
97.317 |
0.059 |
93.547 |
0.063 |
92.675 |
0.067 |
79.315 |
0.043 |
|
14.000 |
113.537 |
0.083 |
109.138 |
0.083 |
108.121 |
0.083 |
95.178 |
0.071 |
|
16.000 |
129.756 |
0.106 |
124.729 |
0.102 |
123.566 |
0.102 |
111.041 |
0.102 |
|
18.000 |
145.976 |
0.138 |
140.320 |
0.126 |
139.012 |
0.118 |
126.904 |
0.146 |
|
20.000 |
162.195 |
0.181 |
155.912 |
0.150 |
154.458 |
0.146 |
142.768 |
0.193 |
|
22.000 |
178.415 |
0.220 |
171.503 |
0.177 |
169.904 |
0.181 |
158.631 |
0.236 |
|
24.000 |
194.634 |
0.264 |
187.094 |
0.213 |
185.349 |
0.220 |
174.494 |
0.280 |
|
26.000 |
210.854 |
0.307 |
202.685 |
0.236 |
200.795 |
0.260 |
190.357 |
0.315 |
|
28.000 |
225.581 |
0.349 |
217.403 |
0.272 |
216.164 |
0.291 |
206.220 |
0.354 |
The wear and compression tests were conducted on the aluminium alloy Al6463 to study the tribological and mechanical behaviour by varying the percentage composition of the two major alloying elements Mg and Si in the alloy. The experimental investigations revealed that varying the percentage composition of Mg and Si in the alloy Al6463 had a considerable influence on the wear rate and compressive strength. The following conclusions can be drawn from the results obtained from the tests.
[1] Narasayya, Ch.V.A., Rambabu, P., Mohan, M.K., Mitra, R., Eswara Prasad, N. (2014). Tensile deformation and fracture behaviour of an aerospace aluminium alloy AA2219 in different ageing conditions. Procedia Material Science, 6: 322-330. https://doi.org/10.1016/j.mspro.2014.07.041
[2] Carle, D., Blount, G. (1999). The suitability of aluminium as an alternative material for car bodies. Materials & Design, 20(5): 267-272. https://doi.org/10.1016/S0261-3069(99)00003-5
[3] Chang, Y., Meng, Z.H., Ying, L., Li, X.D., Ma, N., Hu, P. (2011). Influence of hot press forming techniques on properties of vehicle high strength steels. Journal of Iron and Steel Research International, 18: 59-63. https://doi.org/10.1016/S1006-706X(11)60066-6
[4] Fan, X., He, Z., Yuan, S., Lin, P. (2013). Investigation on strengthening of 6A02 aluminum alloy sheet in hot forming-quenching integrated process with warm forming-dies. Materials Science and Engineering: A, 587: 221-227. https://doi.org/10.1016/j.msea.2013.08.059
[5] Mohamed, M.S., Ismail, A. (2016). Review on sheet metal forming process of aluminium alloys. In: Proceedings of the 17th Int. AMME Conference, pp. 129-141.
[6] Lee, S.H., Saito, Y., Sakai, T., Utsunomiya, H. (2002). Microstructures and mechanical properties of 6061 aluminum alloy processed by accumulative roll-bonding. Materials Science and Engineering: A, 325(1-2): 228-235. https://doi.org/10.1016/S0921-5093(01)01416-2
[7] Yamamoto, T., Sasamoto, H., Inagaki, M. (2000). Extrusion of Al based composites. Journal of Materials Science Letters, 19: 1053-1055. https://doi.org/10.1023/A:1006747305264
[8] Al-Samarai, R.A., Haftirman, Ahmad, K..R., Al-Douri, Y. (2012). Effect of load and sliding speed on wear and friction of Aluminium-Silicon casing alloy. International Journal of Scientific and Research Publications, 2(3): 1-4.
[9] Ravindran, P., Manisekar, K., Narayansamy, P., Selvakumar, N. (2012). Application of factorial techniques to study the wear of Al hybrid composites with graphite addition. Journal of Materials and Design, 39: 42-54. https://doi.org/10.1016/j.matdes.2012.02.013
[10] Palanikumar, K., Umanath, K., Selvamani, S.T. (2013). Analysis of dry sliding wear behavior of Al606/SiC/Al2O3 hybrid metal matrix composites. Journal of Composites: Part B, 53: 159-168. https://doi.org/10.1016/j.compositesb.2013.04.051
[11] Bao, Y.W., Chen, J.X., Wang, X.H., Zhou, Y.C. (2004). Shear strength and shear failure of layered machinable Ti3AlC2 ceramics. Journal of the European Ceramic Society, 24: 855-860. https://doi.org/10.1016/S0955-2219(03)00328-5
[12] Ravikumar, K., Kiran, K., Balaji, V.S. (2017). Microstructural characteristics and mechanical behavior of aluminium matrix composites reinforced with titanium carbide. Journal of Alloys and Compounds, 723: 795-801. https://doi.org/10.1016/j.jallcom.2017.06.309
[13] Mamatha, E., Reddy, C.S., Sharma, R. (2018). Effects of viscosity variation and thermal effects in squeeze films. Annales de Chimie Science des Materiaux, 42(1): 57-74. https://doi.org/10.3166/ACSM.42.57-74
[14] Kumar, A., Patnaik, A., Bhat, I.K. (2017). Investigation of nickel metal powder on tribological and mechanical properties of Al-7075 alloy composites for gear materials. Powder Metallurgy, 60(5): 371-383. https://doi.org/10.1080/00325899.2017.1318481
[15] Rahman, M.S.U., Jayahari, L. (2018). Study of mechanical properties and wear behaviour of aluminium 6061 matrix composites reinforced with steel machining chips. Materials Today: Proceedings, 5(9): 20117-20123. https://doi.org/10.1016/j.matpr.2018.06.379