
Hemerson Lizarbe-Alarcon* | Efraín Lizardo Damiano Alarcón | Fortunato De La Cruz Palomino | Diego Omar Tenorio Huarancca | Edinson José Porras Arroyo | Rocky Ayala-Bizarro | Rualth Bravo-Anaya | Harby Jair Joseph Pareja Melgar
© 2026 The authors. This article is published by IIETA and is licensed under the CC BY 4.0 license (http://creativecommons.org/licenses/by/4.0/).
OPEN ACCESS
Clayey subgrades are highly sensitive to moisture variation and often exhibit low bearing capacity, which accelerates deterioration in low-volume traffic roads. This study evaluated the effect of calcined diatomite on the plasticity, Modified Proctor compaction parameters, and soaked California Bearing Ratio (CBR) of a clayey subgrade from the AP-102 road, Sarahuarcay sector, Apurímac, Peru. The experimental program used soil from test pit C-02, selected as the most unfavorable condition within the evaluated section. A completely randomized design was applied with five calcined diatomite contents: 0%, 3%, 6%, 9%, and 12%, with three repetitions per treatment. Atterberg limits, Modified Proctor compaction, and soaked CBR tests were performed following American Society for Testing and Materials (ASTM) standards and Peruvian Ministry of Transport and Communications (MTC) procedures. The statistical analysis included descriptive statistics, one-way analysis of variance (ANOVA), Tukey's honestly significant difference (HSD) post-hoc comparisons, Pearson correlation, and empirical regression modelling. The plasticity index decreased from 18.79% in the untreated soil to 10.78% with 12% additive, while optimum moisture content increased from 15.16% to 17.90% and maximum dry density (MDD) decreased from 1.591 to 1.503 g/cm³. The highest soaked CBR was obtained with 6% calcined diatomite, reaching 9.11% at 95% MDD and 10.63% at 100% MDD. Tukey HSD test showed that 6% had the highest mean CBR, although it was statistically similar to 9%. Regression models indicated a quadratic CBR response, with predicted maximum values between approximately 7.5% and 7.6% calcined diatomite. Therefore, 6% is interpreted as the most efficient tested dosage, providing the best measured bearing response with lower additive consumption than higher dosages.
calcined diatomite, clayey subgrade, Modified Proctor, pavement engineering, plasticity index, soaked California Bearing Ratio
Clayey subgrades represent one of the most problematic conditions in road engineering because their mechanical response changes markedly with moisture variation. As water content increases, these soils tend to lose strength and stiffness, which may lead to deformation, reduced support capacity, and faster deterioration of the pavement structure, especially in low-volume traffic roads [1].
In Peru, this problem becomes especially important because many secondary and local roads still operate with unpaved or granular surfaces, where the condition of the subgrade has a direct influence on road performance [1]. This situation is also relevant in mountainous regions such as Apurímac, where rainfall intensity and duration can trigger shallow landslides and debris flows [2]. Under such wet conditions, improving moisture-sensitive subgrades is a relevant technical need for the AP-102 road in the Sarahuarcay sector.
Clayey soils are commonly improved with lime, cement, or mechanical stabilization. Even so, alternative fine siliceous materials have gained interest because they can change soil consistency, compaction behavior, and support capacity. Previous studies have reported that these materials may improve the behavior of clayey soils, although the response is not always the same and depends on factors such as dosage, particle size, mineralogical composition, and compatibility with the soil. In this context, studies on diatomite, silica-rich ashes, and related additives have shown both favorable and unfavorable results, which confirms that the performance of each additive must be evaluated for the specific soil and treatment condition [3-9].
From a materials perspective, calcined diatomite is of particular interest because of its high silica content, porous microstructure, and fine particle size. These characteristics suggest possible filler action, physicochemical interaction with the clay matrix, and, depending on the system, some degree of secondary bonding effect. In addition, the regional availability of diatomite in the Andean area gives this material practical relevance as a locally accessible alternative for road engineering applications [10-13].
Despite these advances, there is still limited experimental evidence on the use of calcined diatomite to improve clayey subgrades under real Andean conditions in Peru. In particular, there is a lack of studies evaluating, within a single experimental framework, the combined effect of calcined diatomite on plasticity, Modified Proctor parameters, and soaked California Bearing Ratio (CBR) using material obtained from the most critical condition of an actual road section.
Beyond the regional lack of information, a broader scientific issue remains unresolved. Previous studies on diatomite and other fine siliceous additives have reported favorable, neutral, and even unfavorable responses depending on the soil type, additive composition, particle-size distribution, calcination condition, and dosage [3, 4, 14-19]. This indicates that the effect of calcined diatomite cannot be assumed from its siliceous nature alone. In addition, several soil–additive systems show optimum-dosage behavior, in which the best engineering response occurs at an intermediate content rather than at the highest additive percentage [14-17]. For this reason, this study not only reports experimental measurements, but also incorporates Tukey's honestly significant difference (HSD) comparisons, correlation assessment, and regression relationships between calcined diatomite content and the measured geotechnical parameters. Recent research on Peruvian soils has also examined the relationships between basic geotechnical properties and mechanical behavior using predictive models [18]. This quantitative component strengthens the interpretation of the laboratory results and provides a simple predictive description of the dosage-response behavior of the evaluated soil.
Accordingly, this work evaluated the effect of calcined diatomite on the plasticity, Modified Proctor compaction parameters, and soaked CBR of a clayey subgrade from the AP-102 road, Sarahuarcay sector, Apurímac, Peru. The study was performed on soil from the critical test pit C-02 and aimed to identify the most efficient calcined diatomite dosage for improving the geotechnical behavior of the evaluated subgrade.
2.1 Siliceous additives for clayey soil improvement
The use of siliceous additives in clayey soils has received increasing attention because of their potential to modify plasticity, compaction behavior, and mechanical resistance. In several studies, fine silica-rich materials have reduced plasticity and improved support capacity, although the magnitude of the response varies according to soil type and additive characteristics. Investigations based on rice husk ash, sugarcane bagasse ash, silica fume, and related materials have shown that these additives may alter the consistency limits of clayey soils and produce measurable changes in compactability and soaked CBR [5-9].
A recurring finding in the literature is that many fine siliceous materials increase optimum moisture content (OMC) while decreasing maximum dry density (MDD). This behavior has been associated with their high fineness, large specific surface area, and water demand during compaction [3, 6]. In addition, some studies have shown that moderate dosages often provide better mechanical response than higher additive contents, which suggests that the treatment effect is not always linear and may follow an optimum-dosage pattern [8, 9].
2.2 Diatomite and calcined diatomite in geotechnical applications
Diatomite is a siliceous sedimentary material formed by fossilized diatom remains. Its porous microstructure and low density make it attractive as a fine additive in soil and cement-based systems [10]. When subjected to controlled thermal treatment, diatomite may undergo changes in physical and mineralogical characteristics that improve its engineering suitability, especially if the calcination regime preserves reactive silica and avoids excessive recrystallization [10].
Previous studies dealing specifically with diatomite have reported different trends. Aksakal et al. [3] found that diatomite modified soil consistency limits and compactability, increasing liquid and plastic limits while decreasing MDD and increasing OMC. In contrast, Chairullah et al. [4] reported an unfavorable response in terms of plasticity and CBR when diatomaceous earth was added to a fine-grained soil, which they attributed to the properties of the material used. These contrasting results confirm that diatomite performance is highly dependent on its composition, processing conditions, and compatibility with the treated soil.
Mechanistically, the action of calcined diatomite in clayey soils may be interpreted through the combination of a filler effect, physicochemical interaction with fine particles, and possible secondary cementitious contribution depending on the soil–water system [12, 13]. For this reason, its performance should be assessed experimentally for each case rather than assumed a priori.
2.3 Research gap and contribution of the study
The available literature shows that the response of clayey soils to diatomite and other fine siliceous additives is not uniform. Some studies report reductions in plasticity and improvements in bearing capacity, whereas others show limited benefits or even reductions in CBR. For example, Aksakal et al. [3] found that diatomite modified consistency limits and compactability, increasing OMC and reducing MDD, while Chairullah et al. [4] reported an unfavorable response in CBR after adding diatomaceous earth to a fine-grained soil. These contrasting findings indicate that diatomite should not be treated as a generic stabilizer with a fixed behavior. Its effect depends on the mineralogy of the soil, fines content, particle-size distribution, silica content, porosity, thermal treatment, calcium availability, and dosage.
Recent studies on related siliceous materials support the same interpretation. Precipitated silica, silica fume, metakaolin, calcite–silica fume mixtures, and diatomaceous-earth-treated soils have shown that the improvement of clayey or fine-grained soils depends strongly on the compatibility between the additive and the soil matrix [14-19]. In several cases, the best mechanical response was obtained at an intermediate dosage, after which additional fine material produced no further improvement or caused a partial reduction in performance [14-18]. This optimum-dosage behavior remains relevant because it cannot be explained by additive content alone; it requires analysis of compaction response, water demand, particle packing, and possible bonding mechanisms.
Therefore, the research gap addressed in this study is both regional and scientific. Regionally, there is limited evidence on the use of calcined diatomite from an Andean source for improving clayey subgrades in Peru. Scientifically, there is still a need to quantify how calcined diatomite modifies plasticity, compaction, and soaked CBR under a single experimental framework, and to describe whether the response follows linear or non-linear dosage-dependent behavior. This study contributes to that gap by combining standardized laboratory measurements, analysis of variance (ANOVA)-based inference, Tukey HSD post-hoc comparisons, correlation assessment, and regression modelling for a critical clayey subgrade obtained from the AP-102 road.
3.1 Study area and sampling
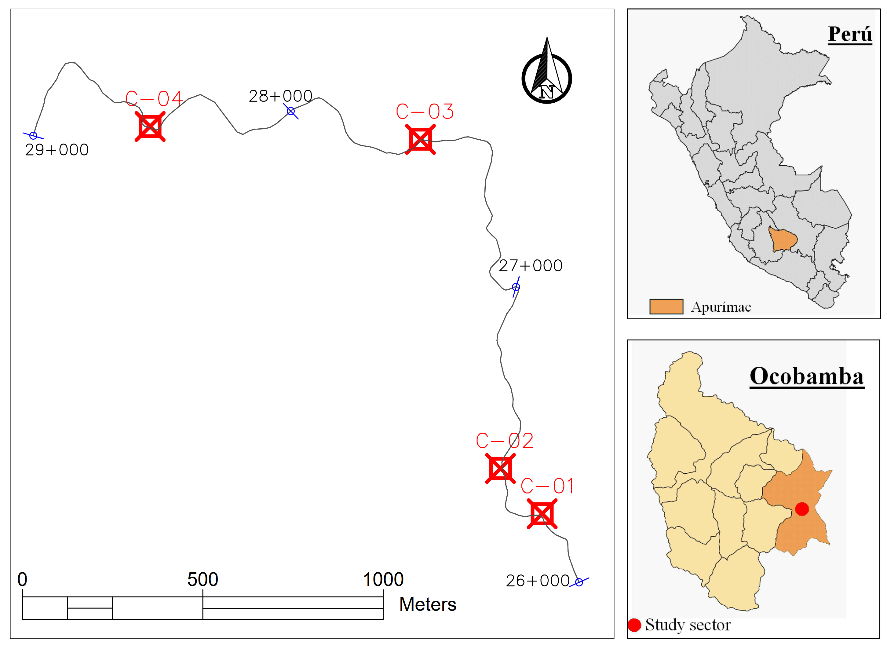
The study was conducted along the AP-102 road, Sarahuarcay sector, in the district of Ocobamba, province of Chincheros, Apurímac, Peru. The evaluated section extended from km 26+000 to km 29+000 (approximately 3 km), where clayey subgrade problems were identified [1]. Figure 1 shows the study area, and Table 1 gives the test-pit locations.
The four test pits were used to compare the subgrade conditions along the evaluated section. The selection of the base soil for the laboratory program is described in the following subsection.
Figure 1. Location of the study area and test pits in the AP-102 road section, Sarahuarcay sector, Apurímac, Peru
Table 1. Location of test pits in the AP-102 road section
|
Test Pit |
UTM Northing |
UTM Easting |
Elevation (m) |
Chainage |
|
C-01 |
8504179.74 |
661188.09 |
2672.00 |
26+220 |
|
C-02 |
8504305.20 |
661072.49 |
2661.00 |
26+440 |
|
C-03 |
8505217.08 |
660850.71 |
2574.00 |
27+700 |
|
C-04 |
8505252.35 |
660101.00 |
2529.00 |
28+500 |
Notes: Coordinates correspond to the field survey used to identify and sample the subgrade along the AP-102 road section. UTM = Universal Transverse Mercator.
3.2 Initial geotechnical characterization and selection of the critical soil
Initial characterization included soil classification, Atterberg limits, fines content, and bearing capacity (Table 2). Soil classification was performed according to ASTM D2487 [20] for the Unified Soil Classification System (USCS) and American Association of State Highway and Transportation Officials (AASHTO) M 145 for the AASHTO system [21]. The consistency limits used for the geotechnical comparison of the test pits were determined according to ASTM D4318 [22].
Table 2. Initial geotechnical characterization and selection of the critical soil
|
Test Pit |
USCS |
AASHTO |
LL (%) |
PL (%) |
PI (%) |
CBR (%) |
Fines (%) |
|
C-01 |
CL |
A-7-6 (7) |
40.86 |
23.30 |
17.56 |
4.55 |
54.20 |
|
C-02 |
CL |
A-7-6 (8) |
41.63 |
23.13 |
18.50 |
3.87 |
56.68 |
|
C-03 |
SC |
A-2-6 (1) |
27.95 |
13.90 |
14.05 |
5.30 |
28.38 |
|
C-04 |
SC |
A-2-6 (0) |
28.05 |
14.82 |
13.23 |
5.65 |
27.76 |
Notes: LL = liquid limit; PL = plastic limit; PI = plasticity index. C-02 was selected as the critical soil because it exhibited the highest fines content and plasticity and the lowest CBR among the evaluated test pits. CBR = California Bearing Ratio; USCS = Unified Soil Classification System; AASHTO = American Association of State Highway and Transportation Officials.
After comparing the four test pits, the soil from C-02 was used as the base material for the laboratory program. This point combined the highest fines content and plasticity with the lowest CBR, making it the most unfavorable subgrade condition in the evaluated section. Working with this soil allowed the effect of calcined diatomite to be assessed under the most demanding condition found along the AP-102 road section.
3.3 Calcined diatomite material
The diatomite used in the study was obtained from the Tambillo quarry. After extraction, the material was air-dried, milled, and reduced to representative portions. Controlled calcination was then performed at 700 °C for 2 h, a thermal regime selected to standardize the additive while preserving the favorable siliceous characteristics reported in the literature [10, 11].
The main physical and chemical properties considered relevant to the experimental program are summarized in Table 3.
Table 3. Characterization of the calcined diatomite used as an additive
|
Property |
Value |
Unit |
|
Specific gravity |
2.247 |
— |
|
Loss on ignition |
1.7 |
% |
|
Passing No. 200 sieve |
100.0 |
% |
|
Passing No. 325 sieve |
20.3 |
% |
|
pH |
6.97 |
— |
|
Chlorides |
426.0 |
ppm |
|
Sulfates |
37.1 |
ppm |
|
Total soluble salts |
464.2 |
ppm |
|
SiO₂ |
94.797 |
% |
Notes: The calcined diatomite was obtained from the Tambillo quarry and thermally treated at 700 °C for 2 h before use in the experimental program.
The mass of calcined diatomite added to each mixture was determined according to Eq. (1).
$M_{C D}=(\% C D / 100) M_S$ (1)
where, $M_{C D}$ is the mass of calcined diatomite, %$C D$ is the calcined diatomite content expressed as a percentage of dry soil mass, and $M_S$ is the dry soil mass.
3.4 Experimental design
The experimental program was conducted under a Completely Randomized Design with one factor: calcined diatomite content. Five treatment levels were evaluated: 0%, 3%, 6%, 9%, and 12% by dry weight of soil. Three independent repetitions were prepared for each treatment, and each experimental unit consisted of a separately prepared soil–diatomite mixture.
3.5 Laboratory testing
The laboratory program was organized around three groups of tests: Atterberg limits, Modified Proctor compaction, and soaked CBR. The Atterberg tests were used to obtain the liquid limit (LL), plastic limit (PL), and plasticity index (PI) of each mixture. The Modified Proctor test provided the OMC and MDD for every calcined diatomite content, while the soaked CBR test was carried out at 95% and 100% of MDD after 96 h of immersion.
All mixtures were tested under the same laboratory criteria. The laboratory procedures followed ASTM D4318 [22] for Atterberg limits, ASTM D1557 [23] for Modified Proctor compaction, and ASTM D1883 for soaked CBR [24]. These tests were also aligned with the corresponding Peruvian Ministry of Transport and Communications (MTC) procedures: MTC E 110/E 111 for Atterberg limits, MTC E 115 for Modified Proctor compaction, and MTC E 132 for soaked CBR [25]. Moisture conditioning, compaction, soaking, and testing procedures were kept consistent for all treatments, so that the effect of calcined diatomite content could be compared under equivalent conditions.
3.6 Statistical analysis
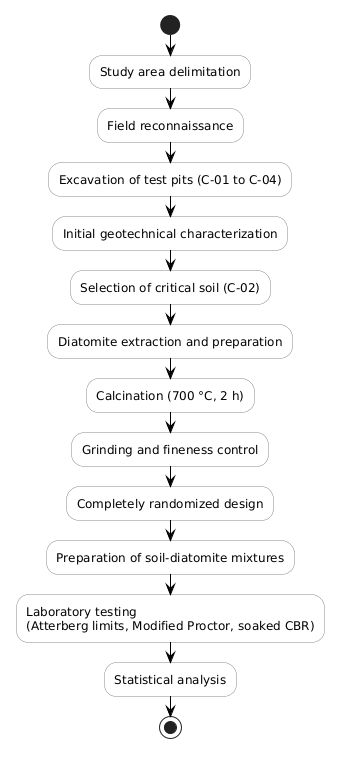
Figure 2 shows the study workflow, including the descriptive statistics calculated for each treatment and response variable. The mean, standard deviation, and coefficient of variation were used to describe central tendency, experimental scatter, and consistency among the three repetitions. This step was necessary because mean values alone do not show whether the measured differences were associated with low or high variability.
Figure 2. Experimental workflow of the study
A one-way ANOVA was then applied to determine whether calcined diatomite content produced statistically significant differences among treatments. The factor was calcined diatomite content, with five levels: 0%, 3%, 6%, 9%, and 12%. The response variables were PI, OMC, MDD, soaked CBR at 95% MDD, and soaked CBR at 100% MDD. The significance level was set at α = 0.05. When the ANOVA result was significant, Tukey’s HSD test was used for post-hoc multiple comparisons to identify homogeneous groups among the evaluated dosages [26].
In addition to statistical significance, effect sizes were calculated using eta squared (η²) and omega squared (ω²). These indicators were included to evaluate the magnitude of the treatment effect and not only the probability of observing differences among treatment means. Complementary correlation and regression analyses were also performed to describe the quantitative dosage-response relationships between calcined diatomite content and the measured geotechnical parameters.
3.7 Correlation and regression modelling
Pearson correlation coefficients were calculated using the 15 independent observations obtained from the five calcined diatomite contents and three repetitions per treatment. This analysis was used to evaluate the direction and intensity of the linear association between calcined diatomite content and each response variable.
Regression models were then fitted to describe the dosage-response behavior of the evaluated parameters. Since PI, OMC, and MDD showed monotonic behavior within the tested dosage range, simple linear regression models were adopted for these variables. In contrast, soaked CBR increased up to an intermediate dosage and then decreased at higher contents; therefore, second-order polynomial models were adopted for soaked CBR at 95% and 100% of MDD.
The general forms of the fitted models were:
$Y=\beta 0+\beta 1 x+\varepsilon$ (2)
$Y=\beta 0+\beta 1 x+\beta 2 x^2+\varepsilon$ (3)
where, Y is the response variable, x is the calcined diatomite content expressed as a percentage by dry mass of soil, β0 is the intercept, β1 and β2 are regression coefficients, and ε is the residual error. These empirical relationships were used as descriptive predictive models for the evaluated C-02 soil only. They should not be interpreted as universal design equations for all clayey subgrades.
4.1 Mean geotechnical response of the treated subgrade
Table 4 summarizes the response of the untreated soil and the mixtures prepared with calcined diatomite using mean values and standard deviations. As the additive content increased, PI tended to decrease, OMC increased, and MDD decreased. The soaked CBR values also improved with respect to the untreated soil, although the highest bearing response was not obtained at the largest additive content.
Table 4. Descriptive statistics of the treated subgrade response
|
Treatment |
Calcined Diatomite (%) |
PI (%) |
OMC (%) |
MDD (g/cm³) |
Soaked CBR at 95% MDD (%) |
Soaked CBR at 100% MDD (%) |
|
T0 |
0 |
18.79 ± 0.27 |
15.16 ± 0.09 |
1.591 ± 0.007 |
3.75 ± 0.48 |
4.27 ± 0.56 |
|
T1 |
3 |
15.79 ± 1.28 |
15.60 ± 0.10 |
1.568 ± 0.008 |
6.72 ± 0.81 |
8.04 ± 1.04 |
|
T2 |
6 |
14.01 ± 0.99 |
16.28 ± 0.07 |
1.544 ± 0.006 |
9.11 ± 0.69 |
10.63 ± 0.95 |
|
T3 |
9 |
12.49 ± 1.61 |
17.22 ± 0.11 |
1.525 ± 0.005 |
8.22 ± 0.87 |
9.47 ± 0.80 |
|
T4 |
12 |
10.78 ± 1.42 |
17.90 ± 0.26 |
1.503 ± 0.008 |
7.26 ± 0.47 |
8.46 ± 0.45 |
Notes: Values are presented as mean ± standard deviation based on three independent repetitions per treatment. PI = plasticity index; OMC = optimum moisture content; MDD = maximum dry density; CBR = California Bearing Ratio.
The inclusion of standard deviations shows that the experimental scatter was generally low for OMC and MDD, and moderate for PI and soaked CBR. The CBR results showed greater variability than the compaction parameters, which is expected because soaked CBR is sensitive to specimen preparation, moisture condition, density, soaking response, and penetration behavior. Even so, all calcined-diatomite-treated mixtures showed higher mean soaked CBR values than the untreated soil.
4.2 Effect of calcined diatomite on plasticity
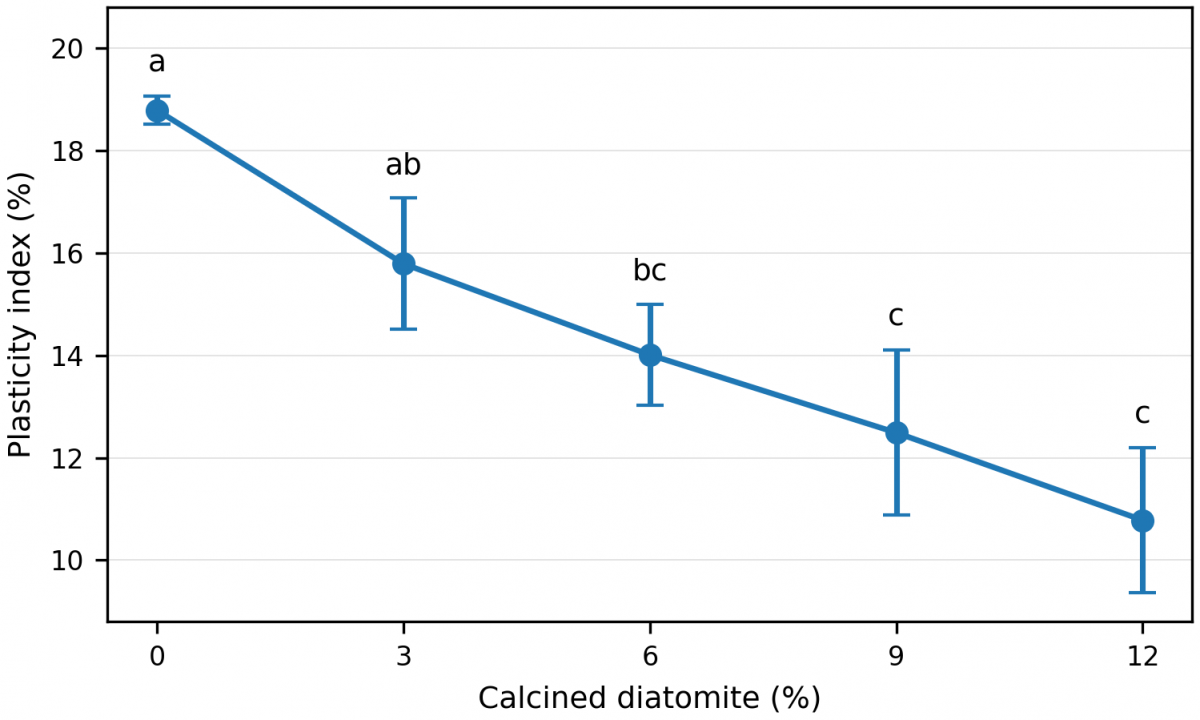
Figure 3 shows a progressive reduction in PI as calcined diatomite content increased. The error bars indicate that the dispersion was moderate, and the Tukey letters show that the untreated soil differed from the higher-dosage mixtures, while adjacent treatments partly shared homogeneous groups.
This reduction means that the C-02 soil behaved plastically within a smaller moisture interval after treatment, which is favorable for a subgrade exposed to rainfall or prolonged soaking.
4.3 Effect of calcined diatomite on compaction behavior
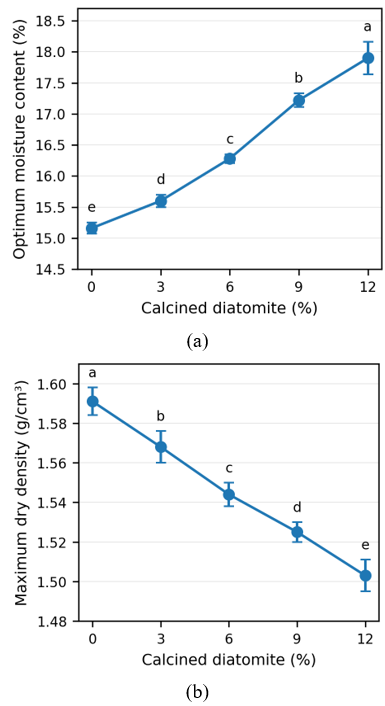
Figure 4 presents the effect of calcined diatomite on the Modified Proctor parameters. OMC increased steadily, while MDD decreased progressively as the additive content increased. The small error bars confirm that the compaction results were consistent among repetitions.
The Tukey letters indicate statistically separated groups for OMC and MDD, showing that the additive changed the compaction condition at each dosage. In practical terms, the treated soil required more water for compaction and reached lower dry density than the untreated material.
4.4 Effect of calcined diatomite on soaked California Bearing Ratio
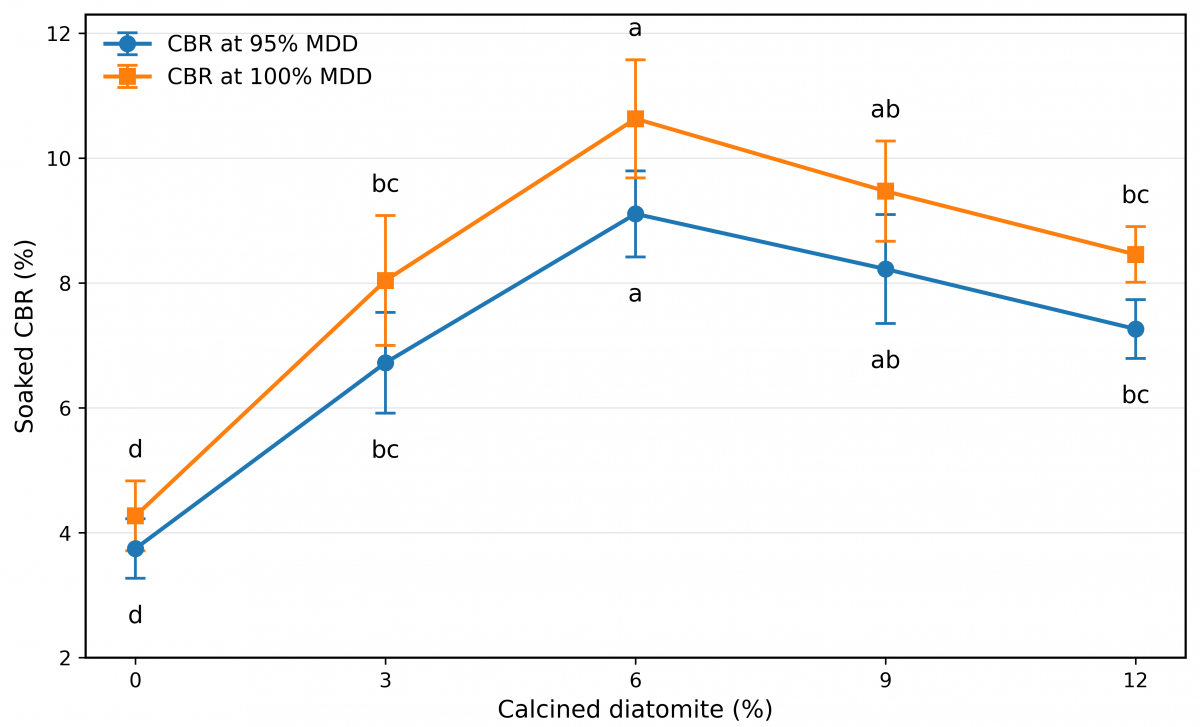
Figure 5 shows that soaked CBR improved in all treated mixtures compared with the untreated soil. In both compaction conditions, the highest mean CBR was obtained at 6% calcined diatomite, and the response decreased moderately at 9% and 12%.
The error bars show moderate experimental scatter, which is expected in soaked CBR testing because the result is sensitive to specimen preparation, density, moisture condition, and penetration response. The Tukey letters indicate that the 6% and 9% treatments shared at least one homogeneous-group letter, so their difference was not statistically significant at α = 0.05.
Therefore, the 6% mixture is interpreted as the best measured and most efficient dosage within the tested range, rather than as a dosage that was statistically superior to 9% in all comparisons.
4.5 Statistical significance and quantitative dosage-response analysis
The analyses summarized in Tables 5, 6, 7, and 8 confirm that calcined diatomite content significantly affected all evaluated variables. The effect sizes were large in every case, indicating that the treatment explained an important proportion of the experimental variability. However, ANOVA only shows that at least one treatment differs from the others; therefore, Tukey HSD post-hoc comparisons were required to identify which dosages formed statistically different groups.
The Tukey HSD results clarify the statistical significance of the optimum dosage. For soaked CBR at both 95% and 100% MDD, the 6% treatment showed the highest mean value and differed clearly from the untreated soil. However, the 6% and 9% treatments shared at least one homogeneous-group letter, indicating that their difference was not statistically significant at α = 0.05. Therefore, 6% should be interpreted as the most efficient tested dosage because it achieved the highest measured bearing response with lower additive consumption, rather than as a dosage statistically superior to 9% in all comparisons.
The regression results provide an additional quantitative description of the experimental response. PI, OMC, and MDD were adequately represented by linear models, confirming that the influence of calcined diatomite on plasticity and compaction parameters was monotonic within the evaluated range. In contrast, soaked CBR was better represented by quadratic models, confirming that bearing capacity did not increase indefinitely with additive content.
For CBR at 95% MDD, the fitted quadratic model predicts a maximum response at approximately 7.6% calcined diatomite. For CBR at 100% MDD, the predicted maximum is approximately 7.5%. These values fall between the 6% and 9% experimental treatments, which is consistent with the Tukey HSD results and the observed CBR response. Since the experimental program used discrete dosage intervals of 3%, the 6% treatment is interpreted as the most efficient tested dosage because it produced the highest measured CBR while requiring less additive than the 9% mixture.
Table 5. Summary of inferential analysis and treatment effect
|
Variable |
F Value |
p-Value |
η² |
ω² |
Trend |
|
PI |
19.553 |
< 0.001 |
0.887 |
0.832 |
Linear decreasing |
|
OMC |
183.269 |
< 0.001 |
0.987 |
0.980 |
Linear increasing |
|
MDD |
78.479 |
< 0.001 |
0.969 |
0.954 |
Linear decreasing |
|
Soaked CBR at 95% MDD |
26.767 |
< 0.001 |
0.915 |
0.873 |
Quadratic |
|
Soaked CBR at 100% MDD |
27.574 |
< 0.001 |
0.917 |
0.876 |
Quadratic |
Notes: η² and ω² indicate effect size. PI = plasticity index; OMC = optimum moisture content; MDD = maximum dry density; CBR = California Bearing Ratio.
Table 6. Tukey HSD homogeneous groups for the evaluated variables
|
Variable |
Treatment |
Calcined Diatomite (%) |
Mean ± SD |
Tukey Group |
|
PI (%) |
T0 |
0 |
18.79 ± 0.27 |
a |
|
PI (%) |
T1 |
3 |
15.79 ± 1.28 |
ab |
|
PI (%) |
T2 |
6 |
14.01 ± 0.99 |
bc |
|
PI (%) |
T3 |
9 |
12.49 ± 1.61 |
c |
|
PI (%) |
T4 |
12 |
10.78 ± 1.42 |
c |
|
OMC (%) |
T0 |
0 |
15.16 ± 0.09 |
e |
|
OMC (%) |
T1 |
3 |
15.60 ± 0.10 |
d |
|
OMC (%) |
T2 |
6 |
16.28 ± 0.07 |
c |
|
OMC (%) |
T3 |
9 |
17.22 ± 0.11 |
b |
|
OMC (%) |
T4 |
12 |
17.90 ± 0.26 |
a |
|
MDD (g/cm³) |
T0 |
0 |
1.591 ± 0.007 |
a |
|
MDD (g/cm³) |
T1 |
3 |
1.568 ± 0.008 |
b |
|
MDD (g/cm³) |
T2 |
6 |
1.544 ± 0.006 |
c |
|
MDD (g/cm³) |
T3 |
9 |
1.525 ± 0.005 |
d |
|
MDD (g/cm³) |
T4 |
12 |
1.503 ± 0.008 |
e |
|
Soaked CBR at 95% MDD (%) |
T0 |
0 |
3.75 ± 0.48 |
d |
|
Soaked CBR at 95% MDD (%) |
T1 |
3 |
6.72 ± 0.81 |
bc |
|
Soaked CBR at 95% MDD (%) |
T2 |
6 |
9.11 ± 0.69 |
a |
|
Soaked CBR at 95% MDD (%) |
T3 |
9 |
8.22 ± 0.87 |
ab |
|
Soaked CBR at 95% MDD (%) |
T4 |
12 |
7.26 ± 0.47 |
bc |
|
Soaked CBR at 100% MDD (%) |
T0 |
0 |
4.27 ± 0.56 |
d |
|
Soaked CBR at 100% MDD (%) |
T1 |
3 |
8.04 ± 1.04 |
bc |
|
Soaked CBR at 100% MDD (%) |
T2 |
6 |
10.63 ± 0.95 |
a |
|
Soaked CBR at 100% MDD (%) |
T3 |
9 |
9.47 ± 0.80 |
ab |
|
Soaked CBR at 100% MDD (%) |
T4 |
12 |
8.46 ± 0.45 |
bc |
Notes: Means sharing at least one letter within the same variable are not significantly different according to Tukey’s HSD test at α = 0.05. SD = standard deviation; PI = plasticity index; OMC = optimum moisture content; MDD = maximum dry density; CBR = California Bearing Ratio; HSD = honestly significant difference.
Table 7. Empirical regression relationships between calcined diatomite content and geotechnical response
|
Variable |
Recommended Model |
Regression Equation |
R² |
Interpretation |
|
PI (%) |
Linear |
PI = 18.236 − 0.644x |
0.980 |
Plasticity decreases almost linearly as calcined diatomite content increases. |
|
OMC (%) |
Linear |
OMC = 15.012 + 0.237x |
0.987 |
The water demand of the mixture increases with additive content. |
|
MDD (g/cm³) |
Linear |
MDD = 1.590 − 0.0073x |
0.999 |
Dry density decreases almost linearly as calcined diatomite content increases. |
|
Soaked CBR at 95% MDD (%) |
Quadratic |
CBR95 = 3.717 + 1.345x − 0.0884x² |
0.968 |
CBR increases up to an intermediate dosage and then decreases. |
|
Soaked CBR at 100% MDD (%) |
Quadratic |
CBR100 = 4.311 + 1.595x − 0.1056x² |
0.966 |
CBR follows the same optimum-dosage response under maximum laboratory compaction. |
Table 8. Pearson correlation between calcined diatomite content and measured parameters
|
Response Variable |
Pearson r |
p-Value |
Interpretation |
|
PI (%) |
−0.932 |
<0.001 |
Strong negative linear association |
|
OMC (%) |
0.986 |
<0.001 |
Very strong positive linear association |
|
MDD (g/cm³) |
−0.984 |
<0.001 |
Very strong negative linear association |
|
Soaked CBR at 95% MDD (%) |
0.632 |
0.011 |
Moderate positive association affected by non-linear response |
|
Soaked CBR at 100% MDD (%) |
0.618 |
0.014 |
Moderate positive association affected by non-linear response |
Pearson correlation confirms the direction of the main dosage-response relationships. Calcined diatomite content showed a strong negative association with PI and MDD and a very strong positive association with OMC. The CBR correlations were positive but lower than those obtained for PI, OMC, and MDD. This difference is expected because CBR did not follow a strictly linear path; instead, it showed a peak at an intermediate dosage. Therefore, correlation analysis is useful for describing the general association, whereas the quadratic regression models provide a better representation of the soaked CBR response.
The revised results show two different response patterns. The first pattern was monotonic and affected plasticity and compaction parameters: PI and MDD decreased as calcined diatomite content increased, whereas OMC increased. The second pattern was non-monotonic and controlled soaked CBR: bearing capacity increased up to an intermediate dosage and then decreased at higher contents. This distinction is important because adding more calcined diatomite does not necessarily produce a proportional improvement in bearing capacity.
The role of calcined diatomite can be interpreted from the characteristics of the additive and its interaction with the clayey matrix. The material used in this study was a fine siliceous additive, with 94.797% SiO₂ and 100% passing the No. 200 sieve. Its first contribution was therefore likely related to a filler effect, in which fine particles occupy part of the voids within the soil matrix and modify particle arrangement. Filler action and pore refinement have been reported as relevant mechanisms in fine siliceous systems, especially when particle size and surface characteristics allow the additive to modify packing and internal structure [10, 12, 13].
However, the same fine and porous nature of calcined diatomite also increases water demand. This explains why OMC increased while MDD decreased as additive content increased. The treated mixtures required more water to reach their compaction state, and the compacted dry density became lower than that of the untreated soil. Similar compaction behavior has been reported for diatomite and other fine silica-rich additives, although the direction and magnitude of the response depend on the soil, additive source, fineness, porosity, and dosage [3, 6, 27, 28].
The optimum CBR response at 6% can be understood as the point where several effects reached a favorable balance. At low to intermediate dosage, calcined diatomite reduced plasticity, contributed fine particles to the soil matrix, and improved the soaked penetration resistance. At higher dosages, however, the excess of fine and porous material probably increased water demand, reduced dry density, and produced a less efficient packing condition. In addition, if the calcium available in the soil–water system is limited, the additional silica supplied by calcined diatomite may not generate additional cementitious bonding. Under that condition, part of the added material may behave mainly as unreacted fine filler rather than as a strength-forming phase.
The regression models support this interpretation. For soaked CBR, the response was quadratic rather than linear, with predicted maximum values at approximately 7.6% calcined diatomite for CBR at 95% MDD and 7.5% for CBR at 100% MDD. These predicted values fall between the 6% and 9% experimental treatments. Therefore, 6% should be understood as the best discrete dosage tested in the experimental program, not as an exact universal optimum. This interpretation is also consistent with the Tukey HSD results, which showed that the 6% treatment had the highest mean CBR but was statistically similar to the 9% treatment.
From a practical standpoint, the 6% dosage is more efficient than 9% because increasing the additive content from 6% to 9% represents a 50% increase in calcined diatomite consumption without producing a higher measured CBR. This makes 6% the most favorable tested dosage in terms of measured bearing response and material use. The result agrees with several studies on siliceous and pozzolanic additives where intermediate dosages provided the best engineering response [14-18, 29]. Nevertheless, other studies have reported different optimum contents or even unfavorable behavior, confirming that the optimum dosage is system-dependent and must be verified experimentally [3, 4, 19].
The comparison with previous diatomite studies is especially important. Aksakal et al. [3] showed that diatomite can modify soil consistency limits and compactability, while Chairullah et al. [4] reported that diatomaceous earth may increase plasticity and reduce CBR when the material and soil conditions are not favorable. These opposite results explain why the characterization of the additive used in this study was necessary. The high SiO₂ content, fine particle size, low loss on ignition, and controlled calcination regime of the Tambillo diatomite help explain why the evaluated soil showed a favorable response. Recent studies on treated diatomaceous earth and silica-based stabilizers also confirm that additive source, processing, and dosage strongly influence the final soil response [16-19, 30-33].
The engineering relevance of the CBR improvement is direct. According to the Peruvian MTC subgrade classification, a CBR lower than 6% corresponds to an insufficient or inadequate subgrade condition, whereas values between 6% and 10% correspond to a regular subgrade and values between 10% and 20% correspond to a good subgrade [1]. In this study, the untreated C-02 soil had a soaked CBR of 3.75% at 95% MDD, which corresponds to an insufficient subgrade. With 6% calcined diatomite, soaked CBR reached 9.11% at 95% MDD, placing the material within the regular subgrade range. At 100% MDD, CBR increased from 4.27% to 10.63%, reaching the lower limit of a good subgrade condition.
This improvement means that the treated material offers greater resistance to penetration after soaking and may provide more reliable support under wet service conditions. Even so, the CBR increase should not be directly converted into pavement thickness reduction without project-specific pavement design. For construction control, the treated soil should be compacted using the OMC and MDD of the soil–diatomite mixture, not the Proctor parameters of the untreated soil. This is important because calcined diatomite increased OMC and reduced MDD, so field compaction specifications must be adjusted to the treated material.
The applicability of the findings is limited by the use of a single critical clayey soil obtained from test pit C-02. This choice was appropriate because C-02 represented the most unfavorable condition in the evaluated AP-102 road section, but it does not imply that the same dosage will be optimal for all clayey subgrades. Soils with the same USCS or AASHTO classification may differ in mineralogy, fines content, plasticity, soluble salts, pH, calcium availability, pore structure, and moisture regime. These differences can change the interaction between soil and calcined diatomite.
Accordingly, the 6% dosage should be considered a technically supported reference for soils with behavior similar to the evaluated C-02 material, not a universal prescription. Application to other road sections should be preceded by soil characterization, additive characterization, Modified Proctor testing, and soaked CBR verification under the expected field compaction and moisture conditions. Field validation is also required because laboratory conditions do not fully reproduce construction variability, drainage, rainfall exposure, traffic loading, seasonal moisture changes, and long-term durability.
Overall, calcined diatomite acted as an effective modifier of the evaluated clayey subgrade under laboratory conditions. Its main contribution was not a continuous increase in strength with increasing dosage, but an optimum-dosage response in which plasticity reduction, water demand, compacted density, and soaked bearing capacity reached the most favorable balance within the tested range.
This study evaluated the effect of calcined diatomite on the plasticity, Modified Proctor compaction parameters, and soaked CBR of a critical clayey subgrade obtained from the AP-102 road, Sarahuarcay sector, Apurímac, Peru.
Calcined diatomite reduced the plasticity of the evaluated C-02 soil. The plasticity index decreased from 18.79% in the untreated soil to 10.78% with 12% calcined diatomite, indicating that the treated soil became less plastic and less sensitive to moisture variation.
The additive also modified the compaction behavior of the soil. As calcined diatomite content increased, OMC increased from 15.16% to 17.90%, while MDD decreased from 1.591 to 1.503 g/cm³. Therefore, field compaction of treated material should be controlled using the Proctor parameters of the soil–diatomite mixture, not those of the untreated soil.
The most favorable bearing response was obtained with 6% calcined diatomite. At this dosage, soaked CBR reached 9.11% at 95% MDD and 10.63% at 100% MDD. This represents a practical improvement in subgrade classification, from an insufficient condition in the untreated soil to a regular or good condition depending on the compaction level considered.
The Tukey HSD results showed that 6% had the highest mean CBR, although it was statistically similar to 9%. Therefore, 6% is interpreted as the most efficient tested dosage because it provided the best measured bearing response with lower additive consumption, not because it was statistically superior to 9% in all comparisons.
The regression models confirmed that PI, OMC, and MDD followed mainly linear dosage-response relationships, whereas soaked CBR followed a quadratic trend. The predicted maximum CBR occurred between approximately 7.5% and 7.6% calcined diatomite, which is consistent with the experimental response observed between the 6% and 9% treatments.
The findings are applicable primarily to the evaluated C-02 soil and to clayey subgrades with comparable geotechnical behavior. Further research should include field-scale validation, wetting–drying cycles, durability assessment, resilient modulus, unconfined compressive strength, microstructural characterization, and long-term monitoring under real traffic and seasonal moisture conditions.
[1] Ministerio de Transportes y Comunicaciones. (2014). Manual de Carreteras: Suelos, Geología, Geotecnia y Pavimentos. Lima, Peru: MTC.
[2] Guzzetti, F., Peruccacci, S., Rossi, M., Stark, C.P. (2008). The rainfall intensity-duration control of shallow landslides and debris flows: An update. Landslides, 5: 3-17. https://doi.org/10.1007/s10346-007-0112-1
[3] Aksakal, E.L., Angin, I., Öztas, T. (2013). Effects of diatomite on soil consistency limits and soil compactibility. Catena, 101: 157-163. https://doi.org/10.1016/j.catena.2012.09.001
[4] Chairullah, B., Sungkar, M., Ritonga, M.G. (2022). The effect of diatomaceous earth addition on CBR values of Glee Geunteng soil in Aceh Besar, Aceh Province, Indonesia. Journal of the Civil Engineering Forum, 9(1): 71-78. https://doi.org/10.22146/jcef.3529
[5] Adeyanju, E., Okeke, C.A., Akinwumi, I., Busari, A. (2020). Subgrade stabilization using rice husk ash-based geopolymer (GRHA) and cement kiln dust (CKD). Case Studies in Construction Materials, 13: e00388. https://doi.org/10.1016/j.cscm.2020.e00388
[6] Singh, P., Dash, H.K., Samantaray, S. (2020). Effect of silica fume on engineering properties of expansive soil. Materials Today: Proceedings, 33(8): 5035-5040. https://doi.org/10.1016/j.matpr.2020.02.839
[7] Ormeño, E., Rivas, N., Duran, G., Soto, M. (2020). Stabilization of a subgrade composed by low plasticity clay with rice husk ash. IOP Conference Series: Materials Science and Engineering, 758(1): 012058. https://doi.org/10.1088/1757-899X/758/1/012058
[8] Hidalgo, F., Saavedra, J., Fernandez, C., Duran, G. (2020). Stabilization of clayey soil for subgrade using rice husk ash (RHA) and sugarcane bagasse ash (SCBA). IOP Conference Series: Materials Science and Engineering, 758(1): 012041. https://doi.org/10.1088/1757-899X/758/1/012041
[9] Vizcarra, S., Lujan, I., Soto, M., Durán, G. (2020). Experimental analysis of the addition of rice husk ash to the clayey subgrade of a road stabilized with lime. IOP Conference Series: Materials Science and Engineering, 758(1): 012090. https://doi.org/10.1088/1757-899X/758/1/012090
[10] Pavlíková, M., Rovnaníková, P., Záleská, M., Pavlík, Z. (2022). Diatomaceous earth—Lightweight pozzolanic admixtures for repair mortars—Complex chemical and physical assessment. Materials, 15(19): 6881. https://doi.org/10.3390/ma15196881
[11] Ramirez Carrión, J.F. (2012). Geological evaluation of diatomites in the Ayacucho Basin and their economic implications. Universidad Nacional de Ingeniería, Lima, Peru. https://cybertesis.uni.edu.pe/bitstream/20.500.14076/1338/1/ramirez_cj.pdf.
[12] Berodier, E., Scrivener, K. (2014). Understanding the filler effect on the nucleation and growth of C-S-H. Journal of the American Ceramic Society, 97(12): 3764-3773. https://doi.org/10.1111/jace.13177
[13] Barman, D., Dash, S.K. (2022). Stabilization of expansive soils using chemical additives: A review. Journal of Rock Mechanics and Geotechnical Engineering, 14(4): 1319-1342. https://doi.org/10.1016/j.jrmge.2022.02.011
[14] Kulanthaivel, P., Krishnaraja, A.R., Muthusamy, S., Mishra, O.P., Sha, M.S., Sadasivuni, K.K. (2024). An experimental analysis of precipitated silica in petroleum-contaminated clay for the strengthening of soil characteristics. Iranian Journal of Science and Technology, Transactions of Civil Engineering, 48: 1573-1579. https://doi.org/10.1007/s40996-023-01242-3
[15] Dao, P.L., Bui, V.D., Onyelowe, K.C., Ebid, A.M., Le, V.D., Ahaneku, I.E. (2022). Effect of metakaolin on the mechanical properties of lateritic soil. Geotechnical Research, 9(4): 211-218. https://doi.org/10.1680/jgere.22.00046
[16] Zaini, M.S.I., Hasan, M., Almuaythir, S., Hyodo, M. (2024). Experimental investigations on physico-mechanical properties of kaolinite clay soil stabilized at optimum silica fume content using clamshell ash and lime. Scientific Reports, 14: 10995. https://doi.org/10.1038/s41598-024-61854-1
[17] Waleed, M., Alshawmar, F. (2025). Enhancing mechanical properties of low plasticity soil through coal and silica fume stabilization. Scientific Reports, 15: 9990. https://doi.org/10.1038/s41598-025-94149-0
[18] Lizarbe-Alarcon, H., Huaccachi-Pumallihua, J., Berrocal-Argumedo, K., et al. (2026). Predicting shear strength parameters of peruvian granular soils using artificial neural networks. Journal of Engineering Management and Systems Engineering, 5(4): 514-527. https://doi.org/10.56578/jemse050404
[19] Tadesse, A.B., Fukubayashi, Y., Koyama, A., Suetsugu, D. (2025). Water retention and swelling characteristics of diatomaceous earth treated expansive soil. International Journal of GEOMATE, 29(133): 1-10. https://doi.org/10.21660/2025.133.4956
[20] ASTM D2487-17. (2025). Standard practice for classification of soils for engineering purposes (unified soil classification system). ASTM International, West Conshohocken, PA, USA. https://doi.org/10.1520/D2487-17R25
[21] American Association of State Highway and Transportation Officials (AASHTO). (1991). Classification of soils and soil-aggregate mixtures for highway construction purposes. M145-91.
[22] ASTM D4318-17e1. (2017). Standard test methods for liquid limit, plastic limit, and plasticity index of soils. ASTM International, West Conshohocken, PA, USA. https://doi.org/10.1520/D4318-17E01
[23] ASTM D1557-12. (2021). Standard test methods for laboratory compaction characteristics of soil using modified effort. ASTM International, West Conshohocken, PA, USA. https://store.astm.org/d1557-12r21.html.
[24] ASTM D1883-21. (2021). Standard test method for California Bearing Ratio (CBR) of laboratory-compacted soils. ASTM International, West Conshohocken, PA, USA. https://store.astm.org/d1883-21.html.
[25] Ministry of Transport and Communications (MTC). (2016). Materials Testing Manual. Ministry of Transport and Communications, Lima, Peru. https://portal.mtc.gob.pe/transportes/caminos/normas_carreteras/MTC%20NORMAS/ARCH_PDF/MAN_5%20%20EM-2016.pdf.
[26] Montgomery, D.C. (2019). Design and Analysis of Experiments, 10th Edition. Hoboken, NJ, USA: John Wiley & Sons.
[27] Jassim, N.W., Hassan, H.A., Mohammed, H.A., Fattah, M.Y. (2022). Enhancement consistency and compaction characteristics of clayey soil using nano silica material. Periodicals of Engineering and Natural Sciences, 10(6): 77-83. https://doi.org/10.21533/pen.v10.i6.910
[28] Millones-Chapoñan, M., Muñoz-Pérez, S.P., Villanueva-Meza, C.D. (2023). Sugarcane bagasse ash as a stabilizing additive in clayey soils for pavement applications: a literature review. Engineering and Competitiveness, 25(1): e30211801. https://doi.org/10.25100/iyc.v25i1.11801
[29] Jaiswal, M., Lal, B. (2016). Impact of rice husk ash on soil stability (including micro level investigation). Indian Journal of Science and Technology, 9(30): 1-7. https://doi.org/10.17485/ijst/2016/v9i30/99189
[30] Cheng, X.Y., Zhang, H.R., Li, W., Zhang, L.Q. (2024). Utilizing diatomaceous earth (DE) as a sustainable substitute in alkali-activated cementitious materials: Performance and life cycle assessment. Construction and Building Materials, 452: 138889. https://doi.org/10.1016/j.conbuildmat.2024.138889
[31] Magalhães, L.J.R., Ferreira, D.M., Ramos-Gavilán, A.B. (2025). Enhancing concrete sustainability with spent diatomaceous earth from the wine industry: Long-term experimental and statistical analysis. Structural Concrete, 26(2): 2277-2295. https://doi.org/10.1002/suco.202400889
[32] Chavez-Ruiz, M., Cosco-Salguero, G.A., Ruffner-Camargo, B. (2025). Thermal and chemical modifications of diatomite from Peru and its application in the adsorption of cadmium. Boletín de la Sociedad Española de Cerámica y Vidrio, 64(4): 100444. https://doi.org/10.1016/j.bsecv.2025.100444
[33] Zaini, M.S.I., Hasan, M., Suwito, A.R., Zolkepli, M.F., Mohamed, N., Talib, Z.A. (2025). Effect of silica fume as industrial byproduct on the stabilization of kaolin clay soil. International Journal of Sustainable Construction Engineering and Technology, 16(2): 349-364. https://doi.org/10.30880/ijscet.2025.16.02.021