Sabhan Hamid Ali* | Ataalah Hussain Jassim | Anas Obeed Balod
© 2026 The authors. This article is published by IIETA and is licensed under the CC BY 4.0 license (http://creativecommons.org/licenses/by/4.0/).
OPEN ACCESS
Pneumatic bulge forming (PBF) uses controlled gas pressure to shape sheet metals into lightweight components with complex geometries under biaxial stretching. In the present work, the deformation and fracture responses of AA1050 aluminum sheets were examined through experimental testing and numerical analysis. Constant-pressure experiments were carried out at 23, 200, 300, and 400 ℃ using gas pressures of 0.7, 0.8, 0.9, and 1.0 MPa. The corresponding finite element (FE) analyses were conducted with Abaqus/Explicit by implementing the Johnson–Cook (JC) constitutive and damage formulations. Formability increased throughout the investigated temperature range, accompanied by an increase in the strain-rate sensitivity from 0.122 at 200 ℃ to 0.178 at 400 ℃. Within the investigated conditions, the maximum experimental dome height was 34.47 ± 0.55 mm at 400 ℃ and 0.8 MPa. Increasing the pressure accelerated deformation up to an intermediate level, whereas excessive pressure promoted localized thinning, damage accumulation, and earlier fracture. The maximum thinning and fracture initiation consistently occurred at the dome apex. Fracture morphology evolved from a linear crack at 200 ℃ to a circular crack at 300 ℃ and then to bursting at 400 ℃ and 1.0 MPa. The mean absolute errors between experimental and numerical predictions were 5.67% for dome height and 7.46% for thinning, indicating overall good agreement.
AA1050, failure, Johnson–Cook model, pneumatic bulge forming, pressure, strain rate, temperature, thinning
Producing lightweight components with complex geometries remains a challenge for conventional sheet metal forming processes. Pneumatic bulge forming (PBF) offers an effective alternative by using a controlled gas pressure to deform a sheet into a die cavity. The process subjects the sheet to a biaxial tensile stress state, making it particularly suitable for investigating formability, thickness reduction, and fracture behavior under well-controlled loading conditions [1, 2].
In warm or hot PBF, increasing the forming temperature reduces the material flow stress, allowing the sheet to deform more easily and thereby improving formability while minimizing forming defects. Unlike conventional punch-based forming, the use of pressurized gas promotes more uniform material flow and die filling. Furthermore, different component geometries can be produced simply by changing the die shape, enabling the manufacture of complex parts in a single forming operation with reduced production cost. The process can be performed under either cold or hot forming conditions and is widely applied to lightweight alloys, particularly aluminum and magnesium alloys [3].
In addition, PBF is well- suited for elevated-temperature applications because the compressed gas can be applied more easily than liquid pressure media at high temperatures, making the process attractive for forming lightweight alloys.
Among the sheet metal forming tests, the bulge test is widely used to investigate the plastic behavior of sheet materials under biaxial tensile loading. Compared with the conventional uniaxial tensile test, it enables higher plastic strains to be achieved and provides a more realistic representation of the sheet deformation under biaxial stress conditions. It can also be used to determine biaxial stress–strain curves, which are essential for characterizing the mechanical behavior of the sheet materials. Consequently, the bulge test provides a more reliable evaluation of the formability, thickness distribution, and failure mechanisms under biaxial loading [4-9].
The deformation behavior during PBF is strongly affected by process parameters, particularly temperature, pressure, and strain rate, which together control the thickness distribution, deformation uniformity, and failure characteristics. Although increasing the forming temperature generally improves the formability of metallic alloys by reducing the material flow stress and enhancing ductility, the response varies with the alloy type and forming process. While some alloys continue to exhibit improved formability with increasing temperature, others reach maximum formability within a certain temperature range, beyond which the formability gradually decreases [10-13].
Gas pressure is another critical process parameter in PBF because it directly influences the deformation rate, strain rate, thickness distribution, thinning, and fracture behavior. Higher forming pressure accelerates deformation and shortens the forming time, but may also increase localized thinning and lead to earlier fracture. In contrast, applying the pressure gradually promotes a more uniform strain distribution and improves formability by delaying the onset of localized necking and fracture [2, 14, 15].
The combined effect of temperature and pressure on formability is strongly influenced by the strain-rate sensitivity of the material. Since different alloys exhibit different strain-rate sensitivities, the reported influence of forming pressure on formability has varied among previous investigations. While many studies have shown that lower strain rates improve formability, others have reported different results. For example, Hong et al. [13] experimentally and numerically investigated the PBF of AA7075-T6 sheets. Their finite element (FE) model accurately predicted the deformation behavior. The results showed that increasing the strain rate at the same temperature increased the dome height and equivalent strain at fracture, indicating improved formability. They also found that specimens formed at 400°C achieved higher dome heights and better formability than those formed at 470 ℃, which was attributed to delayed void growth and fracture. Meanwhile, Sorgente et al. [11] reported that increasing the forming temperature improved the formability of AZ31B alloy by increasing the dome height and reducing the forming time. They also found that increasing the constant pressure improved the dome height up to an optimum value, while further increasing the pressure reduced the final dome height. Likewise, Ramesh Babu et al. [16] showed that increasing the constant pressure during the PBF of AA5086 alloy increased the forming rate and reduced the forming time. Their results also indicated that the optimum pressure depended on the forming temperature. At 450 ℃, a pressure of 0.3 MPa produced a higher dome height than pressures of 0.4 and 0.5 MPa, whereas at 400 ℃, increasing the pressure resulted in a higher dome height. In addition, Parodo et al. [17] found that increasing the forming pressure increased the dome height and thinning at the dome apex during the PBF of AA8006 alloy, while the holding time had only a limited effect on the final dome height at room temperature. These studies indicate that the effect of temperature and pressure on formability depends not only on these parameters but also on the alloy type, forming conditions, and loading path.
Most previous studies on AA1050 aluminum sheets have focused on their mechanical behavior under hot tensile loading. Allazadeh [18] investigated the effects of temperature and strain rate on the deformation behavior and strain-rate sensitivity of AA1050-H14 sheets using hot tensile tests over a temperature range of 100–500 ℃ and strain rates from 0.0001 to 0.005 s⁻¹. They reported that increasing the temperature reduced the flow stress and increased the elongation to fracture. The highest strain-rate sensitivity was obtained at 300 ℃, indicating improved resistance to localized necking and better formability. Naeini et al. [19] also reported that the elongation of AA1050 increased with temperature up to about 190 ℃, after which it gradually decreased at higher temperatures.
In contrast, relatively few studies have investigated the behavior of AA1050 aluminum sheets using bulge-forming tests. Eladeb et al. [20] investigated the effect of temperature on AA1050 aluminum sheets using hydraulic bulge tests and FE simulations over a temperature range of 0–200 ℃. Their results showed that increasing the temperature increased the dome height and equivalent strain, improved the forming limit diagram, and reduced the required forming pressure. They also observed that the fracture location was changed from the dome apex at room temperature to the die edge at elevated temperatures. Although the numerical results showed good agreement with the experimental deformation behavior, the model was unable to predict fracture because no damage criterion was incorporated into the FE model. Similarly, Ghazouani et al. [21] examined the hot formability of AA1050 aluminum sheets using the Erichsen test over a temperature range of 20–300 ℃. They found that increasing the temperature improved formability, delayed the development of ductile damage, and shifted the fracture location from the dome apex to the sheet-holder contact region at temperatures above 150 ℃. In their FE analysis, the potential failure location was identified based on the maximum equivalent plastic strain (PEEQ). However, the numerical model did not simulate or predict the actual fracture because no damage criterion was employed.
Although PBF has been extensively investigated over the past decades, early research mainly focused on the superplastic forming of highly formable materials. More recently, increasing attention has been directed toward conventional aluminum alloys, particularly the 6XXX and 7XXX series, to meet industrial requirements. Previous studies also showed that the effects of temperature and forming pressure depend strongly on the alloy type and forming conditions. Therefore, conclusions obtained for one alloy cannot be directly generalized to another.
Based on the reviewed literature, no previous study has comprehensively investigated the PBF behavior of AA1050 aluminum sheets using both experimental testing and FE analysis over a temperature range from room temperature to 400 ℃. Furthermore, although previous numerical studies successfully described the deformation behavior of AA1050 aluminum sheets, they were unable to accurately predict the actual fracture location because no damage criterion was incorporated into the numerical models.
Therefore, this study experimentally and numerically investigates the PBF behavior of AA1050 aluminum sheets. A validated FE model incorporating the Johnson–Cook (JC) constitutive and damage models is developed to predict the deformation behavior and fracture location. The validated experimental and numerical results demonstrate improvement in the formability of AA1050 aluminum sheets at elevated temperatures up to 400 ℃ and provide a better understanding of their fracture behavior. These findings provide a reliable reference for future numerical model development and support the application of lightweight aluminum components in industrial forming processes.
2.1 Material and sample preparation
Commercial AA1050 aluminum sheets in the annealed condition (O temper) were selected for the present investigation. The material was supplied with a nominal thickness of 1.0 mm and cut into square blanks measuring 165 × 165 mm. No additional thermal or mechanical processing was applied before testing. Measurements performed at different locations on each blank confirmed a uniform initial thickness of 1.00 ± 0.01 mm. At 23 ℃, the tensile response of the sheet was determined using specimens prepared and tested following the procedures specified in ASTM E8/E8M [22]. The alloy composition and the measured tensile parameters subsequently adopted in the numerical model are presented together in Table 1.
Table 1. Chemical composition (wt.%) and room- temperature tensile properties of AA1050 sheet
|
Element |
wt.% |
Mechanical Properties |
|
|
Fe |
0.2 |
Property |
Value |
|
Ti |
0.02 |
E (GPa) |
69 |
|
Mg |
0.055 |
||
|
Cu |
0.015 |
ν |
0.33 |
|
Mn |
0.01 |
YS (MPa) |
32.98 |
|
Si |
0.15 |
UTS (MPa) |
82.22 |
|
Zn |
0.01 |
EL (%) |
36.34 |
|
Al |
Rem. |
|
|
2.2 Pneumatic bulge forming setup
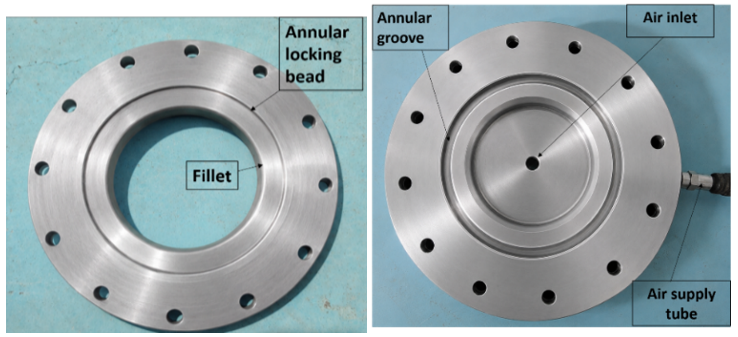
PBF tests were designed to achieve biaxial stretching conditions. A circular steel die with an inner diameter of 100 mm and a fillet radius of 5 mm was used, as shown in Figure 1.
Figure 1. Circular forming die and blank holder
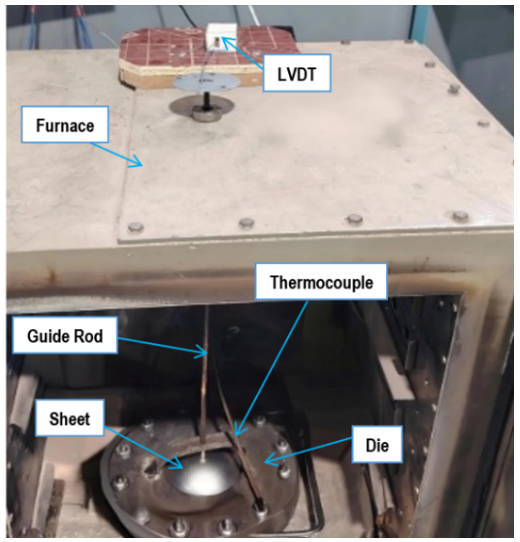
The blank was firmly secured between the die and holder to seal the forming chamber against gas loss. The complete tooling arrangement was then heated inside an electric furnace. The sensor incorporated into the furnace regulated its internal temperature, while the actual blank temperature was independently monitored using a K-type probe placed in direct contact with the sheet. Forming began after the blank reached the prescribed temperature and its reading stabilized. The experimental setup is shown in Figure 2.
Figure 2. Experimental setup inside the furnace
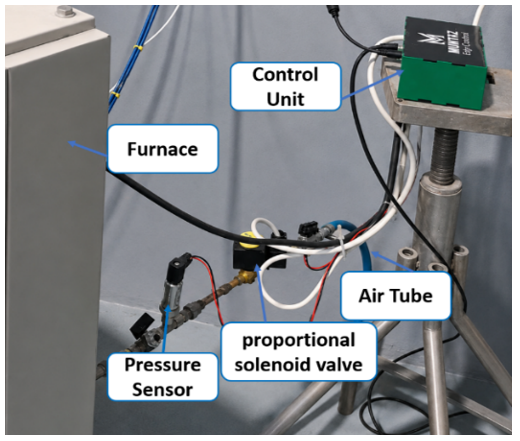
Compressed air supplied the pressure required to deform the sheet. The applied pressure was monitored using a pressure sensor with a manufacturer-specified accuracy of ±0.25% of full scale and regulated by an electronically operated proportional valve. Both devices were integrated with an Arduino-based control unit, while LabVIEW was used to monitor and control the forming process. Further technical specifications of the pressure sensor and proportional valve were provided [23, 24], respectively. The Arduino received and processed the sensor signals, comparing the measured pressure with the preset value, and sending the required control commands to the proportional solenoid valve to maintain the desired forming pressure. LabVIEW was used to set the test conditions, display the pressure–time and dome height–time curves in real time, and automatically record all experimental data.
Figure 3 presents the principal components of the pressure-regulation system developed for the experiments. To protect the pressure transducer and proportional valve from high temperatures, both components were installed outside the furnace and connected to the forming die through a tube.
Figure 3. Pressure control components installed on the air supply tube outside the furnace
The dome height was continuously recorded using a displacement sensor with a specified linearity error lower than ±0.2% of the full-scale output. The sensor was positioned outside the heated zone on the upper surface of the furnace to protect it from the elevated temperatures. Sheet displacement was transmitted to the sensor through a guide rod that remained in contact with the dome throughout the forming process, as shown in Figure 2. Further technical specifications of the displacement-measurement system are available [25].
The control system was also programmed to stop the test automatically and shut off the air supply immediately after sheet failure.
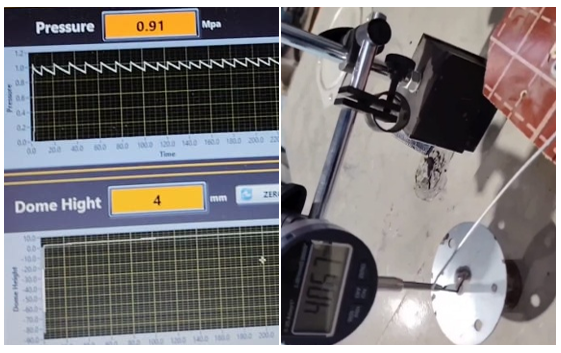
The accuracy of the pressure and dome height measurements was verified using calibrated reference instruments, and good agreement was obtained between the developed measurement system and the calibrated instruments, as presented in Figure 4. Based on the instrument specifications and assuming a rectangular error distribution, the expanded uncertainty of the pressure measurement was estimated as ±0.004 MPa (k = 2), while the expanded uncertainty of the dome height measurement was ±0.116 mm. The expanded uncertainty of the temperature measurement was estimated as ±1.6 ℃. These uncertainty values confirm that the developed measurement system provides sufficient accuracy and reliability for the experimental investigation.
Figure 4. Verification of dome height measurement using a digital dial gauge and comparison with the linear variable differential transformer (LVDT) sensor through the LabVIEW-based data acquisition system
The acquisition system continuously logged the applied pressure, dome displacement, sheet temperature, and elapsed forming time, with each test record exported in spreadsheet format. These records were subsequently processed and used for comparison with the finite-element predictions. Repeatability was examined by conducting three independent tests for every temperature–pressure combination.
The mean response and sample standard deviation (SD) were then obtained from the three measurements using Eq. (1):
$S D=\sqrt{\sum_{i=1}^n\left(x_i-\bar{x}\right)^2 /(n-1)}$ (1)
The SD values ranged from 0.26 to 0.96 mm for dome height and from 0.20 to 0.81 percentage points for thinning.
2.3 Experimental procedure
The furnace was heated to the target temperature, and the die was maintained inside it for 1 hour to ensure thermal stability in the die; then the furnace was opened to fix the specimen.
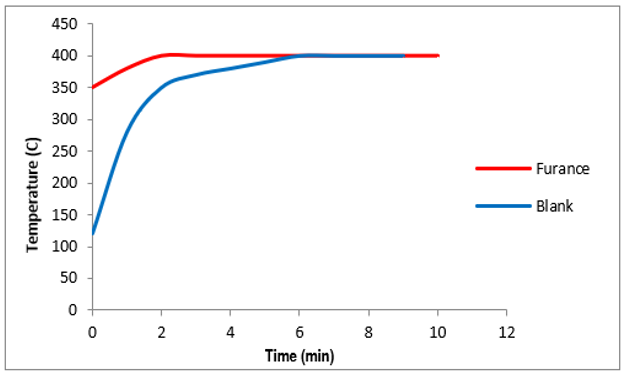
Figure 5 shows the temperature evolution of the furnace, die, and specimen. The recorded heating curves showed that holding the assembled specimen at the prescribed temperature for 10 min was sufficient to stabilize its thermal condition before pressurization.
Figure 5. Furnace and AA1050 blank temperature curves during heating at 400 ℃
Temperature gradients or non-uniform temperature distribution can affect the deformation behavior, as reported in many studies [26, 27]. Therefore, special attention was given in this study to the thermal soak time to ensure stable test conditions and accurate results. After stabilization, the pressure was applied according to a predefined loading path until failure. Tests were conducted under different conditions by varying one parameter (e.g., pressure) while keeping others constant to enable systematic comparison.
2.4 Thickness distribution and thinning analysis
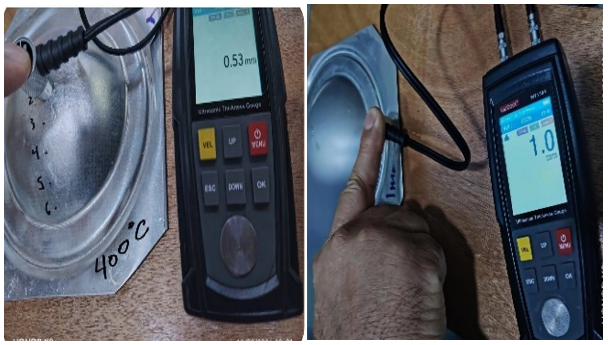
Following each test, a radial thickness profile was constructed from ultrasonic measurements taken at uniformly spaced positions between the dome apex and sheet boundary, as illustrated in Figure 6.
Figure 6. Measurement of thickness distribution along the dome profile using ultrasonic testing at the predefined radial intervals
The calibrated instrument provided a resolution of 0.01 mm and a specified accuracy of ±0.05 mm, while the estimated measurement uncertainty was ±0.01 mm.
The resulting profile was used to quantify local thickness reduction and determine the position of maximum thinning. The percentage thinning was obtained from Eq. (2):
$\operatorname{Thinning}(\%)=\frac{t_0-t_f}{t_0} \times 100$ (2)
where, ($t_0$) represents the sheet thickness before deformation (1.00 mm), whereas ($t_f$) denotes the local thickness measured after specimen failure.
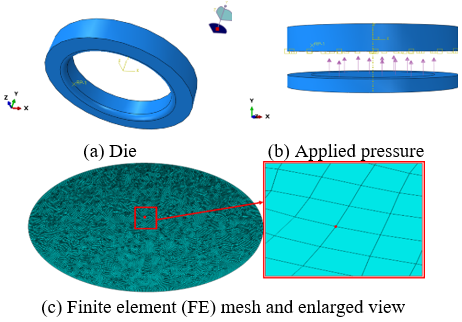
A FE model was developed using Abaqus/Explicit to simulate the PBF process and reproduce the experimental conditions for validation with experimental results. The numerical assembly comprised a deformable blank, while the die was represented as a rigid body, as shown in Figure 7(a).
The material behavior was defined using isotropic and elastic properties defined according to the values in Table 1, whereas the plastic properties were defined with the JC constitutive model. The flow stress in this model is expressed as:
$\sigma=\left(A+B \varepsilon_p^n\right)\left[1+C \ln \left(\frac{\dot{\varepsilon}_p}{\dot{\varepsilon}_0}\right)\right]\left[1-\left(\frac{\left(T-T_0\right)}{\left(T_m-T_0\right)}\right)^m\right]$ (3)
where, $A$ is the initial yield stress, $B$ is the hardening parameter, n is the strain hardening exponent, $C$ is the strain rate sensitivity coefficient, and m is the thermal softening exponent, $\dot{\varepsilon}_p$ is the strain rate which is normalized with a reference strain rate, $\dot{\varepsilon}_0, T_0$, represents the room temperature, and $\mathrm{T}_{\mathrm{m}}$ is the melting temperature of the material [28].
Although numerous previous numerical studies have adopted published JC parameter sets without recalibration [29-34], tensile tests were conducted in the present study to determine the main parameters A, B, and n at the reference condition (23 ℃). Specifically, A was obtained from the 0.2% proof stress, whereas B and n were determined by fitting the room-temperature true stress–plastic strain data.
These experimentally determined values were then compared with the corresponding values reported for AA1050 at room temperature [35]. Owing to the close agreement between these values, the JC parameter set reported in this reference, including the strain-rate, thermal-softening, and damage parameters, was adopted.
In the JC model, a single parameter set is defined at the reference condition, whereas the actual forming temperature for each test condition was assigned separately using a predefined temperature field in Abaqus. Abaqus automatically accounted for the assigned temperature through the thermal-softening and failure terms of the JC model. This procedure is consistent with the commonly adopted approach of using a single internally consistent reference parameter set over different forming temperatures [36-38]. The adopted constitutive and damage constants are summarized in Table 2. The effect of the directional anisotropy was not considered separately in either the experimental tests or the numerical analysis. In the numerical model, the sheet was treated as isotropic because the standard JC formulation implemented in Abaqus employed the von Mises yield criterion and isotropic hardening and could not be combined with Hill’s anisotropic potential [39]. Furthermore, the circular die produced a nearly equibiaxial tensile state at the dome apex. Previous circular bulge-test measurements reported no significant difference between the bulge radii measured along the rolling and transverse directions, indicating a limited influence of directional anisotropy on the overall dome geometry [40].
Table 2. Johnson–Cook (JC) flow and damage coefficients [35]
|
Model Component |
Coefficients |
Assigned Values |
|
Flow behavior |
A(MPa), B(MPa), n, C, m |
32.504, 132.06, 0.435, 0, 1 |
|
Fracture behavior |
$\mathrm{D}_1, \mathrm{D}_2, \mathrm{D}_3, \mathrm{D}_4, \mathrm{D}_5$ |
0.55, -0.05, 0.62, 0, 0.477 |
Fracture initiation and damage evolution during the forming process were simulated using the JC damage model. In this model, the damage parameter is defined as:
$D=\Sigma\left(\frac{\Delta \varepsilon_p}{\varepsilon_f}\right)$ (4)
where, D is the accumulated damage parameter, $\Delta \varepsilon_p$ is the increment of equivalent plastic strain, and $\varepsilon_f$ is the equivalent plastic strain at failure. Within the adopted damage model, the fracture was assumed to initiate when the accumulated damage variable D reached unity. The corresponding element was then deleted from the analysis. The failure strain is expressed as follows:
$\varepsilon_f=\left(D_1+D_2 e^{D_3 \eta}\right)\left(1+D_4 \ln \left(\frac{\dot{\varepsilon}}{\dot{\varepsilon}_0}\right)\right)\left(1+\frac{D_5\left(T-T_0\right)}{T_m-T_0}\right)$ (5)
where, $D_1$ is the Initial failure strain, $D_2$ is the Exponential factor, $D_3$ is the triaxiality factor, $D_4$ is the strain rate factor, $D_5$ is the temperature factor, and $\eta$ is the ratio of the hydrostatic pressure to the effective stress [28].
For each simulation, the pressure corresponding to the experimental condition was uniformly imposed on the lower face of the blank and maintained at the prescribed level, as illustrated in Figure 7(b). Interactions between the blank and forming tools were represented using penalty-enforced surface-to-surface contact, with friction neglected in the tangential direction. The experimental test temperature was assigned uniformly over the entire blank through a predefined thermal field. The sheet was discretized using S4R elements with a mesh size of 0.8 mm, selected on the basis of the mesh-convergence study to provide sufficient numerical accuracy, as shown in Figure 7(c).
Figure 7. Numerical model used in the simulation showing the sheet, die cavity, applied pressure direction, and mesh distribution
4.1 Deformation behavior and strain-rate analysis
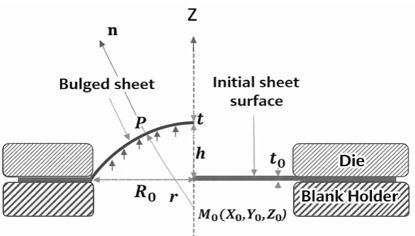
During PBF, biaxial tensile stresses drive the blank into a dome-shaped profile. Stretching and thinning are most pronounced at the apex and progressively diminish toward the clamped perimeter because of the constraints imposed by the die and the blank holder, as illustrated in Figure 8.
Figure 8. Schematic representation of the pneumatic bulge test geometry showing the dome height h, curvature radius r, die radius R₀, and applied pressure
To analyze the deformation at the dome apex, membrane behavior was assumed, as commonly adopted in bulge-forming analyses. Based on the relationship between the dome height and the forming time, the strain rate during PBF was determined from the numerical height–time data using:
$\dot{\varepsilon}=\frac{(2 h \dot{h})}{\left(R_0^2+h^2\right)}$ (6)
where, ε̇ is the strain rate, h is the instantaneous dome height, and ḣ represents the rate of change of the dome height with respect to time, and R₀ is the initial die radius, as illustrated in Figure 8. To further evaluate the effect of strain rate on the deformation behavior, the average strain-rate sensitivity index ($m_s$) was calculated using the pressure–time relationship:
$m_s=\frac{\ln \left(\frac{P_2}{P_1}\right)}{\ln \left(\frac{t_1}{t_2}\right)}$ (7)
where, $P_2$ and $P_1$ are the applied pressure levels, and $t_1$ and $t_2$ are the corresponding forming times required to reach the same dome height. The calculated strain-rate and strain-rate sensitivity values were subsequently used to analyze the effects of temperature and pressure on the deformation behavior and formability of AA1050 aluminum sheets [11, 13, 28, 41, 42].
4.2 Influence of temperature on deformation behavior
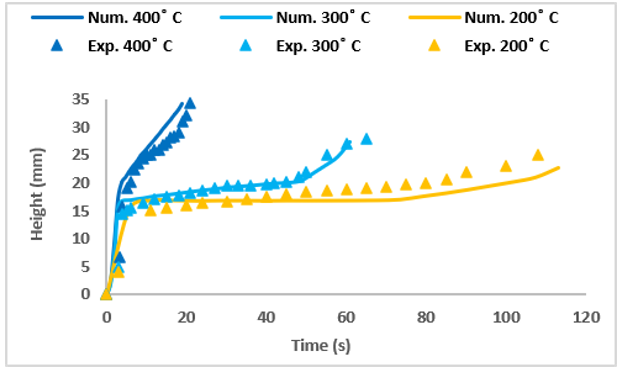
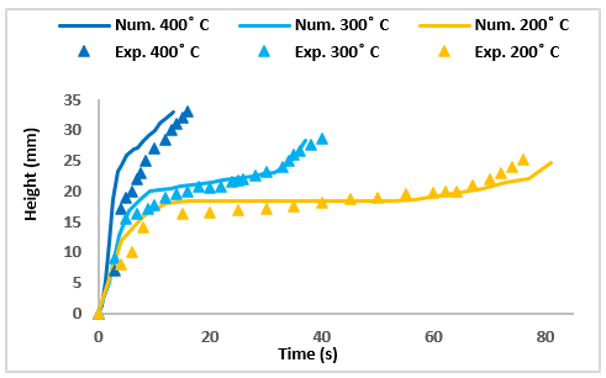
Figures 9 and 10 show how the dome height changed with time at different temperatures. Increasing the temperature from 200 to 300 and then to 400 ℃ significantly accelerated sheet deformation and dome growth. At 400 ℃, the sheet reached the highest dome height before failure and exhibited the shortest failure time, demonstrating that increasing temperature increases the forming rate during PBF.
Figure 9. Effect of temperature on dome height evolution at a constant pressure of 0.8 MPa
Figure 10. Effect of temperature on dome height evolution at a constant pressure of 0.9 MPa
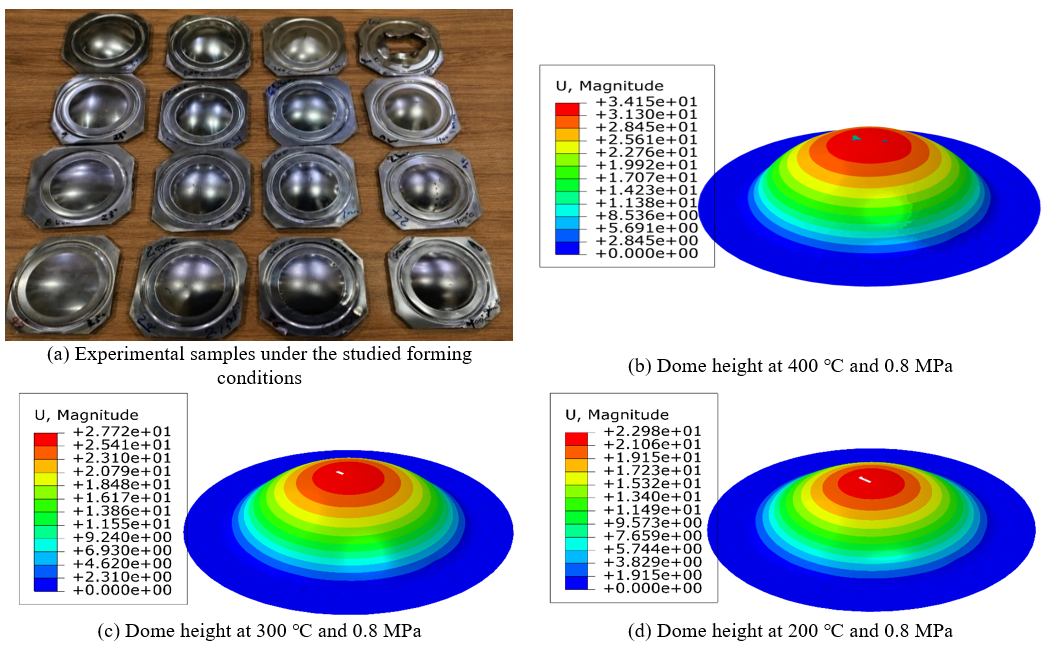
Figure 11 shows the dome height of the specimens, where the highest dome height is clearly observed at 400 °C compared with the other temperatures. This behavior is mainly due to the reduction in flow stress and thermal softening with an increase in material ductility at elevated temperatures, allowing larger plastic deformation under the same pressure.
Figure 11. Experimental samples and simulated dome height
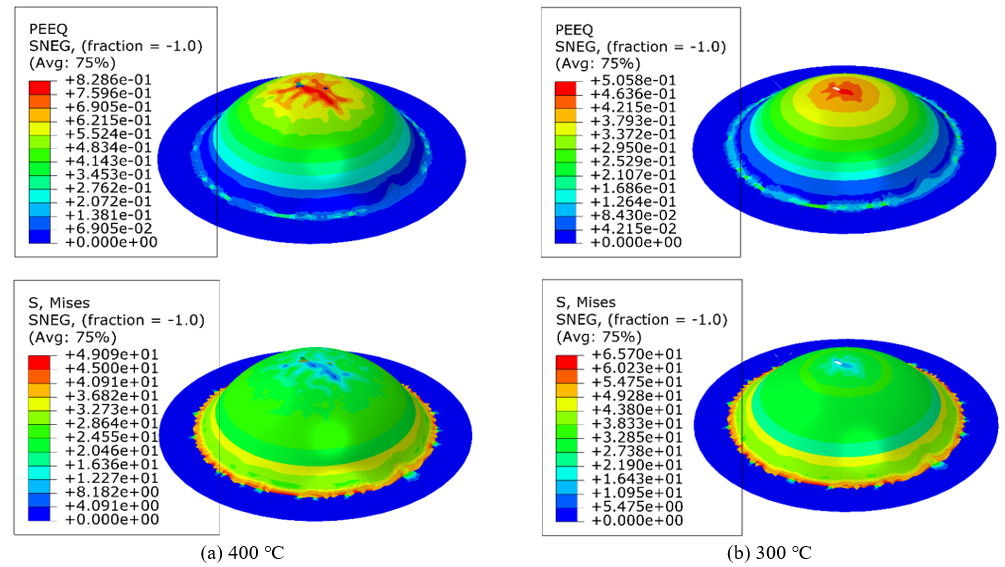
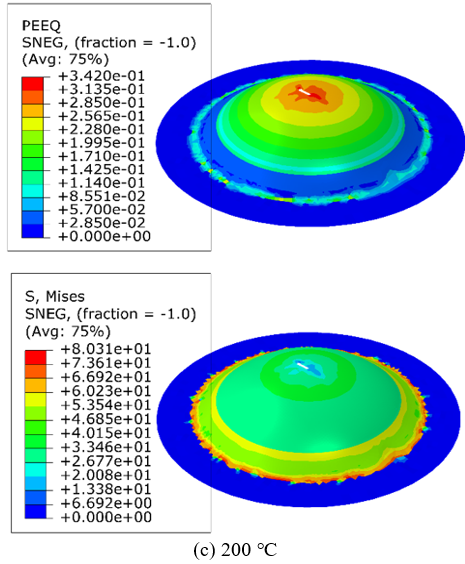
The numerical results in Figure 12 support the experimental observations. Increasing the temperature reduced the equivalent stress (von Mises stress) and increased the PEEQ, indicating lower resistance to plastic deformation and a greater ability to accumulate plastic strain before failure. Consequently, the higher temperatures produced larger dome heights and shorter times to failure. In contrast, decreasing the temperature from 400 to 300 and 200 ℃ reduced the deformation rate and the dome height and increased the time to failure due to the higher flow stress of AA1050 at lower temperatures.
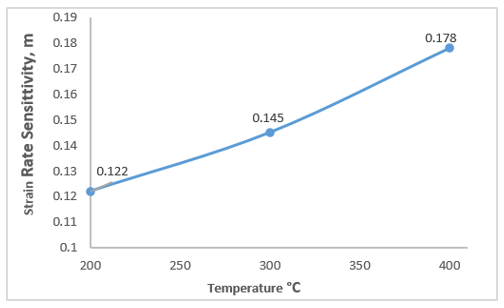
The average strain-rate sensitivity shown in Figure 13 also increased from 0.122 at 200 ℃ to 0.145 at 300 ℃ and 0.178 at 400 ℃. This increase enhances the resistance to strain localization and allows the sheet to sustain greater deformation before failure. Therefore, the improvement in the formability with temperature is attributed to the combined effects of reduced flow stress and increased strain-rate sensitivity.
Figure 13. Variation of the average strain-rate sensitivity ($m_s$) with forming temperature
The continuous increase in the strain-rate sensitivity up to 400 ℃ differs from the hot tensile results of Allazadeh [18], who reported a maximum value at approximately 300 ℃ for AA1050, and Naeini et al. [19], who found that tensile elongation increased up to about 190 ℃ and then decreased. This difference may be related to the deformation mode, since these studies used uniaxial tensile tests, whereas the present study involved biaxial stretching under controlled gas pressure.
Within the investigated temperature ranges, the present results agree with previous forming studies. Eladeb et al. [20] reported improved hydraulic bulge formability from room temperature to 200 ℃, while Ghazouani et al. [21] observed the improved AA1050A formability in the Erichsen test from room temperature to 300 ℃. The present study extends this trend to 400 ℃ under PBF conditions. However, the observed failure behavior differs from that reported in both previous studies and will be discussed in Section 4.5.
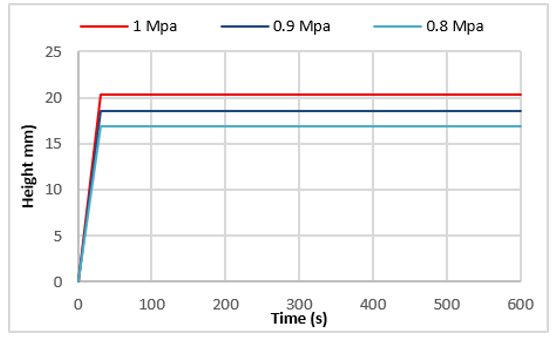
Figure 14 shows the deformation behavior at room temperature, where the dome height increased rapidly during the initial stage of deformation and then gradually stabilized without significant further growth. It should be noted that the analysis time was predefined to be 600 s as the maximum duration of the test, and the experiment continued until this limit without failure occurring. This indicates that the relatively high flow stress at room temperature constrains further deformation after the initial bulging stage and prevents the sheet from reaching the critical thinning.
Figure 14. Evolution of dome height with time at room temperature under pressures of 0.8, 0.9, and 1 MPa
Under these conditions (at room temperature), thermally activated deformation mechanisms that normally assist plastic deformation at elevated temperatures, such as thermal softening and diffusion-assisted dislocation motion, are limited, and therefore the applied pressures remain below the effective resistance of the material.
4.3 Influence of forming pressure on deformation behavior
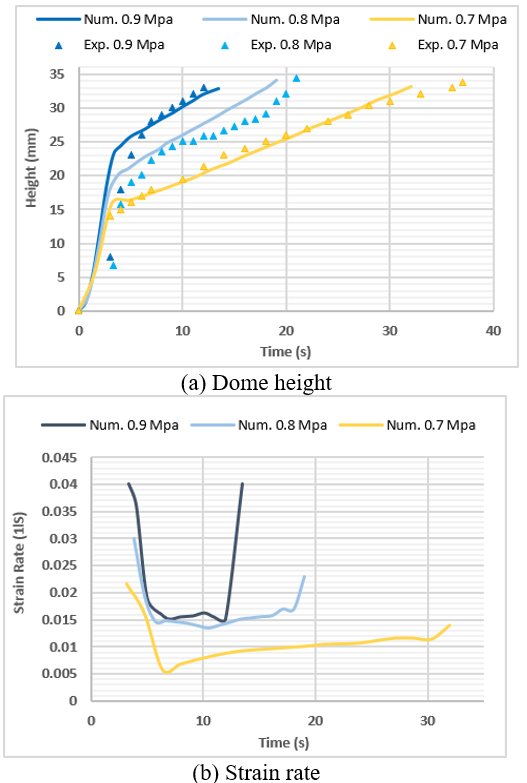
Figure 15 shows the effect of the constant pressure level on the variation in the dome height over time at a temperature of 400 ℃. It can be observed that increasing the pressure level from 0.7 to 0.8 MPa leads to an increase in the dome height due to the acceleration of plastic deformation of the sheet, allowing the material to undergo larger deformation before failure. However, when the pressure level increases to 0.9 MPa, a failure occurs within a shorter time, which limits further development of the dome height due to early failure of the sheet.
Figure 15. Dome height and strain rate vs. time at 400 ℃
The calculated strain rate values at this temperature show that increasing the constant pressure level leads to an increase in the strain rate at the dome apex, which directly controls the deformation behavior. At 0.7 MPa, the strain rate remains relatively low, resulting in a slower deformation, longer time to failure, and thus a lower dome height. At 0.8 MPa, the strain rate reaches a moderate level, and it is more stable, which supports uniform deformation and delays localized thinning, allowing the dome to reach the maximum height before failure. In contrast, at 0.9 MPa, the strain rate increases significantly, particularly in the later stages of deformation, which accelerates the localized thinning and leads to failure within the shortest time, thus reducing the final dome height. It is also observed that at a pressure level of 1 MPa and the same temperature (400 ℃), the evolution of the dome height with time could not be recorded because of the occurrence of rapid tearing of the sheet during the early stage of deformation. This behavior is due to the high membrane stress generated by the elevated pressure, which leads to a substantial increase in the strain rate and rapid localized thinning at the dome apex.
Furthermore, Table 3 presents a comparison of the effects of constant pressure levels of 0.7, 0.8, 0.9, and 1 MPa on the dome height to failure at room temperature and at 200, 300, and 400 ℃. The experimental results are reported as the mean ± SD based on three repeated tests to enhance the reliability and accuracy of the measurements. In addition, the percentage error between the experimental and numerical results is calculated and presented in Table 3. The results indicate that increasing the pressure generally increases the dome height and reduces the time required to reach failure.
However, the effect of pressure on the final dome height is not purely linear because it is observed that increasing the pressure improves the dome height up to a certain limit, beyond which the dome height begins to decrease at higher pressure levels due to accelerated localized thinning. This behavior is directly related to the increase in the strain rate at higher pressure levels, where higher strain rates increase the deformation but lead to the onset of failure.
Overall, the deformation behavior of the dome was governed by the combined effects of the applied pressure and the resulting strain rate. Lower pressures produced slower deformation and lower dome heights, whereas excessive pressure accelerated localized thinning and promoted earlier failure. At 400 ℃, an intermediate pressure of 0.8 MPa provided a suitable balance between deformation and failure, resulting in the maximum dome height. This result is limited to the investigated as-received AA1050 aluminum sheets with a thickness of 1.0 mm, the present circular die geometry, and the studied pressure range of 0.7–1.0 MPa.
As summarized in Table 3, the mean absolute error between the experimental and numerical dome heights was 5.67%. The minimum error was 0.33% at 200°C and 0.8 MPa, whereas the maximum error was 31.63% at 23°C and 0.7 MPa. The larger room-temperature errors may be attributed to the limited deformation and the absence of failure; therefore, the results were compared at the maximum test duration of 600 s rather than at failure. At elevated temperatures, the mean error was approximately 1.21%, indicating a good experimental–numerical agreement.
Table 3. Comparison of experimental (mean ± standard deviation (SD), n = 3) and numerical dome height at the apex, including the corresponding experimental–numerical error
|
T (℃) |
P. (MPa) |
D. H. (mm) Exp. Mean ± SD |
D. H (mm) Num. |
Error (%) |
|
23 |
0.7 |
8.60 ± 0.46 |
11.32 |
31.63% |
|
23 |
0.8 |
14.00 ± 0.53 |
16.89 |
20.64% |
|
23 |
0.9 |
16.20 ± 0.66 |
18.61 |
14.88% |
|
23 |
1 |
19.40 ± 0.79 |
20.3 |
4.64% |
|
200 |
0.7 |
24.20 ± 0.40 |
24.31 |
0.45% |
|
200 |
0.8 |
24.50 ± 0.82 |
24.42 |
0.33% |
|
200 |
0.9 |
25.10 ± 0.72 |
24.62 |
1.91% |
|
200 |
1 |
25.50 ± 0.26 |
24.8 |
2.75% |
|
300 |
0.7 |
27.23 ± 0.47 |
27.5 |
0.99% |
|
300 |
0.8 |
28.00 ± 0.62 |
27.7 |
1.07% |
|
300 |
0.9 |
28.6 ± 0.55 |
28.1 |
1.75% |
|
300 |
1 |
29.33 ± 0.31 |
29.53 |
0.68% |
|
400 |
0.7 |
33.83 ± 0.96 |
33.19 |
1.89% |
|
400 |
0.8 |
34.47 ± 0.55 |
34.16 |
0.90% |
|
400 |
0.9 |
33.07 ± 0.40 |
32.88 |
0.57% |
4.4 Effect of temperature and pressure on thinning behavior and failure mechanism
As shown in Figures 9 and 10, increasing the temperature to 400 ℃ leads to a significant increase in dome height, indicating a clear improvement in formability at elevated temperatures. This behavior is associated with the reduction in flow stress and the increase in material ductility, enabling the sheet to undergo greater plastic deformation before rupture.
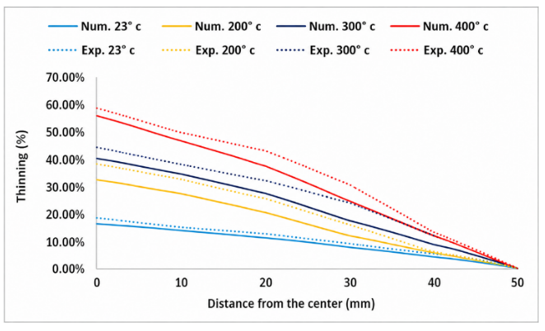
In parallel, Figure 16, which illustrates the thinning distribution at a constant pressure of 0.8 MPa, shows that increasing the temperature also leads to greater thinning, particularly at the dome apex, as a result of the increased deformation associated with the higher dome height. This indicates a direct relationship between the dome height and thinning, where improved formability at higher temperatures enables greater deformation, which is reflected in higher thinning values.
Figure 16. Effect of temperature on thinning distribution at a constant pressure of 0.8 MPa
Furthermore, this behavior is not limited to a specific pressure level, but is observed across different constant pressure levels, as summarized in Table 4, where it can be observed that the thinning increases with temperature under the same pressure condition. This indicates that temperature has a more pronounced effect on deformation behavior than pressure within the investigated range.
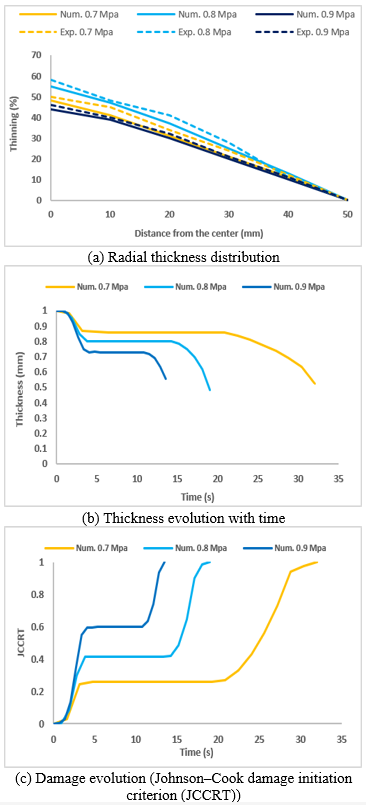
As summarized in Table 4, the mean absolute error between the experimental and numerical thinning values was 7.46%. The minimum error was 0.00% at 200 ℃ and 0.7 MPa, whereas the maximum error of 24.14% occurred at 23 ℃ and 0.9 MPa. Similar to the dome-height results, the relatively larger errors at room temperature can be attributed to the non-failure behavior discussed previously. At elevated temperatures, the mean error was approximately 4.58%, indicating a good agreement between the experimental and numerical results. On the other hand, Figure 15 shows that the maximum dome height was achieved at a pressure of 0.8 MPa and a temperature of 400 ℃, whereas the dome height at 0.9 MPa was lower because failure occurred earlier. In addition, Figure 17(a) indicates that the maximum thinning was obtained at 0.8 MPa, while the thinning at 0.9 MPa was lower, which may initially appear contradictory when considering the effect of pressure alone. To explain this behavior, Figure 17(b) presents the thickness evolution with time, showing that the pressure at 0.9 MPa exhibits a faster reduction in thickness but reaches failure at a shorter time compared to the 0.8 MPa case. As a result, the deformation process at the higher pressure does not continue long enough to reach the same level of final thinning achieved at 0.8 MPa. This analysis is further supported by Figure 17(c), where the damage criterion based on the Johnson–Cook damage initiation criterion (JCCRT) reaches higher values and obtains the critical failure value (JCCRT = 1) earlier at 0.9 MPa compared to the 0.8 MPa case. This indicates a faster accumulation of damage at higher pressure, and it can be concluded that the failure is controlled not only by the final thinning value but also by the rate of thinning and damage evolution with time. Based on these results, 0.8 MPa provided the most favorable balance among the investigated pressure levels at 400 ℃, allowing the sheet to achieve the maximum dome height and thinning before failure. In contrast, increasing the pressure to 0.9 MPa accelerated localized thinning and damage accumulation, resulting in earlier failure and a lower final dome height.
Table 4. Comparison of experimental (mean ± standard deviation (SD), n = 3) and numerical percentage thinning at the apex with the corresponding experimental–numerical error
|
T (℃) |
P. (MPa) |
Thinn. (%) Exp. Mean ± SD |
Thinn. (%) Num. |
Error (%) |
|
23 |
0.7 |
8.50 ± 0.72 |
10% |
17.65% |
|
23 |
0.8 |
17.07 ± 0.81 |
15% |
12.13% |
|
23 |
0.9 |
14.50 ± 0.66 |
18% |
24.14% |
|
23 |
1 |
26.03 ± 0.21 |
28% |
7.57% |
|
200 |
0.7 |
30.00 ± 0.40 |
30% |
0.00% |
|
200 |
0.8 |
36.07 ± 0.40 |
30% |
16.83% |
|
200 |
0.9 |
33.17 ± 0.32 |
32.20% |
2.92% |
|
200 |
1 |
34.03 ± 0.50 |
32.70% |
3.91% |
|
300 |
0.7 |
36.00 ± 0.20 |
37% |
2.78% |
|
300 |
0.8 |
42.00 ± 0.50 |
38% |
9.52% |
|
300 |
0.9 |
38.00 ± 0.80 |
38.20% |
0.53% |
|
300 |
1 |
42.83 ± 0.51 |
42.90% |
0.16% |
|
400 |
0.7 |
50.07 ± 0.35 |
48% |
4.13% |
|
400 |
0.8 |
58.07 ± 0.21 |
55% |
5.29% |
|
400 |
0.9 |
46.00 ± 0.50 |
44% |
4.35% |
Figure 17. Effect of pressure on thinning distribution, thickness evolution, and damage development during pneumatic bulge forming (PBF)
4.5 Effect of temperature and pressure on fracture behavior
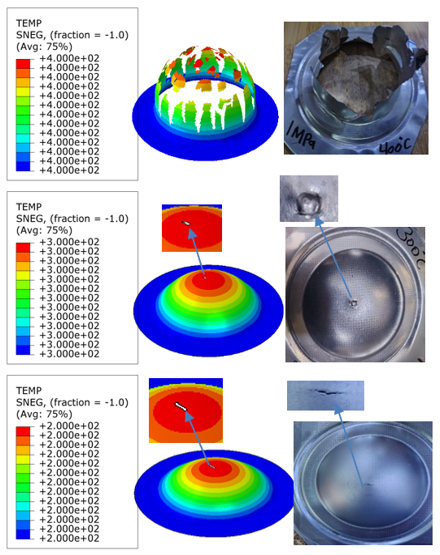
Figure 18 shows the failure behavior at a constant pressure of 1 MPa under different temperatures (200, 300, and 400 ℃), illustrating the effect of temperature on the fracture morphology and fracture location. At 400 ℃, bursting failure occurred at the dome apex due to the significant increase in material ductility, accompanied by severe localized thinning. At 300 ℃, the fracture appeared as a small circular crack at the dome apex, indicating localized crack initiation with less severe thinning while maintaining the deformation capability of the sheet. However, at 200 ℃, the fracture appeared as a linear crack, reflecting lower formability compared with the higher temperatures. As indicated by the PEEQ contours in Figure 12 and the thinning results in Section 4.4, the maximum thinning was consistently observed at the dome apex under all investigated temperatures, which explains why fracture always initiated at this location.
Figure 18. Temperature effect (200–400 ℃) on fracture location at the dome apex at 1 MPa: Experimental and numerical comparison
Although the fracture morphology changed with increasing temperature, the fracture location remained at the dome apex throughout all the experimental and numerical results presented in the previous figures, as well as in Figures 18 and 19, and did not shift toward the die edge or the sheet-holder contact region. This behavior differs from that reported by Eladeb et al. [20], who investigated AA1050 aluminum sheets using the hydraulic bulge forming process over a temperature range from room temperature to 200 ℃, where the fracture location shifted from the dome apex to the die edge as the temperature increased. A similar trend was reported by Ghazouani et al. [21], who investigated the hot formability of AA1050A sheets using the hot Erichsen test over a temperature range of 20–300 ℃, where the fracture location moved from the dome apex to the sheet-holder contact region with increasing temperature. A notable contribution of the present study is that the numerical model successfully predicted the fracture location with high accuracy and showed excellent agreement with the experimental observations. Unlike the previous studies, which identified the potential failure region mainly from strain distributions or deformation indicators without employing an explicit failure criterion capable of directly predicting the fracture location and comparing it with the experimental results, the present study achieved direct experimental–numerical agreement in predicting the fracture location. Furthermore, the different fracture behavior observed in the present study can be explained by the use of the PBF process, which provides a more uniform pressure distribution over the sheet surface and different loading and contact conditions compared with hydraulic bulge forming and the hot Erichsen test. As a result, the fracture consistently remained at the dome apex throughout the investigated temperature range.
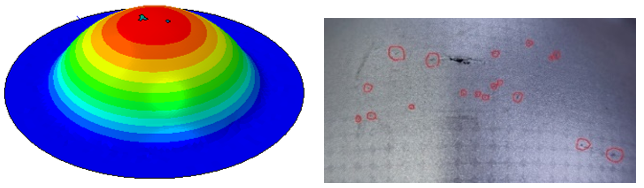
Figure 19 shows the failure behavior at 400 ℃ and 0.8 MPa, where stable and gradual thinning occurs at the dome apex, allowing a higher dome height before failure. Visual observations on the specimen surface highlight multiple localized thinning regions near failure at the apex, indicating continuous evolution of damage before its final localization into a single fracture site. But at 0.9 MPa, thinning becomes more rapid and localized, accompanied by the early appearance of multiple surface damage regions, leading to accelerated damage accumulation and earlier failure with reduced dome height.
Figure 19. Failure behavior at 400 ℃ and 0.8 MPa, showing localized thinning near the dome apex
Increasing the forming temperature significantly improved the biaxial formability of AA1050 aluminum sheets during PBF. Within the investigated temperature range, formability continued to increase up to 400 ℃, as indicated by the increased dome height and PEEQ and the reduced equivalent stress. This behavior differs from some uniaxial tensile-test studies that reported reduced formability of AA1050 aluminum sheets at elevated temperatures.
The AA1050 alloy exhibited increasing strain-rate sensitivity with increasing temperature up to 400 ℃, which enhanced its ability to accommodate larger plastic deformation and contributed to the continuous improvement in formability.
Increasing the constant pressure level enhanced the formability by increasing the deformation rate and dome height up to a certain pressure level. Further increases in the constant pressure level accelerated damage accumulation and fracture initiation, thereby limiting additional deformation and dome growth. Within the investigated conditions, the combination of 400 ℃ and 0.8 MPa produced the maximum dome height. This finding is specifically limited to the as-received AA1050 aluminum sheets with a thickness of 1.0 mm, the present circular die geometry, and the investigated temperature range of 23–400 ℃ and pressure range of 0.7–1.0 MPa.
The maximum thinning and PEEQ were consistently concentrated at the dome apex, whereas the von Mises stress at the failure location was lower than in the surrounding regions, indicating that fracture was governed primarily by strain localization rather than maximum stress concentration.
The fracture location remained at the dome apex throughout the investigated temperature range (200–400 ℃) and did not shift toward the die edge or sheet-holder contact region with increasing temperature, unlike observations reported in some previous studies on AA1050.
The fracture morphology evolved with increasing temperature, changing from a linear crack at 200 ℃ to a circular crack at 300 ℃. Under the combined effect of high temperature and high constant pressure, bursting failure occurred at the dome apex, as observed at 400 ℃ under a constant pressure of 1 MPa.
Very good agreement was obtained between the experimental and numerical results for the dome height, thinning distribution, fracture location, and fracture morphology. The numerical model successfully predicted the experimentally observed fracture location, confirming its capability to accurately simulate the response of AA1050 sheets to deformation and rupture under PBF.
The authors gratefully acknowledge Northern Technical University for its institutional support. The Department of Mechanical Engineering at Mosul Polytechnic College provided the experimental facilities and laboratory assistance, while the University’s Computer Center supplied the computational resources required for the numerical simulations.
|
A |
initial yield stress, MPa |
|
B |
hardening constant, MPa |
|
C |
strain-rate sensitivity coefficient, dimensionless |
|
D |
damage parameter, dimensionless |
|
D1–D5 |
Johnson–Cook damage constants, dimensionless |
|
E |
Young's modulus, GPa |
|
h |
height, mm |
|
m |
thermal softening exponent, dimensionless |
|
$m_s$ |
strain-rate sensitivity index, dimensionless |
|
n |
strain hardening exponent, dimensionless |
|
P |
applied gas pressure, MPa |
|
t |
forming time, s |
|
t₀ |
initial sheet thickness, mm |
|
$t_f$ |
final sheet thickness, mm |
|
T |
forming temperature, ℃ |
|
$\mathrm{T}_0$ |
reference temperature, ℃ |
|
Tₘ |
melting temperature, ℃ |
|
Greek symbols |
|
|
$\dot{\varepsilon}_{\mathrm{p}}$ |
equivalent plastic strain rate, s⁻¹ |
|
ν |
poisson's ratio |
|
σ |
equivalent flow stress, MPa |
|
η |
stress triaxiality |
|
Abbreviations |
|
|
DH |
dome height |
|
EL |
elongation at fracture, % |
|
EXP |
experimental |
|
FE |
finite element |
|
JC |
Johnson–Cook |
|
JCCRT |
Johnson–Cook damage initiation criterion |
|
NUM |
numerical |
|
PBF |
pneumatic bulge forming |
|
PEEQ |
equivalent plastic strain |
|
SD |
standard deviation |
|
Thinn |
thinning |
|
UTS |
ultimate tensile strength |
|
YS |
0.2% proof (yield) strength |
|
Subscripts |
|
|
0 |
initial or reference value |
|
f |
final or failure |
|
m |
melting |
|
p |
plastic |
|
s |
strain-rate sensitivity |
[1] Cui, X.H., Yang, G., Yan, Z.Q., Chen, X., Wang, H.P., Huang, C.Q. (2024). Enhanced forming height and accuracy of thin-walled aluminum alloy by impact pneumatic forming. Journal of Materials Processing Technology, 330: 118456. https://doi.org/10.1016/j.jmatprotec.2024.118456
[2] Yi, L.L., Gu, Z.W., Li, Y., Sun, G.Q. (2026). A study on superplastic gas bulging forming process of industrial 5083 aluminum alloy. Materials Today Communications, 50: 114361. https://doi.org/10.1016/j.mtcomm.2025.114361
[3] Li, B.Y., Hu, Z.Q., Xie, Y.K., Wang, Y.X. (2025). Investigation on deformation behavior and microstructure of AZ31B alloy within hot gas bulging with clustering balls. Journal of Alloys and Compounds, 1031: 180980. https://doi.org/10.1016/j.jallcom.2025.180980
[4] Campos, H., Santos, A.D., Martins, B., Ito, K., Mori, N., Barlat, F. (2014). Hydraulic bulge test for stress-strain curve determination and damage calibration for Ito-Goya model. In 11th World Congress on Computational Mechanics (WCCM XI), 5th European Conference on Computational Mechanics (ECCM V), and 6th European Conference on Computational Fluid Dynamics (ECFD VI), Barcelona, Spain, pp. 4223-4238. https://congress.cimne.com/iacm-eccomas2014/admin/files/fileabstract/a2301.pdf.
[5] Wang, H.K., Xu, T., Shou, B. (2017). Determination of material strengths by hydraulic bulge test. Materials, 10(1): 23. https://doi.org/10.3390/ma10010023
[6] Paral, S.K., Mandal, A. (2023). An experimental study on bulge test of commercially pure aluminium sheet metal. Journal of The Institution of Engineers (India): Series D, 104: 37-43. https://doi.org/10.1007/s40033-022-00386-2
[7] Shi, J., Guo, Z.J., Wang, J.X., et al. (2024). A novel small specimen testing method based on a pneumatic bulging test: Measurement of tensile properties at high temperatures. International Journal of Pressure Vessels and Piping, 209: 105210. https://doi.org/10.1016/j.ijpvp.2024.105210
[8] Bao, J., Ding, H.R., Zuo, Z.Q., Peng, J. (2024). Exploring mechanical properties using the hydraulic bulge test and uniaxial tensile test with micro-samples for metals. Metals, 14(8): 917. https://doi.org/10.3390/met14080917
[9] Lazarescu, L., Nicodim, I.P., Comsa, D.S., Banabic, D. (2012). A procedure for the evaluation of flow stress of sheet metal by hydraulic bulge test using elliptical dies. Key Engineering Materials, 504-506: 107-112. https://doi.org/10.4028/www.scientific.net/KEM.504-506.107
[10] Mitukiewicz, G., Anantheshwara, K., Zhou, G., Mishra, R.K., Jain, M.K. (2014). A new method of determining forming limit diagram for sheet materials by gas blow forming. Journal of Materials Processing Technology, 214(12): 2960-2970. https://doi.org/10.1016/j.jmatprotec.2014.06.020
[11] Sorgente, D., Palumbo, G., Scintilla, L.D., Tricarico, L. (2016). Gas forming of an AZ31 magnesium alloy at elevated strain rates. International Journal of Advanced Manufacturing Technology, 83: 861-872. https://doi.org/10.1007/s00170-015-7614-0
[12] Zhang, F.F., He, K., Li, Z., Huang, B. (2022). Strain-rate effect on anisotropic deformation characterization and material modeling of high-strength aluminum alloy sheet. Metals, 12(9): 1430. https://doi.org/10.3390/met12091430
[13] Hong, J.H., Yoo, D., Kwon, Y.N., Kim, D. (2023). Evaluation of rate-dependent forming limit for AA7075 sheets under pneumatic stretching method at elevated temperatures. Journal of Materials Research and Technology, 22: 1839-1854. https://doi.org/10.1016/j.jmrt.2022.11.151
[14] Cai, G.S., Zhou, X.J., Lang, L.H., Alexandrov, S. (2016). Research on aluminum alloy sheet thermoplastic deformation behavior based upon warm bulging test. AIP Advances, 6: 025319. https://doi.org/10.1063/1.4942817
[15] Jayaseelan, V., Vijayananth, S., Xavier, J.F., Daniel, S.A.A., Kumar, N.M., Jiang, X.X. (2019). Experimental investigation on bi-axial superplastic forming characteristics of AA6063/SiCp with various percentages of SiCp under various temperatures and pressures. Results in Physics, 15: 102624. https://doi.org/10.1016/j.rinp.2019.102624
[16] Babu, S.R., Deivanayagam, S., Aravind, M. (2014). Determination of material parameters during superplastic forming of AA5086 alloy. Procedia Engineering, 97: 1379-1386. https://doi.org/10.1016/j.proeng.2014.12.419
[17] Parodo, G., Giuliano, G., Sorrentino, L., Polini, W. (2023). Mechanical characterization of AA8006 aluminum alloy through cold free forming test. Metals, 13(6): 1081. https://doi.org/10.3390/met13061081
[18] Allazadeh, M.R. (2020). Computing strain rate sensitivity of aluminium alloy 1050. International Scientific Survey Journal, 3(2): 9-27. https://pureportal.strath.ac.uk/en/publications/computing-strain-rate-sensitivity-of-aluminium-alloy-1050.
[19] Naeini, H.M., Liaghat, G.H., Hashemi Ghiri, S.J., Seyedkashi, S.M.H. (2011). FE simulation and experimental study of tube hydroforming process for AA1050 alloy at various temperatures. Advanced Materials Research, 264-265: 96-101. https://doi.org/10.4028/www.scientific.net/AMR.264-265.96
[20] Eladeb, A., Nasri, M.T., Becheikh, N., Ghazouani, N., Tashkandi, M.A. (2024). Study on the thermal sensitivity of anisotropic thin sheets: Application to hot bulge tests. Mechanika, 30(2): 110-122. https://doi.org/10.5755/j02.mech.34214
[21] Ghazouani, N., Eladeb, B., Tashkandi, M.A., Nasri, M.T. (2021). Formability of aluminum 1050A at high temperatures: Numerical modeling and experimental validation. Latin American Journal of Solids and Structures, 18(05): e385. https://doi.org/10.1590/1679-78256523
[22] ASTM International. (2013). Standard test methods for tension testing of metallic materials (ASTM E8/E8M-13a). West Conshohocken, PA, USA. https://doi.org/10.1520/E0008_E0008M-13A
[23] Omega Engineering. Stainless steel pressure transducers - PX309 series. https://www.dwyeromega.com/en-us/general-purpose-stainless-steel-pressure-transducers/p/PX309, accessed on Feb. 15, 2026.
[24] Tameson. Proportional solenoid valves. https://tameson.com/collections/proportional-solenoid-valves, accessed on Feb. 15, 2026.
[25] Omega Engineering. AC and DC LVDT sensors. https://www.omega.co.uk/subsection/dc-lvdt-sensors.html, accessed on Feb. 15, 2026.
[26] Ananth, S.V., Srimurugan, R., Jayaseelan, V., Geethan, A., Xavier, J.F. (2020). Experimental investigation on superplastic forming behavior of AA6063/SiCp using stir casting. AIP Conference Proceedings, 2283: 020118. https://doi.org/10.1063/5.0025150
[27] Abu-Farha, F., Hector, L.G. (2011). Sheet orientation effects on the hot formability limits of lightweight alloys. Journal of Manufacturing Science and Engineering, 133(6): 061005. https://doi.org/10.1115/1.4004850
[28] Jebri, L., Lazghab, T., Toumi, M., Soula, M. (2022). The behavior and forming performance of vapor hydroforming process of thin aluminum sheets: Numerical and experimental analysis. Advances in Mechanical Engineering, 14(4): 16878132221089380. https://doi.org/10.1177/16878132221089380
[29] Rajhi, W. (2019). Numerical simulation of damage on warm deep drawing of Al 6061-T6 aluminium alloy. Engineering, Technology & Applied Science Research, 9(5): 4830-4834. https://doi.org/10.48084/etasr.3148
[30] Mane, T., Goel, V., Kore, S.D. (2014). Finite element modelling of electro-hydraulic forming of sheets. Procedia Materials Science, 6: 105-114. https://doi.org/10.1016/j.mspro.2014.07.012
[31] Demirkol, R.H., Darendeliler, H. (2022). Effects of temperature on deep drawing of an aluminum alloy for different yield criteria and hardening models. Key Engineering Materials, 926: 784-801. https://doi.org/10.4028/p-s91nhk
[32] Muiruri, A., Maringa, M., du Preez, W. (2022). Numerical simulation of high strain rate and temperature properties of laser powder bed fusion Ti6Al4V (ELI) determined using a split Hopkinson pressure bar. Materials, 15(5): 1872. https://doi.org/10.3390/ma15051872
[33] Bendarma, A., El Garouge, S., Akhzouz, H., Kardellass, S., Bouslikhane, S., El Minor, H. (2021). The behaviour of aluminum alloy 1050 sheet subjected to impact and perforation process: Experimental and numerical approaches. MATEC Web of Conferences, 348: 01010. https://doi.org/10.1051/matecconf/202134801010
[34] Patil, S.P., Prajapati, K.G., Jenkouk, V., Olivier, H., Markert, B. (2017). Experimental and numerical studies of sheet metal forming with damage using gas detonation process. Metals, 7(12): 556. https://doi.org/10.3390/met7120556
[35] Nasri, M.T., Abbassi, F., Ahmad, F., et al. (2023). Experimental and numerical investigation of sheet metal failure based on Johnson-Cook model and Erichsen test over a wide range of temperatures. Mechanics of Advanced Materials and Structures, 30(10): 2087-2100. https://doi.org/10.1080/15376494.2022.2049934
[36] Wuertemberger, L., Palazotto, A.N. (2016). Evaluation of flow and failure properties of treated 4130 steel. Journal of Dynamic Behavior of Materials, 2: 207-222. https://doi.org/10.1007/s40870-016-0059-1
[37] Yang, D., Li, M.Y. (2025). Effect of relative density on dynamic mechanical behavior and deformation mechanisms of porous titanium under coupled high-temperature and high-strain-rate conditions. Science and Technology of Advanced Materials, 26(1): 2580925. https://doi.org/10.1080/14686996.2025.2580925
[38] Ali, S.H., Balod, A.O., Jassim, A.H. (2026). Deformation behavior and failure conditions in pneumatic bulge forming using circular and elliptical dies. FME Transactions, 54(3): 537-548. https://doi.org/10.5937/fme2603537H
[39] Dassault Systèmes. (2025). Classical metal plasticity. Abaqus Documentation. https://docs.software.vt.edu/abaqusv2025/English/SIMACAEMATRefMap/simamat-c-metalplastic.htm, accessed on Sep. 8, 2026.
[40] Koç, M., Billur, E., Cora, Ö.N. (2011). An experimental study on the comparative assessment of hydraulic bulge test analysis methods. Materials & Design, 32(1): 272-281. https://doi.org/10.1016/j.matdes.2010.05.057
[41] Yoo, J.T., Yoon, J.H., Lee, H.S., Youn, S.K. (2012). Material characterization of Inconel 718 from free bulging test at high temperature. Journal of Mechanical Science and Technology, 26: 2101-2105. https://doi.org/10.1007/s12206-012-0523-3
[42] Sorgente, D., Scintilla, L.D., Palumbo, G., Tricarico, L. (2010). Blow forming of AZ31 magnesium alloy at elevated temperatures. International Journal of Material Forming, 3: 13-19. https://doi.org/10.1007/s12289-009-0411-2