Ali Bardadi*![]() | Budi Warsito
| Budi Warsito![]() | Bayu Surarso
| Bayu Surarso![]() | Wibowo Harry Sugiharto
| Wibowo Harry Sugiharto![]()
© 2025 The authors. This article is published by IIETA and is licensed under the CC BY 4.0 license (http://creativecommons.org/licenses/by/4.0/).
OPEN ACCESS
Fuzzy Time Series (FTS) models are effective for handling uncertain and vague datasets, but their performance is often limited by subjective partitioning and ambiguous state transitions. Objectives: This study aims to address partitioning uncertainty caused by empirical fuzzifier parameters in Fuzzy C-Means (FCM) and resolve the one-to-many transition ambiguity in Fuzzy Logical Relationship Groups (FLRGs). We propose a novel hybrid model, IT2FCM-MC-FTS, which integrates Interval Type-2 Fuzzy C-Means (IT2FCM) with a first-order Markov Chain (MC). The methodology involves using IT2FCM to generate robust, data-driven interval partitions that account for noise, followed by the application of MC transition probabilities to provide logical weights for resolving complex relationship groups. The model was validated using ambient CO concentration data from Semarang, Indonesia. Experimental results show that the proposed model achieved an RMSE of 887.47 and a SMAPE of 17.86%, significantly outperforming traditional FTS, FCM-FTS, and FTS-MC models. By synergizing robust clustering with probabilistic inference, the IT2FCM-MC-FTS model provides a more reliable and accurate framework for time series forecasting (TSF) in volatile environments.
Fuzzy Time Series, Interval Type-2 Fuzzy C-Means, Markov Chain, forecasting, hybrid model, time series analysis
Time series forecasting (TSF) is a critical tool for decision-making across diverse fields, including energy production [1-4], environmental monitoring [5, 6], and financial analysis [7-9]. While traditional statistical models have been used extensively, they often struggle with the inherent uncertainty and linguistic vagueness of real-world data [10, 11]. The Fuzzy Time Series (FTS) approach, introduced by Song and Chissom [12, 13], offered a paradigm shift by modeling temporal data through fuzzy sets. However, despite its success, the reliability of FTS is persistently hampered by two fundamental challenges: partitioning uncertainty and transition ambiguity.
Partitioning uncertainty arises during the division of the universe of discourse into intervals. Early models relied on rigid, subjective intervals, which were later improved by objective clustering algorithms like Fuzzy C-Means (FCM) [14, 15]. However, FCM remains highly sensitive to noise and the selection of the fuzzifier parameter, leading to unstable partitions [16]. Simultaneously, transition ambiguity occurs when a single fuzzy state leads to multiple potential future states (one-to-many relationships). Standard FTS models often use simple averaging to resolve these Fuzzy Logical Relationship Groups (FLRGs), which can lead to significant loss of information and reduced accuracy [17, 18].
Current literature has addressed these issues primarily in isolation. One group of researchers has focused on improving partitioning robustness by employing advanced fuzzy logic, such as Interval Type-2 Fuzzy Sets (IT2FS), to handle the uncertainty in clustering [18, 19]. For instance, IT2FCM has been recognized for its ability to model the "Footprint of Uncertainty" (FOU) more effectively than traditional type-1 methods [20-23]. Another group has focused on refining transition modeling by integrating Markov Chain (MC) models to calculate probabilities for fuzzy state transitions [20, 21, 24, 25]. While these individual advancements are significant, a critical gap remains: There is a lack of a unified hybrid framework that addresses both partitioning uncertainty and transition ambiguity simultaneously within a single, cohesive architecture.
To fill this gap, this study proposes a novel hybrid model, IT2FCM-MC-FTS. The synergy between IT2FCM’s robust clustering and MC’s probabilistic inference forms the core contribution of this research. Specifically, IT2FCM is utilized to establish noise-resistant intervals, while a first-order MC provides a logical and data-driven mechanism for resolving one-to-many ambiguities. The proposed model is validated using volatile carbon monoxide (CO) concentration data, demonstrating its ability to provide more accurate and stable forecasts than existing hybrid variants.
The remainder of this paper is organized as follows: Section 2 presents the related works. Section 3 details the proposed hybrid model. Section 4 presents the experimental setup and case study. Section 5 discusses the results. Finally, Section 6 concludes the paper.
Several methods have been developed to manage uncertainties in FTS and clustering algorithms are shown in Table 1. The traditional Type-1 Fuzzy Markov Chain (T1FM) uses Type-1 Fuzzy Sets (T1FS) to describe the distributional behavior of a discrete-time Markov process, but is limited in handling data noise and linguistic ambiguity [26-28]. To address these limitations, the Interval Type-2 Fuzzy Markov Chain (IT2FM) extends the scope by embedding multiple T1FS within its FOU, allowing for better modeling of uncertainties [26-28]. However, IT2FM approaches are often computationally intensive and complex [26-28].
FCM clustering is another method widely used for objective function-based partitioning, but it struggles with high-level fuzzy uncertainty [29-31]. The Adaptive Interval Type-2 Fuzzy C-Means (A-IT2FCM) algorithm improves upon FCM by using IT2FS and Karnik-Mendel type reduction, yet it introduces significant computational overhead [31]. Similarly, the General Type-2 Fuzzy C-Means (GT2 FCM) algorithm uses $\alpha$-planes and zSlices for efficient representation, but it remains computationally intensive [32].
Table 1. Comparative summary of existing methods and the proposed approach
|
Method |
Components |
Limitations |
|
Type-1 Fuzzy Markov Chain (T1FM) [26-28] |
T1FS |
Limited in handling data noise and linguistic ambiguity |
|
Interval Type-2 Fuzzy Markov Chain (IT2FM) [26-28] |
IT2FS, Type-reduction algorithms |
Computational intensity, complexity in modeling uncertainties |
|
Fuzzy C-Means (FCM) Clustering [29-31] |
Objective function-based clustering, T1FS |
Ineffective in managing high-level fuzzy uncertainty |
|
Adaptive IT2FCM (A-IT2FCM) [31] |
IT2FS, Karnik-Mendel type reduction |
Complexity in type reduction, computational overhead |
|
General Type-2 FCM (GT2 FCM) [32] |
a-planes, zSlices, linguistic fuzzifier |
High computational intensity, complexity in processing |
|
Hybrid FTS-MC with C-Means [33] |
FTS, MC, C-means clustering |
Random partitioning, insufficient accuracy in interval partitioning |
|
Credal C-Means (CCM) Clustering [34] |
Credal partition, meta-clusters |
Difficulty in classifying objects close to multiple clusters |
|
Proposed IT2FCM-MC-FTS |
IT2FCM, MC, volatility-based heuristic |
Focuses on univariate data; empirical fuzzifier selection |
Hybrid models combining FTS with Markov Chains and clustering techniques, such as the FTS-MC with C-means clustering, aim to improve model robustness. However, models often suffer from random partitioning and insufficient accuracy in interval partitioning [33]. Credal C-Means (CCM) clustering introduces meta-clusters to handle objects close to multiple clusters, but it faces challenges in correctly classifying such objects [34]. Table 1 provides a comparative summary of these existing methods and their limitations.
In conclusion, while various methods exist to manage partitioning uncertainty and transition ambiguity, a critical gap remains: There is a lack of a unified hybrid framework that addresses both issues simultaneously within a single, cohesive architecture.
3.1 The proposed IT2FCM-MC-FTS model
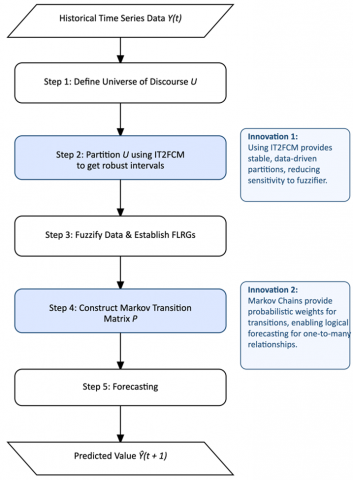
Our proposed model integrates robust partitioning (IT2FCM) with probabilistic forecasting (MC) in a single, cohesive framework. The overall architecture is depicted in Figure 1, and to ensure high transparency and reproducibility, the implementation details are described through the following stages:
Figure 1. Flowchart of the proposed model
The implementation details, derived from the experimental code, are described below:
3.1.1 Stage 1: Robust partitioning with IT2FCM
The foundation of the model is the quality of fuzzy partitions. To create partitions robust to noise, we employ IT2FCM, which accounts for the uncertainty in the fuzzifier parameter. The algorithm seeks to minimize the objective function:
$J_{m 1, m 2}=\sum_{k=1}^n \sum_{i=1}^c\left(v_{i k}\right)^m\left\|x_k-v_i\right\|^2$ (1)
where, $m \in\left[m_1, m_2\right]$ represents the interval-valued fuzzifier. In our implementation, we utilize the centroid of this interval $(\bar{m}=1.95)$ to achieve a robust representative clustering center. To ensure reproducibility of the fuzzy partitions, a fixed random seed of 7521 is applied. The clustering process is governed by a convergence threshold ($\epsilon=0.005$) and a maximum of 1000 iterations.
The optimal number of clusters $c$ is determined dynamically using a volatility-based heuristic. This is calculated as the ratio between the total range of data and the average volatility (mean absolute difference):
$C_{\text {raw }}=\operatorname{round}\left(\frac{D_{\max }-D_{\min }}{\frac{1}{n-1} \sum_{1=2}^n\left|x_i-x_{i-1}\right|}\right)$ (2)
To ensure model stability across different dataset sizes, a constraint is applied: $\left(c=\max \left(2, \min \left(c_{\text {raw}}, n / 2\right)\right)\right)$. This ensures that the number of fuzzy states is proportional to the dynamic behavior of the series while maintaining enough data points per cluster for statistical validity.
3.1.2 Stage 2: Fuzzification and FLRG establishment
With the cluster centers $v_i^*$ obtained and sorted, the historical time series $Y_t$ is fuzzified. Unlike traditional methods that use equal-length intervals, our model defines the boundaries of fuzzy sets $\left\{A_i, \ldots \ldots, A_c\right\}$ based on the midpoints between adjacent cluster centers:
$B_i=\frac{v_i^*+v_{i+1}^*}{2}, i=1, \ldots, c-1$ (3)
This creates adaptive intervals that are denser where data points are concentrated. Each $Y_t$ is mapped to the corresponding fuzzy set $A_i$ within these boundaries. The sequence of fuzzy sets forms Fuzzy Logical Relationships (FLR), denoted as $A_{t-1} \rightarrow A_t$, which are then grouped by their antecedent to form FLRGs.
3.1.3 Stage 3: Probabilistic forecasting with MC
To resolve the one-to-many ambiguity in FLRGs, w construct a $c \times c$ transition probability matrix $P$. Eacl element $P_{i j}$ represents the probability of moving from state $A_i$ to $A_j$, a first-order MC transition probability matrix $P$ is constructed:
$P_{i j}=\frac{N_{i j}}{\sum_{k=1}^c N_{i k}}$ (4)
where, $N_{i j}$ is the frequency of the transition observed in the training data $A_i \rightarrow A_j$. This ensures that the weights for future states are entirely data-driven.
3.1.4 Forecasting (Defuzzification)
The final forecast $\hat{Y}_{(t+1)}$ is computed as the probabilistic weighted average of the centers of all potential future states:
$\hat{Y}_{(t+1)}=\sum_{j=1}^c v_j^* \cdot P_{i j}$ (5)
This approach avoids the information loss inherent in simple averaging by prioritizing transitions that occur more frequently in the historical data.
3.2 Algorithmic structure of IT2FCM-MC-FTS
The complete logic of the proposed IT2FCM-MC-FTS model is summarized in Algorithm 1.
|
Algorithm 1: IT2FCM-MC-FTS Forecasting Procedure |
Historical time series $\left\{Y=y_1, y_2, \cdots, y_n\right\}$, fuzzifier range [1.8, 2.1], seed 7521
Predicted value $\widehat{y_t}+1$ |
4.1 Case study: CO concentration forecasting
To validate the proposed model, we conduct a case study using the ambient concentration of CO from the AQMS Station in Mijen, Semarang City, Indonesia. The dataset represents a highly volatile environment, making it a suitable benchmark for testing partitioning robustness.
4.2 Validation strategy: Rolling forecast
To ensure a rigorous evaluation, we implemented a rolling-basis (walk-forward) validation strategy. For each time step ![]() , the model is trained on observations $\left\{Y_1, \ldots, Y_{t-1}\right\}$ and tested on $Y_t$. This process is repeated until the end of the dataset. Unlike standard k-fold cross-validation, the rolling forecast preserves the temporal dependencies within the data, providing a more realistic measure of forecasting accuracy for real-world applications.
, the model is trained on observations $\left\{Y_1, \ldots, Y_{t-1}\right\}$ and tested on $Y_t$. This process is repeated until the end of the dataset. Unlike standard k-fold cross-validation, the rolling forecast preserves the temporal dependencies within the data, providing a more realistic measure of forecasting accuracy for real-world applications.
4.3 Baseline models for comparison
To evaluate the specific contributions of our model's components, we compare its performance against three baseline models:
Conducted previous research by Yin et al. [23], our proposed model and IT2FCM-FTS, the fuzzifier interval was set to $\left[\mathrm{m}_1, \mathrm{~m}_2\right]$ = [1.8, 2.1].
4.4 Evaluation metrics
The forecasting accuracy is measured using three standard metrics: Root Mean Square Error (RMSE) and Symmetric Mean Absolute Percentage Error (SMAPE). To verify the significance of the results, we define the Wilcoxon Signed-Rank Test as our primary statistical tool. The null hypothesis $\left(H_0\right)$ assumes no significant difference in the absolute error series between the proposed model and benchmarks $\alpha=0.05$.
5.1 Forecasting performance
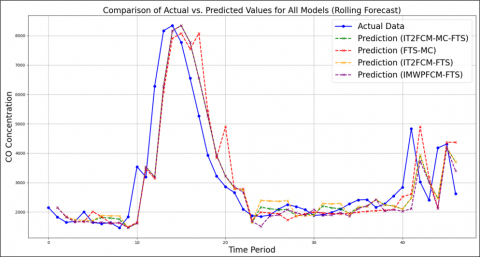
The forecasting results for all models on the CO concentration dataset are summarized in Table 2. The proposed IT2FCM-MC-FTS model achieved the lowest error on both metrics, demonstrating the highest accuracy among the tested models for this case study, as shown in Figure 2.
Table 2. Forecasting error comparison with FTS models
|
Model |
RMSE |
SMAPE (%) |
|
IT2FCM-FTS |
897.29 |
19.32 |
|
FTS-MC |
1068.99 |
20.34 |
|
IT2FCM-MC-FTS (Proposed) |
887.47 |
17.86 |
|
IMWPFCM-FTS |
914.68 |
17.96 |
Figure 2. Comparison of actual vs. forecasted values for the dataset
5.2 Discussion: The synergistic effect
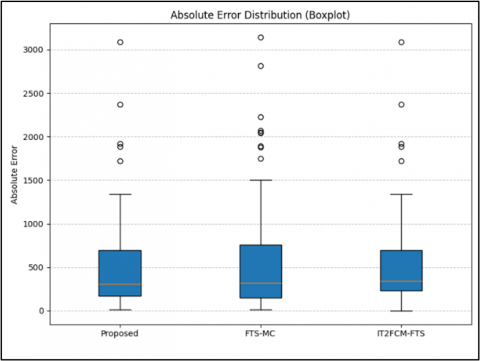
Visual analysis in Figure 3 provides critical evidence that complements the statistical tests. The Boxplot in Figure 3(a) shows that the proposed model achieves a lower median absolute error and a more compact interquartile range (IQR) compared to FTS-MC, suggesting higher prediction stability.
(a) Absolute error distribution
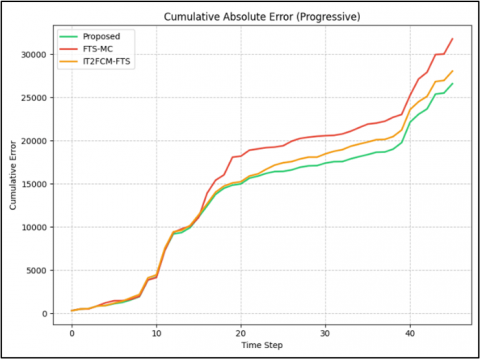
(b) Cumulative absolute error
Figure 3. Statistical significance analysis
The Wilcoxon test comparing the proposed model against IT2FCM-FTS yielded a p-value of 0.0023, indicating a highly significant improvement $(p<0.01)$. This confirms that the MC's probabilistic inference is significantly superior to simple averaging when robust partitions are already established.
For the comparison against FTS-MC, the test resulted in a p-value of 0.1061. Although this exceeds the traditional 0.05 threshold, it represents a marginal significance that suggests a strong trend toward improvement. In the context of TFS with a limited sample size $(n=46)$. A p-value in this range often indicates that the proposed model is consistently outperforming the baseline, but the statistical power is constrained by the number of observations.
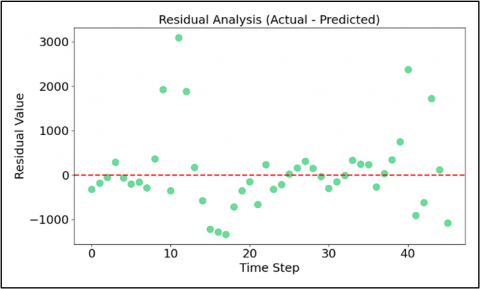
5.3 Residual analysis and statistical significance
Statistical test against IT2FCM-FTS yielded $p=0.0023$ (highly significant). Against FTS-MC, $p=0.1061$, showing marginal significance constrained by sample size ($n=46$).
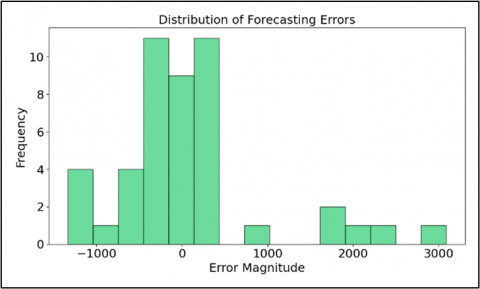
To validate the reliability of the model, we performed a residual analysis. Figure 4(a) shows that the residuals (the difference between actual and predicted values) are randomly scattered around the zero line without obvious heteroscedasticity patterns. This indicates that the model has effectively captured the temporal dynamics of the data. The error distribution in Figure 4(b), the histogram also shows a near-normal shape centered at zero, proving that model bias is very low despite the high volatility of the data.
(a) Residual analysis
(b) Error distribution histogram
Figure 4. Residual analysis and statistical significance
5.4 Discussion
The performance metrics in Table 1 not only demonstrate the superiority of the proposed model but also serve as an ablation study to validate the role of its hybrid components. Analysis of RMSE and SMAPE reveals a clear synergistic effect. The FTS-MC model, which utilizes MCs but relies on simple uniform partitioning, yielded the highest error (RMSE 1068.99; SMAPE 20.34%). This confirms that even a sophisticated transition mechanism cannot compensate for non-representative partitioning. Conversely, the IT2FCM-FTS model, using robust partitioning but simple averaging, performed significantly better (RMSE 897.29; SMAPE 19.32%), yet remained less accurate than the proposed IT2FCM-MC-FTS.
Furthermore, the superiority over the IMWPFCM-FTS model (RMSE 914.68 vs. 887.47) suggests that IT2FCM's ability to model the FOU provides a more noise-resistant foundation than other advanced fuzzy clustering variants for this specific volatile dataset.
Beyond these technical benchmarks, the higher accuracy of the IT2FCM-MC-FTS model provides significant practical implications for air quality management in Semarang City:
This study presented a novel hybrid forecasting framework, IT2FCM-MC-FTS, designed to mitigate the fundamental challenges of partitioning uncertainty and transition ambiguity in FTS. By integrating IT2FCM for robust, data-driven partitioning and a first-order MC for probabilistic inference, the model provides a more resilient approach to handling volatile datasets. Experimental results on CO concentration data demonstrated that the proposed model achieves superior accuracy, with an RMSE of 887.47 and a SMAPE of 17.86%, significantly outperforming traditional FTS and single-component hybrid models.
Despite these contributions, several limitations of the current study must be acknowledged. First, the proposed model focuses exclusively on univariate time series data, which may not capture the complex interdependencies present in multivariate environmental systems. Second, the determination of the fuzzifier interval and the number of clusters, while based on volatility heuristics, still relies on empirical selections that may require further fine-tuning for different data scales.
Future research directions will prioritize the extension of the IT2FCM-MC-FTS architecture to multivariate time series analysis. Furthermore, the integration of meta-heuristic optimization algorithms, such as Particle Swarm Optimization (PSO) or Genetic Algorithms (GA), will be explored to automate the selection of optimal fuzzifier parameters and cluster counts. Finally, the model's scalability will be tested across more diverse and large-scale volatile problems, including renewable energy production and financial market forecasting.
[1] Palomero, L., García, V., Sánchez, J.S. (2022). Fuzzy-based time series forecasting and modelling: A bibliometric analysis. Applied Sciences, 12(14): 6894. https://doi.org/10.3390/app12146894
[2] Jiang, P., Yang, H.F., Li, H.M., Wang, Y. (2021). A developed hybrid forecasting system for energy consumption structure forecasting based on fuzzy time series and information granularity. Energy, 219: 119599. https://doi.org/10.1016/j.energy.2020.119599
[3] Al-Ali, E.M., Hajji, Y., Said, Y., Hleili, M., Alanzi, A.M., Laatar, A.H., Atri, M. (2023). Solar energy production forecasting based on a hybrid CNN-LSTM-transformer model. Mathematics, 11(3): 676. https://doi.org/10.3390/math11030676
[4] Pribadi, T., Siregar, D., Amalia, A., Lubis, A.S., Parluhutan, T.A., Kumalasari, F., Marpaung, J.L. (2025). Application of the Cheng Fuzzy Time Series model for stock price forecasting: A case study in the energy sector. Mathematical Modelling of Engineering Problems, 12(8): 2741-2753. https://doi.org/10.18280/mmep.120815
[5] Feng, Z.K., Shi, P.F., Yang, T., Niu, W.J., Zhou, J.Z., Cheng, C.T. (2022). Parallel cooperation search algorithm and artificial intelligence method for streamflow time series forecasting. Journal of Hydrology, 606: 127434. https://doi.org/10.1016/j.jhydrol.2022.127434
[6] Folaponmile, A., Kolawole, S.F., John, S.N. (2023). Air pollution forecasting using fuzzy time series models for Kaduna Metropolis, Nigeria. FUOYE Journal of Engineering and Technology, 8(2): 142-146. https://doi.org/10.46792/fuoyejet.v8i2.968
[7] Bareith, T., Tatay, T., Vancsura, L. (2024). Navigating inflation challenges: AI-based portfolio management insights. Risks, 12(3): 46. https://doi.org/10.3390/risks12030046
[8] Tang, Y.M., Chau, K.Y., Li, W.Q., Wan, T.W. (2020). Forecasting economic recession through share price in the logistics industry with artificial intelligence (AI). Computation, 8(3): 70. https://doi.org/10.3390/COMPUTATION8030070
[9] Yolcu, O.C., Yolcu, U. (2023). A novel intuitionistic fuzzy time series prediction model with cascaded structure for financial time series. Expert Systems with Applications, 215: 119336. https://doi.org/10.1016/j.eswa.2022.119336
[10] Sirisha, U.M., Belavagi, M.C., Attigeri, G. (2022). Profit prediction using ARIMA, SARIMA and LSTM models in time series forecasting: A comparison. IEEE Access, 10: 124715-124727. https://doi.org/10.1109/ACCESS.2022.3224938
[11] Dubey, A.K., Kumar, A., García-Díaz, V., Sharma, A.K., Kanhaiya, K. (2021). Study and analysis of SARIMA and LSTM in forecasting time series data. Sustainable Energy Technologies and Assessments, 47: 101474. https://doi.org/10.1016/j.seta.2021.101474
[12] Song, Q., Chissom, B.S. (1993). Forecasting enrollments with fuzzy time series — Part I. Fuzzy Sets and Systems, 54(1): 1-9. https://doi.org/10.1016/0165-0114(93)90355-L
[13] Song, Q., Chissom, B.S. (1994). Forecasting enrollments with fuzzy time series — Part II. Fuzzy Sets and Systems, 62(1): 1-8. https://doi.org/10.1016/0165-0114(94)90067-1
[14] Chen, H.L., Gao, X.D., Wu, Q. (2025). An enhanced fuzzy time series forecasting model integrating fuzzy C-means clustering, the principle of justifiable granularity, and particle swarm optimization. Symmetry, 17(5): 753. https://doi.org/10.3390/sym17050753
[15] Xian, S.D., Cheng, Y. (2021). Pythagorean fuzzy time series model based on Pythagorean fuzzy c-means and improved Markov weighted in the prediction of the new COVID-19 cases. Soft Computing, 25: 13881-13896. https://doi.org/10.1007/s00500-021-06259-2
[16] Gong, Z.T., Feng, J.D. (2025). A novel multifactor type-2 fuzzy time series model based on improved fuzzy C-means algorithm and justifiable granularity for stock index forecasting. Soft Computing, 29: 3719-3732. https://doi.org/10.1007/s00500-025-10651-7
[17] Satriani, R.B.A., Farikhin, F., Surarso, B. (2024). Hybrid heuristic model and Fuzzy C-Means for stock forecasting using Type 2 Fuzzy Time Series. Interdisciplinary Social Studies, 4(1): 27-36. https://iss.internationaljournallabs.com/index.php/iss/article/view/742.
[18] Odah, M.H. (2021). Unemployment rate forecasting via Markov chains. International Journal of Sustainable Development and Planning, 16(6): 1191-1194. https://doi.org/10.18280/ijsdp.160620
[19] Hernández, P., Cubillo, S., Torres-Blanc, C. (2022). A complementary study on general interval type-2 fuzzy sets. IEEE Transactions on Fuzzy Systems, 30(11): 5034-5043. https://doi.org/10.1109/TFUZZ.2022.3167140
[20] Dang, T.H., Ngo, L.T., Pedrycz, W. (2015). Interval Type-2 fuzzy C-Means approach to collaborative clustering. In 2015 IEEE International Conference on Fuzzy Systems (FUZZ-IEEE), Istanbul, Turkey, pp. 1-7. https://doi.org/10.1109/FUZZ-IEEE.2015.7337932
[21] Alhendi, A., Al-Sumaiti, A.S., Marzband, M., Kumar, R., Diab, A.A.Z. (2023). Short-term load and price forecasting using artificial neural network with enhanced Markov chain for ISO New England. Energy Reports, 9: 4799-4815. https://doi.org/10.1016/j.egyr.2023.03.116
[22] Bardadi, A., Warsito, B., Surarso, B., Sugiharto, W.H. (2025). Interval Type-2 Fuzzy C-Means (IT2FCM) for robust forecasting of carbon monoxide concentrations in urban air quality monitoring. Mathematical Modelling of Engineering Problems, 12(6): 2021-2030. https://doi.org/10.18280/mmep.120617
[23] Yin, Y., Sheng, Y.H., Qin, J.R. (2022). Interval type-2 fuzzy C-means forecasting model for fuzzy time series. Applied Soft Computing, 129: 109574. https://doi.org/10.1016/j.asoc.2022.109574
[24] Alyousifi, Y., Othman, M., Husin, A., Rathnayake, U. (2021). A new hybrid fuzzy time series model with an application to predict PM10 concentration. Ecotoxicology and Environmental Safety, 227: 112875. https://doi.org/10.1016/j.ecoenv.2021.112875
[25] Alyousifi, Y., Othman, M., Faye, I., Sokkalingam, R., Silva, P.C.L. (2020). Markov weighted fuzzy time-series model based on an optimum partition method for forecasting air pollution. International Journal of Fuzzy Systems, 22: 1468-1486. https://doi.org/10.1007/s40815-020-00841-w
[26] Figueroa-García, J.C., Kalenatic, D., Lopez, C.A. (2011). Interval type-2 fuzzy Markov chains: Type reduction. In 7th International Conference on Advanced Intelligent Computing Theories and Applications, Zhengzhou, China, pp. 211-218. https://doi.org/10.1007/978-3-642-25944-9_28
[27] García, J.C.F. (2010). Interval type-2 fuzzy Markov chains: An approach. In 2010 Annual Meeting of the North American Fuzzy Information Processing Society, Toronto, ON, Canada. https://doi.org/10.1109/NAFIPS.2010.5548286
[28] Figueroa-García, J.C. (2013). Interval type-2 fuzzy Markov chains. In Advances in Type-2 Fuzzy Sets and Systems, pp. 49-64. https://doi.org/10.1007/978-1-4614-6666-6_4
[29] Chung-Hoon Rhee, F. (2007). Uncertain fuzzy clustering: Insights and recommendations. IEEE Computational Intelligence Magazine, 2(1): 44-56. https://doi.org/10.1109/MCI.2007.357193
[30] Rubio, E., Castillo, O. (2014). Interval type-2 fuzzy clustering algorithm using the combination of the fuzzy and possibilistic C-Mean algorithms. In 2014 IEEE Conference on Norbert Wiener in the 21st Century (21 CW), Boston, MA, USA. https://doi.org/10.1109/NORBERT.2014.6893879
[31] He, H., Yu, X., Hu, D. (2015). Land cover classification based on adaptive interval-valued type-2 fuzzy clustering analysis. In 8th International Conference on Knowledge Science, Engineering and Management (KSEM 2015), Chongqing, China, pp. 712-720. https://doi.org/10.1007/978-3-319-25159-2_65
[32] Linda, O., Manic, M. (2012). General type-2 fuzzy C-means algorithm for uncertain fuzzy clustering. IEEE Transactions on Fuzzy Systems, 20(5): 883-897. https://doi.org/10.1109/TFUZZ.2012.2187453
[33] Alyousifi, Y., Othman, M. (2022). Forecasting PM10 concentration based on a hybrid fuzzy time series model. In the 1st International Conference on Artificial Intelligence for Smart Community (AISC 2020), Universiti Teknologi Petronas, Malaysia, pp. 177-184. https://doi.org/10.1007/978-981-16-2183-3_16
[34] Liu, Z.G., Pan, Q., Dezert, J., Mercier, G. (2015). Credal c-means clustering method based on belief functions. Knowledge-Based Systems, 74: 119-132. https://doi.org/10.1016/j.knosys.2014.11.013