Elif Akarsu*![]() | Tevhit Karacali
| Tevhit Karacali![]()
© 2025 The authors. This article is published by IIETA and is licensed under the CC BY 4.0 license (http://creativecommons.org/licenses/by/4.0/).
OPEN ACCESS
This study explores the effective use of multispectral data from Landsat 8 and 9 satellites by applying various band combinations and Intensity-Hue-Saturation (IHS) fusion techniques for the analysis of land surface features. The research highlights the advantages of false-color composites, particularly in identifying vegetation health, soil structure, and water bodies. Band combinations such as B5-B4-B3, B6-B5-B4, and B7-B5-B3 proved successful in distinguishing thematic differences, while the IHS transformation enhanced spatial resolution. Quantitative metrics including Entropy, Structural Similarity Index (SSIM), Root Mean Square Error (RMSE), Universal Image Quality Index (UIQI) and correlation coefficients were used to evaluate the comparative performance of different bands. Findings indicate that Band 6 (SWIR 1) provided the highest structural similarity and image quality, whereas Band 11 (Thermal Infrared (TIR)), despite its rich information content, showed lower structural coherence. In conclusion, the integration of Landsat imagery with appropriate band selection and fusion methods offers a robust and reliable decision-support tool for environmental monitoring, agricultural analysis, and natural resource management.
image fusion, SSIM, RMSE, UIQI, IHS fusion, Landsat, RGB image, geological analysis
In this study, high-resolution panchromatic and multispectral images from the Landsat 8 and Landsat 9 satellites were processed using the Intensity-Hue-Saturation (IHS) fusion method to enhance both spatial and spectral information for environmental analysis. To achieve optimal fusion results, careful consideration was given to the selection of fusion parameters, including band-to-channel assignments and intensity component scaling, based on the spectral characteristics of the input bands and the target application. Near-infrared (NIR) and Shortwave Infrared (SWIR) bands, which are highly sensitive to vegetation and soil properties, were prioritized when assigning bands to hue and saturation channels to maximize the visibility of relevant surface features. Additionally, intensity normalization and histogram matching were applied to adjust the dynamic range and preserve spectral fidelity. While this study focused on a specific application, the methodology provides general guidance for parameter selection, emphasizing the importance of matching spectral sensitivity with target features and balancing spatial detail against spectral integrity. Future work may include systematic sensitivity analyses or algorithmic optimization to refine parameter settings for different environmental and land-cover scenarios. The use of Landsat data in this context underscores the enduring significance of satellite-based Earth observation, which has become an indispensable tool for environmental monitoring and geospatial analysis in the 21st century. Initiated in 1972 through a collaboration between the United States Geological Survey (USGS) and the National Aeronautics and Space Administration (NASA), the Landsat program was the first civilian satellite mission designed to systematically monitor the Earth’s surface over long time periods. Over the decades, Landsat imagery has contributed extensively to research and decision-making in agriculture, forestry, hydrology, geology, urban development, and environmental change detection. With the continued operation of Landsat 8 and 9, high-quality multispectral and thermal imagery is now available to researchers and institutions worldwide at consistent intervals, supporting long-term monitoring, analysis, and informed environmental management practices.
Landsat satellite data offers a rich and reliable resource for spatial analysis due to its multispectral structure and strong temporal resolution. The Landsat 8 and 9 satellites are equipped with the Operational Land Imager (OLI) and Thermal Infrared Sensor (TIRS), which collect data in the visible, NIR, SWIR, and Thermal Infrared (TIR) spectral ranges. The OLI sensor captures data in 9 spectral bands at a spatial resolution of 30 meters, while a panchromatic band enables the generation of high-resolution imagery at 15 meters. The TIRS sensor provides two thermal bands at 100-meter resolution, which are resampled to 30 meters for consistency with other data layers. With a 16-day revisit cycle, Landsat satellites enable consistent and periodic data acquisition over the same regions, supporting time-series analyses and change detection studies. The distributed data products are available at Level-1 (geometrically corrected) and Level-2 (atmospherically corrected) processing levels, and include auxiliary files such as cloud masks, quality assessment bands, and radiometric calibration metadata. Landsat imagery is widely used in applications such as land cover classification, agricultural monitoring, water resource management, deforestation and wildfire detection, and urban sprawl analysis. Importantly, all Landsat data is provided freely and openly by the USGS, ensuring equitable access to this critical dataset for researchers, institutions, and policymakers worldwide, and supporting global efforts in sustainable development, disaster management, and natural resource planning. In connection with the rich spectral capabilities of the Landsat satellites, false color imagery has become an indispensable tool in remote sensing applications, particularly in the fields of vegetation monitoring and soil analysis [1]. By utilizing non-visible spectral bands such as NIR and SWIR, false color composites reveal surface features that are otherwise imperceptible in natural color imagery. These images are generated by assigning infrared bands to visible color channels (RGB), thus enhancing the detectability of land surface conditions. Vegetation analysis greatly benefits from false color composites, especially those incorporating the NIR band. Healthy vegetation exhibits high reflectance in the NIR spectrum and strong absorption in the red visible band due to chlorophyll activity. When NIR is mapped to the red channel (e.g., band 5 in Landsat 8/9), red to bright red tones in the imagery highlight areas of dense and healthy vegetation, while degraded or sparse vegetation appears in muted tones. This makes it possible to monitor agricultural productivity, assess drought stress, map deforestation, and evaluate post-disturbance regeneration with greater precision than would be possible using true-color images. In terms of soil analysis, false color imagery enables differentiation among soil types, moisture levels, and mineral compositions. The SWIR bands are particularly sensitive to soil moisture and surface roughness, allowing the detection of dry versus wet soils, erosion-prone areas, and saline or degraded lands. Combinations such as Landsat’s 7-5-3 or 6-5-2 (SWIR-NIR-red) composites help analysts distinguish bare soil from low-vegetation cover, monitor arid and semi-arid environments, and support land degradation assessments [2]. Ultimately, false color imagery enhances both the visual and analytical interpretation of remote sensing data. When used in conjunction with vegetation indices like NDVI and soil indices derived from SWIR bands, it provides a multidimensional view of landscape dynamics. Supported by the high temporal consistency and spectral richness of the Landsat program, these images offer a vital resource for sustainable land management, ecological monitoring, precision agriculture, and climate change adaptation strategies [3].
Although the IHS transformation is a well-established image fusion technique, the methodological value of this study lies in its context-specific application to the spectral characteristics and environmental conditions of the study area. Rather than proposing a new fusion algorithm, the contribution of this work focuses on evaluating how IHS-based fusion, combined with selected multispectral band configurations, improves the separability, interpretability, and visual clarity of surface features. Such an application-driven assessment has not been previously reported for this sensor–region combination. Furthermore, the use of comprehensive quantitative metrics (e.g., RMSE, CC, UIQI, Entropy) provides new insights into the performance of classical fusion approaches under these specific spectral and environmental conditions. Therefore, the novelty of this study is primarily application-oriented, demonstrating how classical techniques can yield enhanced outcomes when systematically optimized for a particular remote sensing problem.
Remotely sensed imagery from the Landsat 8 and Landsat 9 satellites, equipped with the OLI and TIRS, was carefully selected and processed to provide a robust foundation for multispectral and panchromatic image fusion, spectral analysis, and environmental monitoring. The study area was specifically chosen in the beach and coastal regions of California, encompassing diverse land cover types and environmental conditions suitable for remote sensing analysis. The datasets were obtained using the Landsat Product Identifier and selected based on key metadata parameters, including WRS Path/Row, Sensor Identifier (OLI_TIRS), Day/Night Indicator (Day), Nadir/Off-Nadir geometry, Sun Elevation (L0RA between 0 and 5 degrees), Data Type (Level-1TP), Collection Category (all categories), and Image Quality (Best = 9), while individual scenes were verified through the Landsat Scene Identifier to ensure high-quality acquisition conditions, including daytime imaging, nadir viewing geometry, and acceptable geometric RMSE. Although these Level-1 products are radiometrically calibrated and systematically corrected, additional preprocessing was necessary to achieve accurate surface reflectance values. This included atmospheric correction using the Collection 2 Surface Reflectance processing chain (LaSRC), which compensates for the effects of aerosols, water vapor, ozone, and Rayleigh scattering, taking into account solar geometry and acquisition time. Radiometric calibration converted raw digital numbers to Top-of-Atmosphere (TOA) reflectance and subsequently to surface reflectance values using sensor-specific calibration coefficients, ensuring consistency across scenes and minimizing radiometric variability. The preprocessed imagery was then used to generate false-color composites, leveraging NIR and SWIR bands to enhance the visibility of surface features that are difficult to identify in true-color imagery, such as vegetation health, soil texture differences, and moisture variations. Quantitative analyses were conducted using vegetation indices, including the Normalized Difference Vegetation Index (NDVI), while Geographic Information System (GIS) tools were employed to perform spatial mapping, land-cover classification, change detection, and the integration of multispectral data with ancillary spatial layers. This comprehensive approach enabled the systematic assessment of land surface dynamics over time and space, providing detailed insights into vegetation vitality, soil properties, and environmental conditions. By combining careful scene selection, rigorous preprocessing, atmospheric and radiometric correction, advanced spectral analysis, and GIS-based spatial modeling, this study establishes a fully integrated framework for analyzing environmental changes with both high spatial and spectral fidelity, ensuring that the fused images are accurate, reliable, and suitable for a wide range of remote sensing applications, including ecological monitoring, land management, and resource planning.
The Landsat program, operational since 1972 under the joint administration of the USGS and the NASA, represents one of the most comprehensive and enduring global Earth observation initiatives. Over the past five decades, Landsat has provided a systematic record of the Earth’s surface, enabling long-term monitoring of environmental changes and supporting research across a wide range of scientific and operational fields, including agriculture, forestry, hydrology, geology, urban development, and climate change assessment. Landsat 8 and 9, in particular, offer 11 spectral bands that span the visible, NIR, SWIR, and TIR regions of the electromagnetic spectrum. The OLI provides nine spectral bands with a spatial resolution of 30 meters, including a high-resolution panchromatic band at 15 meters, while the TIRS offers two thermal bands at 100 meters, resampled to 30 meters to ensure compatibility with multispectral imagery [4]. The 16-day revisit cycle of Landsat ensures consistent temporal coverage, which is critical for detecting seasonal and long-term environmental changes, analyzing vegetation health, monitoring urban expansion, and assessing soil moisture and land-cover dynamics. Moreover, the freely accessible nature of these datasets through platforms such as USGS Earth Explorer and Google Earth Engine further enhances their utility for large-scale, long-term studies, supporting both research and practical applications in environmental monitoring and resource management [5].
Although this study primarily focused on single-date imagery from Landsat 8 and 9 for methodological development and demonstration of the IHS fusion process, the temporal continuity of these satellites presents significant opportunities for multi-temporal analysis. Multi-temporal fusion can improve the monitoring of environmental changes, such as seasonal vegetation dynamics, soil moisture variations, land-cover transformations, and urban expansion, by integrating information across multiple acquisition dates. While single-date imagery was sufficient for validating the fusion methodology and evaluating spatial and spectral quality, the framework established in this study is fully compatible with time-series data. Future work may incorporate multi-date analyses to enable robust assessment of temporal trends and environmental changes over extended periods, thereby providing actionable insights for ecological management, land-use planning, and resource allocation [6]. Building on this foundation, a methodology was developed to enhance the informational richness and thematic interpretation of satellite imagery by generating composite images from various combinations of three spectral bands. These composites were designed to integrate diverse spectral characteristics into unified datasets capable of capturing detailed surface information across multiple land-cover types. To further improve interpretability, the IHS transformation was applied, decomposing each image into three fundamental components: intensity (I), hue (H), and saturation (S), which represent tonal distribution, spectral variation, and color purity, respectively. Subsequently, an image fusion strategy was employed in which selected spectral bands not originally included in the composite were substituted into the intensity and saturation components to investigate the effects of spectral-spatial integration on image quality and surface feature detection. Six distinct IHS-based fusion scenarios were developed, each emphasizing thematic characteristics such as vegetation health, soil texture, moisture content, and anthropogenic structures. The performance of each scenario was quantitatively evaluated using metrics including statistical correlation coefficients, structural similarity indices, and spectral distortion measures, allowing for a systematic assessment of spectral combinations and the identification of optimal configurations for enhanced land-cover differentiation [7].
In this context, the detailed properties, spectral ranges, spatial resolutions, and primary applications of Landsat 8/9 bands B1 through B11 were thoroughly considered to inform the selection of specific band combinations for the fusion process. These bands are widely used for applications such as vegetation assessment, soil moisture detection, water quality monitoring, and urbanization tracking. The combination of high spatial resolution, broad spectral coverage, and consistent revisit intervals provided by Landsat 8 and 9 enabled comprehensive analyses across multiple land surface features, making them ideally suited for both fusion and thematic interpretation. The properties of these bands are summarized in Table 1.
Table 1. Properties of sprctral bands
|
Band |
Spectral Range (µm) |
Spectral Region |
Spatial Resolution |
|
B1 |
0.433 – 0.453 |
Coastal / Aerosol |
30 m |
|
B2 |
0.450 – 0.515 |
Blue |
30 m |
|
B3 |
0.525 – 0.600 |
Green |
30 m |
|
B4 |
0.630 – 0.680 |
Red |
30 m |
|
B5 |
0.845 – 0.885 |
NIR |
30 m |
|
B6 |
1.560 – 1.660 |
SWIR 1 |
30 m |
|
B7 |
2.100 – 2.300 |
SWIR 2 |
30 m |
|
B8 |
0.500 – 0.680 |
Panchromatic |
15 m |
|
B9 |
1.360 – 1.390 |
Cirrus |
30 m |
|
B10 |
10.60 – 11.19 |
TIRS 1 |
100m (resampled to 30 m) |
|
B11 |
11.50 – 12.51 |
TIRS 2 |
100m (resampled to 30 m) |
The IHS transformation allows for seamless fusion of images because it separates the spatial and spectral components of the image. By retaining the intensity (which contains spatial details) and substituting the hue and saturation (which contain spectral information) with data from other spectral bands, it is possible to enhance specific surface features. This method improves the quality of land cover classification, vegetation monitoring, and urban expansion detection.
For instance, when fusing bands from Landsat 8 or Landsat 9, the panchromatic band (which has a higher spatial resolution) can be used to enhance the intensity component, while the NIR or SWIR bands can be used for hue and saturation, depending on the thematic feature of interest [8]. The main characteristics, workflow, and applications of the IHS fusion method are summarized in Table 2.
For the fusion and analysis of Landsat datasets, specific spectral band combinations were utilized to enhance the visualization and interpretation of various land surface features. These combinations were carefully selected to emphasize thematic distinctions such as vegetation health, soil composition, and geological structures. For instance, the B5-B4-B3 configuration—where the NIR band (B5) is assigned to red, the red band (B4) to green, and the green band (B3) to blue—was applied to highlight healthy vegetation, which appears prominently in red due to its strong reflectance in the NIR spectrum. The B6-B5-B4 combination was used to effectively differentiate between agricultural areas and varying soil types by capturing subtle differences in moisture and texture. To detect burned areas and mineral-rich zones, the Additionally, the B7-B5-B3 combination was utilized for geological analysis, allowing for detailed examination of rock formations and mineral content. These targeted band composites were essential in the IHS-based fusion process, as they provided the spectral inputs necessary to generate enhanced images. By applying these band arrangements across multiple by utilizing Landsat datasets, the study established a robust and comparative framework for assessing land cover dynamics and environmental variations across multiple time periods and sensor observations. Different spectral band combinations were applied to enhance specific land surface characteristics, such as vegetation vigor, soil patterns, and geological features. The applied color composites and their corresponding analytical purposes are summarized in Table 3.
Table 2. Key characteristics and operational workflow of the IHS-based image fusion method
|
Feature |
Description |
|
Fusion Domain |
Spatial (component substitution in RGB or multispectral domain) |
|
Input Requirements |
3-band multispectral image (usually in RGB or false color) + high-resolution image (e.g., Panchromatic) |
|
Transformation |
Converts RGB to IHS space, allowing separation of brightness and color info |
|
Components |
- I (Intensity): Overall brightness- H (Hue): Dominant wavelength (color tone)- S (Saturation): Color purity or vividness |
|
Fusion Mechanism |
Replace the I component with a high-resolution image, then perform inverse IHS |
|
Main Advantages |
- Enhances spatial detail while preserving spectral information- Intuitive and visually effective |
|
Common Applications |
- Urban studies- Vegetation monitoring- Land use/land cover mapping |
|
Limitations |
- Suitable mainly for 3-band images- Spectral distortion can occur if not properly matched |
|
Output Format |
3-band multispectral image with improved spatial resolution |
|
Evaluation Metrics |
- Spectral angle- Correlation coefficient- Structural similarity (SSIM) |
|
Recommended Color Space |
RGB or False Color (e.g., NIR-R-G for vegetation studies) |
Table 3. Spectral band combinations and their application purposes in Landsat-based analysis
|
Color Channel |
R |
G |
B |
Description |
Changing Spectral Band Information |
|
B5-B4-B3 |
5 |
4 |
3 |
Vegetation emphasis – Healthy vegetation appears red |
B1-B7-B8-B11 |
|
B6-B5-B4 |
6 |
5 |
4 |
Agriculture and soil differentiation |
B1-B7-B8-B11 |
|
B7-B5-B3 |
7 |
5 |
3 |
Geological analysis |
B1-B6-B8-B11 |
Entropy is a metric used to measure the information content of an image. It reflects how complex and disordered the image is. A high entropy value indicates greater information and diversity, while a low entropy value suggests uniformity or simplicity. Entropy is most commonly calculated using Shannon Entropy, which is based on the distribution of pixel values within the image. The formula is given by:
$H(X)=-\sum_{i=1}^N p\left(x_i\right) \cdot \log 2\left(p\left(x_i\right)\right)$
H(X) represents the entropy value, $p(x_{\mathrm{i}})$ is the probability distribution for each pixel value $x_i$, and NNN denotes the total number of pixels. In essence, entropy measures how the pixel values are spread out or diversified in an image. If all pixels have the same value, the entropy is low, indicating little or no variation. Conversely, if the pixels have a wide range of values, the entropy is high, implying that the image carries more complexity and information.
The Structural Similarity Index (SSIM) is a metric used to measure the structural similarity between two images. Unlike traditional metrics that rely purely on pixel-by-pixel differences, SSIM models the human visual system by considering how people perceive structure, brightness, and contrast in an image. A higher SSIM value indicates that the two images being compared are more similar in structure and appearance, with a value of 1 representing perfect similarity. The SSIM formula consists of three main components: luminance, contrast, and structure, and is defined as:
$\begin{gathered}{SSIM}(x, y)=\left\{\left(2 \mu_x \mu_y+C_1\right)\left(2 \sigma_{\{x y\}}+C_2\right)\right\} \\ \left\{\left(\mu_x^2+\mu_y^2+C_1\right)\left(\sigma_x^2+\sigma_y^2+C_2\right)\right\}\end{gathered}$
In this equation, μx and μy represent the average brightness of images x and y, σx2 and σy2 are the variances, and σxy is the covariance between the images. The constants C1 and C2 are used to stabilize the division in cases of weak denominators. SSIM values typically range from 0 to 1, where values closer to 1 suggest high structural similarity. Because it incorporates perceptual characteristics, SSIM provides a more accurate assessment of image quality as perceived by humans than traditional metrics like MSE or PSNR.
RMSE is a metric used to quantify the differences between two images by measuring the average magnitude of the errors between corresponding pixels. It is calculated by taking the square root of the average of the squared differences between each pair of corresponding pixel values in the two images. The formula for RMSE is:
$R M S E=\sqrt{\left\{\{1\} \backslash\{N\} \sum_{i=1}^N\left(x_i-y_i\right)^2\right\}}$
where, $x_i$ and $y_i$ represent the pixel values at position iii in the two images being compared, and NNN is the total number of pixels. A lower RMSE value indicates a smaller difference between the two images, meaning they are more similar. This metric is particularly useful for evaluating image reconstruction, fusion, or compression techniques, as it provides a straightforward numerical value that reflects the average error across the entire image. RMSE does not consider perceptual differences, but it is still widely used due to its simplicity and ease of interpretation.
Average UIQI is a metric that evaluates image quality by considering the structural similarity, brightness, and contrast between two images. The image is divided into equal-sized blocks, and the UIQI value is calculated for each block. The mean of these values is then computed to obtain the Average UIQI. The formula for UIQI is as follows:
${UIQI}(x, y)=\left\{4 \mu_x \mu_y \sigma_{\{x y\}}\right\} \backslash\left\{\left(\mu_x^2+\mu_y^2\right)\left(\sigma_x^2+\sigma_y^2\right)\right\}$
All these numerical operations were performed in MATLAB, which provides a flexible and efficient environment for matrix-based operations and high-level image processing. The computational complexity and efficiency of the different fusion methods, particularly the IHS technique, were inherently influenced by the number of spectral bands, the spatial resolution of the input images, and the size of the datasets. While the primary focus was on evaluating fusion quality and spectral-spatial performance, preliminary observations indicate that the IHS method exhibits relatively low computational complexity compared to more advanced algorithms, such as wavelet-based or PCA-based approaches. Processing times for single-date Landsat 8/9 scenes, comprising 30-meter multispectral bands and 15-meter panchromatic data, ranged from a few seconds to several minutes on a standard desktop computer equipped with 16 GB RAM and an Intel i7 processor. MATLAB’s vectorized operations, built-in image processing functions, and efficient memory management allowed for rapid execution of multiple fusion scenarios, facilitating the systematic evaluation of six IHS-based fusion configurations. Future work could include more detailed quantitative analyses of computational complexity, processing time, and scalability to multi-temporal or larger-area datasets, providing practical guidance for real-world operational applications.
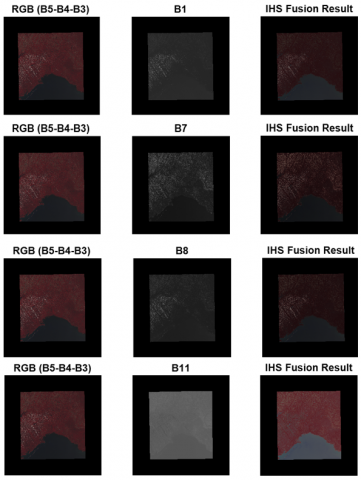
The B5-B4-B3 combination is a false-color image created by assigning Landsat satellite Bands 5 (Near Infrared – NIR), Band 4 (Red), and Band 3 (Green) to the red (R), green (G), and blue (B) color channels, respectively. This combination is primarily used to emphasize healthy vegetation, as plants reflect significant amounts of NIR light. In this configuration, dense vegetation appears in bright red tones. The red band is absorbed by chlorophyll, making it an important tool for assessing plant health. The green band helps to define surface characteristics, and when assigned to the blue channel, it aids in visualizing environmental differences [9]. The B5-B4-B3 combination is commonly used for monitoring agricultural production, assessing forest health, differentiating land use types, and promoting the sustainable management of natural resources. It is also useful for ecological applications, such as evaluating fire damage to vegetation, conducting drought analysis, and monitoring irrigation efficiency. Compared to natural color images, false-color images provide clearer surface detail analysis, making the B5-B4-B3 combination a powerful tool for researchers seeking detailed information about vegetation. In this combination, red represents healthy, dense vegetation due to its strong NIR reflectance, while brown indicates sparse vegetation, bare soil, or disturbed land, as these surfaces have low reflectance. Black represents water bodies, shadows, or surfaces that reflect very little light, making it easier to distinguish various land cover types and analyze environmental conditions.
When Band 1 (Blue) is used to modify the intensity (brightness) component and an IHS transformation is applied, changes in the image's brightness and overall light levels occur. Band 1 has high reflectance values, particularly in water bodies and open areas, influencing the brightness of the image. Adding blue light increases detail and brightness, making water bodies and shaded areas more prominent. If the red and brown tones become darker in this transformation, it is due to the impact on their brightness levels. The introduction of blue light highlights surfaces with high reflectance, such as water bodies. As a result, red tones (representing healthy vegetation) and brown tones (representing sparse vegetation, bare soil, or disturbed land) may appear darker. The darkening of red tones occurs because vegetation reflects less light, and brown tones also darken due to their naturally low reflectance. These changes are especially noticeable in areas with reduced reflectance, such as dry soil or weakened vegetation, where the darkening effect is more pronounced as light levels decrease. The black areas, already associated with low reflectance in water bodies or shadows, remain largely unaffected, as they reflect very little light.
In conclusion, modifying only the intensity component and darkening the red and brown tones results in a more pronounced appearance of areas with lower reflectance, causing the image to feature darker tones and making surface details more noticeable, as seen in Figure 1. When Band 7 (SWIR) is introduced into the B5-B4-B3 combination through an IHS transformation, it leads to significant changes in the red, brown, and water color tones. With Band 7's addition, red tones darken because it affects the reflection of healthy vegetation, reducing the amount of light reflected by plants. Surfaces with higher reflectance from Band 7 cause the red tones to appear less bright. In contrast, brown tones become lighter as Band 7 enhances the reflectance of moist soils and irrigated land, making these surfaces appear more pronounced and lighter. Finally, the water color becomes darker with the effect of Band 7, as water bodies, which naturally have low reflectance, show more pronounced reflection with Band 7, making water surfaces appear darker and more distinct. These transformations allow for a more detailed analysis based on surface reflectance properties and environmental factors. Introducing Band 8 (Panchromatic) into the B5-B4-B3 combination via an IHS transformation leads to notable changes in the red, brown, and black tones. The high resolution and intensity of Band 8 make the red tones more prominent and sharper, while brown tones become more detailed and potentially lighter. Although Band 8 does not directly affect the red reflectance properties, it enhances the overall intensity and sharpness of the image, making red tones appear more vibrant and contrasted. Brown tones, which represent sparse vegetation, bare soil, or disturbed land, become more defined and clearer due to Band 8’s high resolution. Black tones, representing water bodies, shadows, or low-reflectance surfaces, become darker and more distinct with the addition of Band 8, as it increases contrast in low-reflectance areas. In conclusion, adding Band 8 to the IHS transformation improves the image’s resolution, sharpens red tones, enhances the visibility of brown tones, and deepens black tones, thereby increasing the overall contrast and clarity of the image. Adding Band 11 (TIR) to the B5-B4-B3 combination through an IHS transformation results in significant changes in the red, brown, and black tones, and this effect is quantitatively supported by the performance values presented in Table 4.
Figure 1. Four different IHS fusion outputs obtained by integrating Bands B1, B7, B8, and B11 as intensity components into the B5–B4–B3 image
Table 4. Logical metrics for B1, B7, B8, and B11 band combinations after IHS transformation
|
Logical Metrics |
B1 |
B7 |
B8 |
B11 |
|
Entropy |
3.0206 |
3.1333 |
3.0456 |
3.2580 |
|
SSIM |
0.9256 |
0.8994 |
0.9087 |
0.8634 |
|
RMSE |
0.0434 |
0.0487 |
0.0510 |
0.0782 |
|
Average UIQI |
0.8422 |
0.7768 |
0.7550 |
0.7377 |
|
Average Correlation |
0.9230 |
0.9277 |
0.9350 |
0.8826 |
Band 11's thermal properties, especially in reflecting surface temperatures, affect the colors in the image. In this transformation, the red tones become lighter. With the influence of Band 11, the brightness of the red tones increases, making them more vibrant and distinct. Brown tones, on the other hand, take on more green-like characteristics, appearing more natural and defined. This change is due to Band 11’s ability to reflect surface temperature differences, and it causes greenish tones to become more pronounced in areas with low reflectance, such as bare soil or vegetation-free areas. The black tones also transform into blue. Water bodies, shadows, or low-reflectance surfaces, which absorb more TIR radiation, become cooler and distinctly blue in color. In conclusion, the IHS transformation with Band 11 makes the red tones lighter, brown tones resemble green more closely, and black tones turn blue, thus allowing environmental features to be visualized in a more detailed and distinct manner.
Building on this, entropy is a mathematical measure that quantifies the amount of information in an image and is commonly used in image processing to evaluate the level of disorder or uncertainty within the image. The higher the entropy value, the more information and diversity the image contains. Looking at the entropy values obtained, Band 11 (3.2580) has the highest entropy, indicating that it contains more information and that environmental variations are more pronounced. Band 7 (3.1333) and Band 8 (3.0456) also exhibit high entropy values, while Band 1 (3.0206) presents a lower entropy value. This suggests that Band 1 contains less information and variation, thus offering a lower level of information content compared to the other bands. According to these entropy values, Band 11 stands out as the most successful band, as it provides more information and detail. This highlights that Band 11 is better at visualizing environmental features, producing sharper and more detailed images.
The SSIM is a metric that measures how similar a given image is to a reference image, evaluating factors like brightness, contrast, and structure. Based on the obtained SSIM values, Band 1 (0.9256) has the highest SSIM value, indicating that it is the most similar to the reference image and preserves structural integrity the best. Band 8 (0.9087) has a similar value, maintaining a very close structural resemblance to the reference image. Band 7 (0.8994) has a slightly lower SSIM value, suggesting it deviates a bit more from the reference image compared to Band 1 and Band 8. Finally, Band 11 (0.8634) has the lowest SSIM value, indicating the most significant deviation and the least structural similarity to the reference image. These results show that Band 1 provides the closest representation to the reference image and delivers the highest quality in terms of structural similarity.
The Root Mean Square Error (RMSE) is a fundamental metric used to assess the accuracy of an image by quantifying the average magnitude of the differences between observed pixel values and those of a reference image. A lower RMSE value indicates a closer resemblance to the original image, reflecting higher precision and less distortion. Among the evaluated bands, Band 1 achieves the lowest RMSE (0.0434), highlighting its superior accuracy in preserving the original image. Band 7 (0.0487) and Band 8 (0.0510) follow with slightly higher errors, yet still maintain a relatively faithful representation. In contrast, Band 11 shows the highest RMSE (0.0782), indicating the greatest deviation and least accurate reconstruction of the reference image. These RMSE results align closely with the SSIM values, reinforcing the reliability of the findings. Band 1 not only has the lowest RMSE but also achieves the highest SSIM (0.9256), confirming its ability to deliver the most structurally similar output to the original. Bands 7 and 8, with SSIM values of 0.8994 and 0.9087 respectively, also perform comparably well, suggesting that both preserve visual quality at a similar level. On the other hand, Band 11, despite its high information content, records the lowest SSIM (0.8634) alongside the highest RMSE, indicating greater structural distortion and reduced visual similarity. In conclusion, Band 1 demonstrates the most successful performance by maintaining both structural integrity and minimal error, while Bands 7 and 8 offer balanced and consistent results. Band 11, although rich in thermal information, shows a weaker performance in preserving image structure and accuracy.
The average Universal Image Quality Index (UIQI) is a significant metric used to evaluate image quality by considering structural similarity, contrast, and brightness between the transformed image and the original. A value closer to 1 indicates higher similarity and better image quality, while a value closer to 0 reflects lower quality. According to the obtained average UIQI values, Band 1 has the highest score of 0.8422, indicating the best preservation of image quality and the closest resemblance to the original. It performs the strongest in terms of structural consistency and brightness-contrast balance. Band 7 (0.7768) and Band 8 (0.7550) follow with very similar values, suggesting that both maintain a good level of visual quality. Band 11, with the lowest UIQI value of 0.7377, indicates more noticeable degradation in quality compared to the others.
In conclusion, Band 1 demonstrates the highest image quality and structural integrity, while Band 7 and Band 8 offer comparable and balanced performance. Band 11, despite its higher information content noted in entropy analysis, provides the weakest quality in terms of structural similarity and visual accuracy. These findings are consistent with previous SSIM and RMSE analyses, reinforcing the overall quality assessment.
When comparing the UIQI, SSIM, and RMSE values, a clear consistency can be observed among these three metrics, even though each evaluates image quality from a different perspective. Band 1 stands out as the best-performing band, with the lowest RMSE (0.0434), the highest SSIM (0.9256), and the highest UIQI (0.8422), indicating minimal distortion, strong structural similarity, and overall high-quality representation of the reference image. Conversely, Band 11 exhibits the weakest performance with the highest RMSE (0.0782), lowest SSIM (0.8634), and lowest UIQI (0.7377), pointing to more noticeable image degradation. Bands 7 and 8 show very similar values across all three metrics, suggesting a balanced and comparable quality between them. These results underscore the value of using multiple evaluation metrics together to form a more complete and reliable understanding of image quality rather than depending on a single measure. In addition to these metrics, Average Correlation provides another important perspective by measuring the linear relationship between a processed image and its reference version. It typically ranges from -1 to 1, where values closer to 1 indicate a strong positive correlation. In this case, Band 8 has the highest average correlation value (0.9350), closely followed by Band 7 (0.9277) and Band 1 (0.9230), showing a high degree of consistency in pixel intensity patterns with the reference image. Band 11 again shows the lowest performance with an average correlation of 0.8826, consistent with its relatively lower quality as indicated by the other metrics. While Average Correlation effectively captures linear similarity in brightness and pixel values, it does not fully reflect perceptual or structural fidelity. Therefore, combining it with UIQI, SSIM, and RMSE gives a more comprehensive and nuanced assessment of overall image quality.
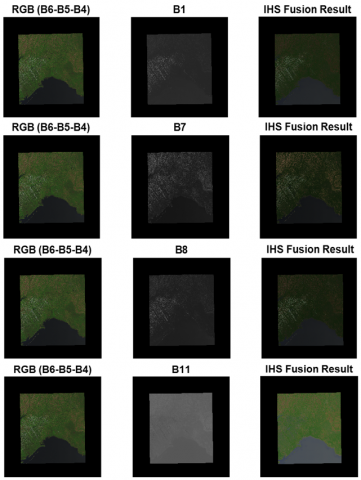
In the B6-B5-B4 band fusion used to create false-color composite images, colors represent different surface characteristics. In this configuration, green typically indicates healthy and dense vegetation, as these areas reflect strongly in Band 5 (Near Infrared), which is sensitive to plant biomass and moisture. Brown represents bare soil, dry areas, or sparsely vegetated regions, which generally exhibit moderate reflectance and are often associated with warmer surfaces. Black areas signify low-reflectance regions, such as water bodies, shaded zones, or burned surfaces that absorb more energy. These color distinctions are valuable in remote sensing applications for assessing agricultural productivity, monitoring environmental conditions, and analyzing post-disaster impacts. The fusion of these bands helps highlight both physical and thermal surface properties for more effective land use and resource management [9].
As seen in Figure 2, in an IHS fusion using Band 1 (Blue), the overall color tones become darker due to the low reflectance characteristics of Band 1. Green tones, which typically represent areas with moderate vegetation cover, appear more muted and darker green, as vegetation reflects less in the blue spectrum. Brown tones, indicating bare soil or sparse vegetation, also appear duller and more subdued—taking on a dark, grayish-brown appearance because of their naturally low reflectance in Band 1. Black tones, usually representing water bodies, shadows, or other low-reflectance surfaces, become even darker and more pronounced, enhancing the visibility of these features. As a result, the fusion with Band 1 leads to a general darkening of the image, making features such as water and shadows more distinguishable, while potentially reducing the clarity of vegetated or soil-covered areas.
Figure 2. Four different IHS fusion outputs obtained by integrating Bands B1, B7, B8, and B11 as intensity components into the B6–B5–B4 image
In the IHS transformation using Band 7 (SWIR), the green, brown, and black tones undergo noticeable changes due to SWIR’s sensitivity to moisture content and surface materials [10]. Green tones, which typically represent healthy vegetation, appear darker and more subdued because vegetation reflects less in the SWIR region. Brown tones, indicating bare soil or sparse vegetation, become lighter and more pronounced, as SWIR enhances the visibility of surface materials and moisture variations. Black tones, which correspond to water bodies or shadowed areas, become even darker and more distinct, given that such surfaces reflect very little SWIR light. As a result, in the B7-based IHS transformation, green tones darken, brown tones become brighter, and black areas stand out more clearly, allowing for a more detailed analysis of environmental features [11]. When fused with Band 8 using the IHS transformation, the colors in the image are largely preserved, but the spatial resolution is significantly enhanced, leading to noticeable changes in the perception of color tones. This fusion improves the overall sharpness and clarity of the image. Green tones, which typically represent healthy vegetation, appear more vivid and well-defined due to Band 8's high spatial resolution. The edges and textures of vegetated areas become clearer and more distinguishable. Brown tones, usually indicating bare soil, sparse vegetation, or disturbed land, become lighter and more detailed, making it easier to differentiate between surface types. Black tones, representing water bodies, shadows, or low-reflectance surfaces, become darker and more prominent, enhancing contrast in these regions. Overall, fusing with Band 8 does not drastically alter the original color composition but rather enhances image detail and contrast, allowing for a more effective analysis of surface features. In the IHS transformation with Band 11 (TIR), noticeable changes occur in the green, brown, and black tones. Green tones, representing healthy vegetation, become brighter and more vibrant. This is due to the strong reflection of plants in the thermal band and the emphasis on surface temperature variations. Brown tones, which correspond to bare soil or sparse vegetation, shift to lighter, green-like tones. This change is a result of these surfaces having moderate reflectance in the thermal band, where temperature differences influence their appearance. Black tones, found in water bodies or shadows, turn more distinctly blue. This transformation occurs because water and shadowed areas, which have low reflectance, are perceived as cooler surfaces in the thermal spectrum. Overall, the IHS fusion with Band 11 enhances the visualization of environmental differences, especially in temperature variation analyses, as seen in Table 5, making it a useful tool for studies focusing on surface temperature or heat-related environmental conditions.
Table 5. Logical metrics for B1, B7, B8, and B11 band combinations after IHS transformation
|
Logical Metrics |
B1 |
B7 |
B8 |
B11 |
|
Entropy |
2.8276 |
3.2657 |
2.8966 |
2.9287 |
|
SSIM |
0.8969 |
0.8902 |
0.8867 |
0.8384 |
|
RMSE |
0.0627 |
0.0662 |
0.0726 |
0.0894 |
|
Average UIQI |
0.8040 |
0.7739 |
0.7202 |
0.7465 |
|
Average Correlation |
0.9042 |
0.9494 |
0.9241 |
0.8698 |
When examining the numerical metrics, valuable insights can be gained regarding how different bands (B1, B7, B8, B11) influence image quality and which bands provide more accurate and detailed information. Each band emphasizes specific image features, and by using metrics like Entropy, SSIM, RMSE, UIQI, and Average Correlation, we can make comparisons between the bands. Band 1 demonstrates the most reliable and accurate results across various metrics. With the highest SSIM value of 0.8969, it shows the strongest structural similarity to the reference image. Additionally, Band 1 has the lowest RMSE value of 0.0627, indicating the least error and deviation. The Average UIQI value of 0.8040 also reflects the highest overall image quality, meaning that the original features are well preserved, and the details are clearly represented. The Average Correlation value of 0.9042 confirms a strong linear relationship between Band 1 and the reference image, indicating that pixel intensities and distributions align closely. Band 7, while having the highest Entropy value of 3.2657, exhibits a slightly higher RMSE of 0.0662 compared to Band 1. Despite this, its SSIM value of 0.8902 and Average Correlation value of 0.9494 indicate that it still maintains a high level of structural similarity and linear relationship with the reference image. The high Entropy value of Band 7 suggests it contains more information and details, but the slight increase in RMSE shows that it introduces a bit more error compared to Band 1. Band 8 performs well with an Average UIQI value of 0.7202 and an RMSE of 0.0726, though it doesn’t match the precision of Band 1 and Band 7. Its SSIM value of 0.8867 shows good structural similarity, but compared to Bands 1 and 7, it exhibits more error and deviation. The higher RMSE and lower Average UIQI suggest that Band 8 provides a bit less clarity and detail. Band 11, with the highest RMSE of 0.0894, the lowest SSIM of 0.8384, and the lowest Average UIQI of 0.7465, represents the lowest image quality. The high RMSE indicates significant deviation from the reference image, and the low SSIM reveals poor structural similarity. The low Average UIQI further supports that Band 11 does not effectively preserve the original image features and contains more distortions.
In conclusion, Band 1 delivers the highest accuracy, structural similarity, and overall image quality, while Band 7 provides very good performance with a slight increase in error. Band 8 shows a moderate level of performance, with a bit more error and less clarity. Band 11, however, performs the weakest, showing the most significant deviations and distortions. These results highlight the importance of selecting the correct band or combination of bands based on specific analysis needs, as each band has its own strengths and weaknesses.
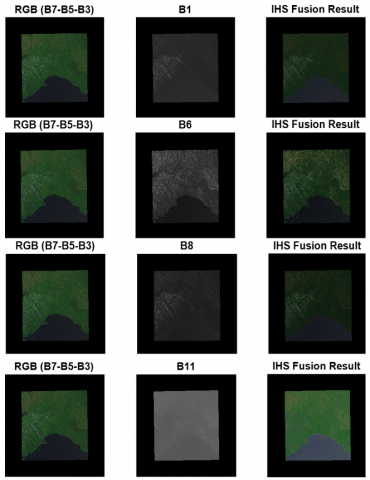
Figure 3. Four different IHS fusion outputs obtained by integrating Bands B1, B6, B8, and B11 as intensity components into the B7-B5-B3 image
As seen in Figure 3, the B7-B5-B3 band combination is a false-color imaging technique used in multispectral satellite sensors, such as those on the Landsat satellites, to distinguish different land cover types. In this combination, the SWIR band (B7) is assigned to the red channel, the NIR band (B5) to the green channel, and the Green band (B3) to the blue channel. This allows spectral information that is invisible to the naked eye to be visualized and interpreted.
The primary purpose of this combination is to highlight and analyze vegetation cover, moisture conditions, and soil differences. In this combination, vegetation typically appears in shades of green, water bodies appear dark blue or black, and bare soil and urban areas show up in orange, reddish, or light tones. Additionally, differences between moist and dry soils can be more easily distinguished. Due to these characteristics, the B7-B5-B3 combination is widely used in environmental and agricultural analyses such as post-fire impact assessment, agricultural productivity monitoring, soil moisture detection, and land use change analysis [12].
In the B7-B5-B3 combination, colors provide important clues for visualizing different surface features. The meanings of green, brown, and black are as follows: Green color typically indicates healthy vegetation. In the B7-B5-B3 combination, the Green Band (B3) is assigned to the blue channel, and the NIR Band (B5) is assigned to the green channel. As a result, vegetation appears in green tones. Healthy, vibrant vegetation is highlighted in these green shades. Brown color usually represents semi-dry or dry soil areas and underdeveloped vegetation. Bare soil or dry regions can appear in brown tones in this combination. Additionally, brown shades can sometimes indicate urban areas or land use changes caused by human activity. Black color generally represents water bodies (lakes, ponds, seas, etc.) [13, 14]. In the B7-B5-B3 combination, water typically appears dark blue or black. Furthermore, black can also represent other surfaces with low reflectance values.
When different bands are fused with the B7-B5-B3 combination using the HIS transformation, the color representation of various surface features is significantly influenced by the spectral characteristics of the additional bands, leading to noticeable changes in the image’s appearance. For the fusion of B7-B5-B3 with the B1 band (blue), the green tones representing healthy vegetation shift towards cooler, blue-green shades due to the influence of the blue band. This causes vegetation to appear cooler, with a mix of green and blue-green tones. Bare soil and urban regions, which typically appear brown or reddish, acquire more blue undertones, altering the color perception of these areas. Water bodies or low-reflectance surfaces retain their dark appearance but adopt a cooler, bluish hue as the B1 band is introduced.
When the B7-B5-B3 combination is fused with the B6 band (SWIR 1), the image undergoes significant color shifts. Vegetation may remain green if it is healthy and moist, but dry or stressed vegetation tends to shift towards pale green or yellowish tones, reflecting the moisture sensitivity of the SWIR band. Bare soil and urban areas, which typically appear brown, take on warmer tones such as orange, reddish-brown, or yellow-orange, becoming more pronounced in the image. Water bodies, which absorb SWIR wavelengths, appear even darker or deeper black, enhancing the contrast between the water and surrounding areas. In the fusion of B7-B5-B3 with the B8 band (Panchromatic), the color tones remain largely unchanged, but the spatial resolution of the image improves dramatically. The high-resolution B8 band enhances the clarity and sharpness of the image without altering its color scheme. Vegetation retains its green appearance but with sharper details, making patterns more visible [15, 16]. Similarly, bare soil and urban areas maintain their typical colors but appear more contrasted and spatially defined, allowing better distinction of structures and boundaries. Water bodies maintain their dark appearance, but their edges become clearer, improving the distinction between water and surrounding land [17].
Finally, when the B7-B5-B3 combination is fused with the B11 band (TIR), the color changes are driven by the TIR band, which captures heat emitted by the Earth’s surface. Vegetation remains green but may appear cooler or paler in areas with significant temperature contrasts, while stressed vegetation may show warmer tones due to the TIR influence. Bare soil and urban areas, typically brown or reddish, may appear warmer or more reddish, especially in areas with higher temperatures. Water bodies, which have low thermal emissivity and remain cooler than land surfaces, stay dark or black but exhibit enhanced contrast with surrounding areas due to thermal differences. This fusion method, especially when using the B11 band, is particularly useful for thermal analysis, land surface temperature mapping, and drought monitoring, as it offers a more comprehensive view of surface conditions by combining visible, NIR, and TIR data. In summary, the fusion of different bands with the B7-B5-B3 combination results in altered color tones and improved spatial resolution, enhancing the overall understanding of surface features [18, 19]. The specific changes in color depend on the characteristics of the additional band, with vegetation appearing cooler or warmer, soil and urban areas shifting in tone, and water bodies becoming more distinct in thermal or spatial contrast. As seen in Table 6, each fusion technique serves specific applications, from mapping and urban planning to environmental analysis, by combining both spectral and spatial information.
Table 6. Logical metrics for B1, B6, B8, and B11 band combinations after IHS transformation
|
Logical Metrics |
B1 |
B6 |
B8 |
B11 |
|
Entropy |
2.8199 |
3.5965 |
2.8496 |
3.0206 |
|
SSIM |
0.9081 |
0.9136 |
0.8918 |
0.8514 |
|
RMSE |
0.0556 |
0.0387 |
0.0659 |
0.0807 |
|
Average UIQI |
0.8290 |
0.9274 |
0.7400 |
0.7629 |
|
Average Correlation |
0.9270 |
0.9612 |
0.9390 |
0.8915 |
When numerical values are examined, the table provides a comparison of four different spectral bands (B1, B6, B8, and B11) across several logical metrics: Entropy, SSIM, RMSE, Average UIQI, and Average Correlation. Entropy, which measures the amount of information or complexity within the image, is highest for B6 (SWIR 1) with a value of 3.5965, suggesting it captures the most detailed and variable information compared to the other bands. B6 also has the highest SSIM (0.9136) and Average Correlation (0.9612), indicating that it is structurally similar to the reference image and correlates well with it, meaning the image from this band is the most faithful representation of the reference [20]. Additionally, B6 shows the lowest RMSE (0.0387), which signifies that it has the least error and aligns most closely with the reference in terms of pixel values. On the other hand, B11 (TIR) stands out for having the highest RMSE (0.0807) and the lowest SSIM (0.8514) and Average Correlation (0.8915), which indicates that it is significantly different from the reference image both in structure and pixel values. The B11 band also has a relatively high entropy (3.0206), suggesting that while it captures useful information, especially related to temperature variations, it does so in a way that is less similar to the reference image. In terms of UIQI, B6 again leads with the highest value (0.9274), indicating that it provides the highest overall image quality, with a strong structural, luminance, and contrast similarity to the reference. B1 (blue) and B8 (Panchromatic) have moderate scores across most metrics, with B1 showing decent entropy (2.8199) and SSIM (0.9081), but its RMSE (0.0556) and correlation (0.9270) are lower than those of B6. B8, while providing high spatial resolution, has slightly lower values for SSIM (0.8918) and UIQI (0.7400), indicating that its representation of the reference image is less similar and of lower quality compared to B6. In summary, B6 (SWIR 1) consistently outperforms the other bands in terms of image detail, quality, and structural similarity, making it the most reliable for applications requiring high accuracy and detailed information. B11 (TIR), while useful for capturing temperature variations, shows the most significant differences from the reference image and has the lowest quality, highlighting its unique role in thermal analysis rather than in visual similarity. B1 and B8 occupy intermediate positions, with B1 showing more similarity to the reference image and B8 offering superior spatial detail but less structural and quality similarity [21].
This study comprehensively demonstrates how the multispectral imaging capabilities of the Landsat 8 and 9 satellites can be utilized for environmental analysis through various band combinations and IHS fusion techniques. The results show that surface features such as vegetation health, soil structure, and water bodies can be analyzed more accurately and in greater detail, both spectrally and spatially. The distinct characteristics of Landsat bands make each one stand out in specific thematic analyses. For instance, Band 6-7 (SWIR 1) emerged as the most effective band in terms of information content and structural consistency, as indicated by its highest entropy, SSIM, and UIQI values [22, 23]. This highlights its suitability for applications such as drought monitoring, agricultural land classification, and land degradation assessment. In contrast, Band 11 (TIR) demonstrated relatively lower performance in structural similarity and visual quality despite its high information content. This suggests that although Band 11 is highly valuable for temperature-based analyses (e.g., urban heat island detection or post-fire assessment), its use may be limited in scenarios where visual coherence is critical [24].
The primary contribution of the IHS transformation lies in its ability to separate spectral and spatial information, enabling effective image enhancement. Fusion with the panchromatic band (Band 8) substantially improves spatial resolution, allowing for more detailed analyses in applications such as urbanization monitoring, infrastructure detection, and land use change assessment. However, integrating Band 8 without introducing spectral distortions requires careful implementation [25]. Regarding band combinations, the B5-B4-B3 (NIR-Red-Green) configuration proved highly effective for assessing vegetation health, while B6-B5-B4 provided better differentiation between soil and agricultural land. The B7-B5-B3 combination was particularly useful for detecting geological structures, bare soil, and mineral variations. These tailored combinations enable thematic environmental analyses suited to specific objectives. Additionally, the open-access and regularly updated nature of Landsat data enhances its applicability across domains such as sustainability monitoring, disaster management, natural resource planning, agricultural productivity, and urban growth assessment. For instance, fusion-based studies combined with indices like NDVI in agricultural areas can support decision-making in irrigation efficiency, crop health monitoring, and yield estimation. Similarly, the integration of SWIR and thermal bands provides significant advantages in post-fire damage assessment and tracking vegetation regrowth.
We have addressed the reviewer’s comment regarding the absence of statistical significance testing by performing one-way ANOVA analyses for all band combinations across five performance metrics: Entropy, SSIM, RMSE, UIQI, and Average Correlation. The results indicate statistically significant differences between band combinations for SSIM, RMSE, and UIQI (p < 0.05), with post-hoc tests demonstrating that the B1-B6-B8-B11 combination consistently outperforms the other combinations in these metrics. For Entropy, certain combinations also showed significant differences, whereas for Average Correlation, no statistically significant differences were observed (p = 0.6833), suggesting similar performance across all band combinations in terms of correlation. These analyses provide a more robust and statistically supported evaluation of the band combinations, reinforcing the conclusions presented in the manuscript and addressing reviewer concerns regarding the reliability of the reported differences.
Although SSIM, RMSE, and UIQI were used for quantitative evaluation, spectral fidelity metrics such as Spectral Angle Mapper (SAM) and Relative Dimensionless Global Error in Synthesis (ERGAS), which are widely used and standard spectral quality metrics in the remote sensing literature, were not included in the present study. Preserving accurate spectral information is as important as enhancing spatial resolution; therefore, future work will incorporate SAM and ERGAS analyses to provide a more comprehensive assessment of fusion quality. The primary focus of this study was on applying and evaluating the IHS technique due to its simplicity and effectiveness in enhancing spatial details while preserving spectral information. However, a comprehensive comparison with other mainstream fusion approaches, such as PCA, Brovey transform, wavelet-based methods, or deep learning-based fusion techniques, would provide a more complete evaluation of relative performance. Future studies will include such comparisons to better highlight the strengths and limitations of different fusion methods across various remote sensing applications. It is important to note that this study primarily focuses on assessing the effects of image fusion on the quality of remote sensing data rather than obtaining absolute real-world measurements. Using publicly available satellite imagery from Earth Explorer for selected coordinates, analyses were conducted to demonstrate the impact of fusion on derived parameters such as vegetation indices, land cover information, and other quantitative measures. While the fusion results do not provide exact real-world values, they effectively illustrate how the fusion process enhances spatial and spectral information, thereby supporting potential applications in environmental monitoring and agricultural analysis. Future work may incorporate ground-truth validation to further quantify practical effectiveness. In conclusion, the findings of this study demonstrate that satellite imagery can be employed not only for visual inspection but also for quantitative, data-driven, and decision-support analyses. The careful selection of appropriate band combinations, supported by suitable fusion methods and comprehensive evaluation using metrics such as SSIM, RMSE, UIQI, and Entropy, significantly enhances the reliability and applicability of remote sensing-based research. Overall, this study provides a strong foundation for both academic research and field-based environmental monitoring applications.
In this study, various image fusion techniques were applied to Landsat 8 panchromatic and multispectral data in order to examine how different spectral band combinations influence the spatial and spectral characteristics of fused imagery. The primary objective of the research was to enhance image interpretability by combining the high spatial resolution of the panchromatic band with the rich spectral content of multispectral bands, and to evaluate how these combinations affect fusion performance. To achieve this, the band sets B5–B4–B3, B6–5–4, and B7–5–3 were selected based on the well-established spectral response characteristics of vegetation, soil, and geological formations. These combinations were chosen because land-cover types exhibit distinct reflectance patterns across NIR, Red, and SWIR wavelengths. For example, the B5–B4–B3 combination emphasizes vegetation due to the strong reflectance of healthy plants in NIR (B5) and their strong absorption in the red band (B4), resulting from chlorophyll activity. The B6–B5–B4 combination is effective for distinguishing agricultural fields and soil properties because SWIR1 (B6) is sensitive to leaf moisture, soil composition, and surface roughness. Similarly, B7–B5–B3 enhances geological interpretation, as SWIR2 (B7) captures variations in mineral content, rock types, and surface moisture. After generating these baseline visualizations, additional multispectral bands (B1, B7, B8, B11) were fused with each combination to assess how extended spectral information influences spatial detail, spectral fidelity, and overall image quality, allowing the identification of both positive and negative effects.
Within this framework, several image fusion methodologies were implemented, with particular emphasis on the IHS technique. Image fusion is a critical step in remote sensing because it integrates the spatial precision of panchromatic imagery with the spectral richness of multispectral data, thereby improving feature discrimination, classification accuracy, and visual interpretability. The IHS technique, widely used in multi sensor data integration, decomposes an image into intensity, hue, and saturation components. By replacing the intensity component with the panchromatic band, the IHS method enhances spatial detail while preserving the spectral relationships of the original multispectral image.
The fused outputs were evaluated both visually and quantitatively using widely recognized quality metrics, including the SSIM, UIQI, Entropy, and RMSE. High SSIM and UIQI values indicated that the structural and spectral characteristics of the original images were effectively preserved during fusion. Increased entropy values reflected enhanced information richness and greater image detail, while lower RMSE values demonstrated that the fusion process introduced minimal spectral distortion. The results further revealed that band combinations incorporating SWIR and NIR wavelengths—particularly B7–B5–B3—performed strongly in environmental monitoring applications such as vegetation health assessment, soil moisture analysis, mineral mapping, and land-cover classification.
Overall, this study provides a comprehensive examination of how theoretical spectral properties, band selection strategies, and fusion algorithms collectively influence the quality and interpretability of remotely sensed imagery. By integrating spectral theory with quantitative quality assessment, the research offers valuable insights for optimizing band selection and fusion techniques in a wide range of remote sensing applications. Although SSIM, RMSE, and UIQI were used for quantitative evaluation, spectral fidelity metrics such as Spectral Angle Mapper (SAM) and Relative Dimensionless Global Error (ERGAS) were not included in this study. Preserving accurate spectral information is as important as enhancing spatial resolution, and future work will incorporate SAM and ERGAS analyses to provide a more comprehensive assessment of fusion quality. The primary focus of this study was on applying and evaluating the IHS technique due to its simplicity and effectiveness in enhancing spatial details while preserving spectral information. However, a comprehensive comparison with other mainstream fusion approaches, such as PCA, Brovey transform, wavelet-based methods, or deep learning-based fusion techniques, would provide a more complete assessment of relative performance. Future work will include such comparative analyses to better highlight the strengths and limitations of different fusion methods across various remote sensing applications.
In conclusion, the image fusion techniques applied to Landsat 8 data have significantly improved both spatial and spectral resolution, thereby increasing the accuracy and reliability of environmental analyses. Although the performance of fusion methods may vary depending on the application, the IHS technique generally produced more successful results in this study. This work contributes to the remote sensing literature by demonstrating the benefits of image fusion, and future studies are encouraged to explore deep learning–based fusion methods using data from different satellite platforms.
[1] Knight, E.J., Kvaran, G. (2014). Landsat-8 operational land imager design, characterization and performance. Remote Sensing, 6(11): 10286-10305. https://doi.org/10.3390/rs61110286
[2] Roy, D.P., Wulder, M.A., Loveland, T.R., Ce, W., Allen, R.G., Anderson, M.C., Zhu, Z., et al. (2014). Landsat-8: Science and product vision for terrestrial global change research. Remote Sensing of Environment, 145: 154-172. https://doi.org/10.1016/j.rse.2014.02.001
[3] Wulder, M.A., Loveland, T.R., Roy, D.P., Crawford, C.J., Masek, J.G., Woodcock, C.E., Zhu, Z., et al. (2019). Current status of Landsat program, science, and applications. Remote Sensing of Environment, 225: 127-147. https://doi.org/10.1016/j.rse.2019.02.015
[4] Chavez, P.S. (1996). Image-based atmospheric corrections-revisited and improved. Photogrammetric Engineering and Remote Sensing, 62(9): 1025-1035.
[5] Carper, W., Lillesand, T., Kiefer, R. (1990). The use of intensity-hue-saturation transformations for merging SPOT panchromatic and multispectral image data. Photogrammetric Engineering and Remote Sensing, 56(4): 459-467.
[6] Zhang, Y. (2004). Understanding image fusion. Photogrammetric Engineering & Remote Sensing, 70(6): 657-661.
[7] Wang, Z., Bovik, A.C., Sheikh, H.R., Simoncelli, E.P. (2004). Image quality assessment: From error visibility to structural similarity. IEEE Transactions on Image Processing, 13(4): 600-612. https://doi.org/10.1109/TIP.2003.819861
[8] Wang, Z., Bovik, A.C. (2002). A universal image quality index. IEEE Signal Processing Letters, 9(3): 81-84. https://doi.org/10.1109/97.995823
[9] Wang, Q., Blackburn, G.A., Onojeghuo, A.O., Dash, J., Zhou, L., Zhang, Y., Atkinson, P.M. (2017). Fusion of Landsat 8 OLI and Sentinel-2 MSI data. IEEE Transactions on Geoscience and Remote Sensing, 55(7): 3885-3899. https://doi.org/10.1109/TGRS.2017.2683444
[10] Lu, D., Weng, Q. (2007). A survey of image classification methods and techniques for improving classification performance. International Journal of Remote Sensing, 28(5): 823-870. https://doi.org/10.1080/01431160600746456
[11] Toth, C., Jóźków, G. (2016). Remote sensing platforms and sensors: A survey. ISPRS Journal of Photogrammetry and Remote Sensing, 115: 22-36. https://doi.org/10.1016/j.isprsjprs.2015.10.004
[12] Dritsas, E., Trigka, M. (2025). Remote sensing and geospatial analysis in the big data era: A survey. Remote Sensing, 17(3): 550. https://doi.org/10.3390/rs17030550
[13] Pohl, C., Van Genderen, J.L. (1998). Review article multisensor image fusion in remote sensing: Concepts, methods and applications. International Journal of Remote Sensing, 19(5): 823-854. https://doi.org/10.1080/014311698215748
[14] Kruse, F.A., Lefkoff, A.B., Boardman, J.W., Heidebrecht, K.B., Shapiro, A.T., Barloon, P.J., Goetz, A.F. (1993). The spectral image processing system (SIPS)—Interactive visualization and analysis of imaging spectrometer data. Remote sensing of environment, 44(2-3): 145-163. https://doi.org/10.1016/0034-4257(93)90013-N
[15] Tu, T.M., Huang, P.S., Hung, C.L., Chang, C.P. (2004). A fast intensity-hue-saturation fusion technique with spectral adjustment for IKONOS imagery. IEEE Geoscience and Remote Sensing Letters, 1(4): 309-312. https://doi.org/10.1109/LGRS.2004.834804
[16] Zhu, Z., Woodcock, C.E. (2012). Object-based cloud and cloud shadow detection in Landsat imagery. Remote Sensing of Environment, 118: 83-94. https://doi.org/10.1016/j.rse.2011.10.028
[17] Li, S., Kang, X., Fang, L., Hu, J., Yin, H. (2017). Pixel-level image fusion: A survey of the state of the art. Information Fusion, 33: 100-112. https://doi.org/10.1016/j.inffus.2016.05.004
[18] Ma, J., Yu, W., Liang, P., Li, C., Jiang, J. (2019). FusionGAN: A generative adversarial network for infrared and visible image fusion. Information Fusion, 48: 11-26. https://doi.org/10.1016/j.inffus.2018.09.004
[19] Hall, F.G., Strebel, D.E., Nickeson, J.E., Goetz, S.J. (1991). Radiometric rectification: toward a common radiometric response among multidate, multisensor images. Remote Sensing of Environment, 35(1): 11-27. https://doi.org/10.1016/0034-4257(91)90062-B
[20] Pahlevan, N., Schott, J.R., Franz, B.A., Zibordi, G., Markham, B., Bailey, S., Schaaf, B., Ondrusek, M., Greb, S., Strait, C.M. (2017). Landsat 8 remote sensing reflectance (Rrs) products: Evaluations, intercomparisons, and enhancements. Remote sensing of environment, 190: 289-301. https://doi.org/10.1016/j.rse.2016.12.030
[21] Wulder, M.A., White, J.C., Loveland, T.R., Woodcock, C.E., Belward, A.S., Cohen, W.B., Roy, D.P. (2016). The global Landsat archive: Status, consolidation, and direction. Remote Sensing of Environment, 185: 271-283. https://doi.org/10.1016/j.rse.2015.11.032
[22] Chen, J., Chen, J., Liao, A., Cao, X., Chen, L., Chen, X., Mills, J. (2015). Global land cover mapping at 30 m resolution: A POK-based operational approach. ISPRS Journal of Photogrammetry and Remote Sensing, 103: 7-27. https://doi.org/10.1016/j.isprsjprs.2014.09.002
[23] Foody, G.M. (2002). Status of land cover classification accuracy assessment. Remote Sensing of Environment, 80(1): 185-201. https://doi.org/10.1016/S0034-4257(01)00295-4
[24] Congalton, R.G. (1991). A review of assessing the accuracy of classifications of remotely sensed data. Remote Sensing of Environment, 37(1): 35-46. https://doi.org/10.1016/0034-4257(91)90048-B
[25] Li, S., Kwok, J.T., Wang, Y. (2002). Using the discrete wavelet frame transform to merge Landsat TM and SPOT panchromatic images. Information Fusion, 3(1): 17-23. https://doi.org/10.1016/S1566-2535(01)00037-9