Ade Chandra Nugraha*![]() | Suhono H. Supangkat
| Suhono H. Supangkat![]() | I Gusti Bagus Baskara Nugraha
| I Gusti Bagus Baskara Nugraha![]() | Yunendar Aryo Handoko
| Yunendar Aryo Handoko![]()
© 2025 The authors. This article is published by IIETA and is licensed under the CC BY 4.0 license (http://creativecommons.org/licenses/by/4.0/).
OPEN ACCESS
Addressing the critical need for efficient railway track irregularity detection in Indonesia, this article presents a novel data-driven approach for continuous track condition monitoring. By leveraging on-board accelerometer measurements from in-service trains, rigorously validated against traditional Track Recording Vehicle (TRV) data, this work offers a significant advancement over conventional periodic inspections. The methodology uniquely utilizes vibration data from both sides of the train body, enabling precise identification and classification of various track irregularities. Among several evaluated machine learning algorithms, a hyperparameter-tuned Random Forest model demonstrated superior performance, achieving an accuracy of 96.62% and a macro F1-Score of 47.77%. While achieving an overall classification accuracy of 96.62%, the macro F1-Score of 47.77% highlights the challenges posed by the inherent class imbalance in track defect data, where the model performs well at identifying normal track conditions but struggles to detect rare yet critical anomaly classes. Crucially, its high recall for critical irregularities, such as Twist over 3m (40.75%) and Track Gauge (46.10%), is paramount for safety-critical railway applications, effectively minimizing dangerous false negatives and ensuring comprehensive detection of potential hazards. This research highlights the significant potential of integrating on-board accelerometer data with advanced machine learning to enable proactive, cost-effective railway asset management, thereby enhancing operational safety and efficiency.
track irregularity, accelerometer, machine learning, random forest, macro F1-Score, recall
Railway infrastructure is the backbone of modern transportation, enabling the mass movement of goods and passengers on a national scale [1]. The integrity of this network hinges on the quality and condition of its tracks, which are fundamental to operational safety, passenger comfort, and service reliability [2]. At the heart of track quality lies track geometry—the precise spatial configuration of the rails, including parameters like track gauge, alignment, and vertical profile [3]. While the ideal is a perfectly consistent track, real-world conditions such as heavy traffic loads, environmental factors, and infrastructure aging inevitably lead to geometric deviations [4]. These flaws, known as track irregularities, represent critical departures from the track's intended design and position [5].
Track irregularities manifest in three critical dimensions: vertical (longitudinal level), horizontal (alignment), and rotational (twist) [6]. Though often invisible to the naked eye, these geometric faults have a profound impact on train dynamics. The unsmooth wheel-rail interaction they cause can lead to excessive vibrations, premature stress on components, and uneven wear [7]. Most critically, in extreme cases, these irregularities can directly trigger train derailments—the most catastrophic failure in railway operations—resulting in substantial material losses and potential casualties [8].
Nowhere is this challenge more pressing than in Indonesia, where increasing railway traffic and operational speeds demand unprecedented levels of track quality [9]. Research indicates that even minor irregularities, those with amplitudes as small as 0.08 mm, can accelerate the overall deterioration of track geometry [4]. This makes early and accurate detection critically important, not just for diagnosing existing problems but for enabling predictive maintenance strategies [10]. However, traditional inspection methods in Indonesia, which rely on periodic TRV measurements, lack the frequency needed for such early detection, making it challenging to prioritize maintenance and allocate resources effectively [11]. This article addresses this critical gap by proposing and validating a novel monitoring approach. We demonstrate how accelerometer data from regular in-service trains can be used to detect track irregularities more frequently and cost-effectively, with performance validated against official TRV measurements.
Several fundamental reasons underscore the urgency of measuring track irregularity in modern railway infrastructure management. First and foremost is operational safety. Track irregularities directly affect the stability and safety of train operations [12]. Significant geometric deviations can cause excessive lateral and vertical oscillations in trains, increasing the risk of derailment, especially at high speeds [7]. For instance, extreme twists can cause train wheels to lose contact with the rails, while severe longitudinal level and alignment issues can trigger dynamic forces exceeding component design limits [13]. By identifying and correcting these irregularities, the potential for accidents can be minimized, protecting the lives of passengers and crew and preventing costly property damage.
Secondly, measuring track irregularity improves passenger comfort. A smooth and stable ride is an indicator of railway service quality [14]. Track irregularities, even at levels that do not endanger safety, can cause vibrations and noise that disturb passenger comfort [5]. Accurate measurements allow operators to maintain ride quality within acceptable limits, thereby enhancing passenger satisfaction.
Thirdly, tracking irregularity measurement is vital for operational efficiency and cost-effective maintenance. By precisely knowing the location and severity of irregularities, track managers can plan proactive and targeted maintenance interventions [15]. Reactive maintenance, performed after irregularities or incidents occur, tends to be more expensive and disruptive to operational schedules. Conversely, predictive maintenance based on irregularity measurement data allows repairs to be carried out before problems become critical, thus reducing emergency repair costs, extending the lifespan of rail components, and minimizing service disruptions [16]. Furthermore, good track conditions enable trains to operate at their design speeds without restrictions, which increases the overall capacity and efficiency of the network [17].
Fourthly, track irregularity measurement data forms an essential basis for strategic decision-making regarding infrastructure investment [18]. By analyzing irregularity trends over time, operators can identify track segments prone to degradation, evaluate the effectiveness of existing maintenance programs, and plan future rehabilitation or upgrade projects. This ensures that investments are made in areas most in need, maximizing the value of every expenditure [19].
The development of modern technology has opened new opportunities in rail condition monitoring. Most railway operators now use Track Geometry Measurement Systems (TGMS) to measure track geometry automatically [20]. However, traditional approaches relying on periodic measurements using specialized vehicles like TRVs have limitations in terms of measurement frequency and operational costs [21]. Therefore, recent research has begun to explore the use of on-board accelerometer sensors on regularly operating trains as a more efficient and sustainable alternative [5]. Overall, track irregularity measurement is not merely a technical routine but an essential practice that supports the main pillars of railway operations: safety, comfort, efficiency, and sustainability [1]. It is an investment in the long-term integrity and performance of the entire railway system, becoming increasingly important as demands for safe, comfortable, and reliable transportation services rise.
The growing demand for train-based land transportation in Indonesia is driven by the absence of traffic congestion, which results in more predictable travel times. To continuously enhance the trust and comfort of train users, monitoring and maintaining railway track conditions are essential. Currently, rail maintenance in Indonesia predominantly employs time-based maintenance, involving daily inspections by track inspectors (Juru Pemeriksa Jalan rel - JPJ) who walk 4-6 km before the first train traverses the inspected segment. This approach requires significant effort, a large workforce, and is relatively time-consuming. In addition to daily routine inspections, rail condition checks are also performed using TRVs every three months. The use of TRVs to monitor rail conditions yields a set of Track Quality Index (TQI) values that serve as a reference for determining optimal speeds on specific track segments. TQI is calculated by assessing four track geometry parameters: superelevation, alignment, gradient, and curvature. TRV measurement results are recorded through a set of relevant sensors that also log the TRV's speed.
Globally, the railway industry is experiencing a transformative shift from classical time-based maintenance schedules toward data-driven predictive maintenance (PdM) strategies. A systematic review by Bianchi et al. [1] affirms that the growth in number and performance of Structural Health Monitoring (SHM) tools and innovative data-driven models, particularly those based on AI, is rapidly rendering classical approaches obsolete. International trends demonstrate increasing adoption of Wireless Sensor Networks (WSN) and AI models for collecting and processing real-time data from various infrastructure components. This integrated approach enables comprehensive track failure prediction and more effective resource management. By positioning our research within this global context, we aim to bridge the gap between current monitoring practices in Indonesia and cutting-edge technological advances adopted internationally.
To address the specific challenges of Indonesian railway infrastructure monitoring, this study develops and validates a novel methodology that integrates on-board accelerometer data with machine learning. The following section details our approach to continuous track condition monitoring and irregularity detection.
This research introduces an alternative approach to identifying track irregularities by correlating Track Recording Vehicle (TRV) measurements with vibration metrics collected from accelerometers on in-service trains. The analyzed track geometry parameters include vertical irregularity, horizontal alignment, cross-level, twist (over 3m), and track gauge. By integrating data from both sources, this study aims to improve the detection and mapping of irregularities along selected track segments.
Low-cost tri-axial accelerometers are installed on the bodies of operational trains traversing specific track sections within DAOP 2 Bandung (Daerah Operasi/Operational Area 2, Bandung) to measure vibration metrics. Sensor placement on the train body enables the capture of dynamic responses resulting from interactions between the wheels and the track. On-board monitoring reduces installation risk versus under-car mounting and lowers exposure to debris or harsh environments, thereby improving sensor longevity. This approach significantly enhances ease and safety of installation, as sensors can be placed in accessible, protected locations within or on the train body structure, minimizing the need for complex, high-risk technical interventions under the train or near the wheels. Furthermore, the risk of irregularity sensor from direct contact with track elements, debris, or extreme environmental conditions (such as water, mud, or undamped excessive vibrations) is drastically minimized, ensuring the integrity and longevity of the devices. From an environmental impact perspective, mounting the sensor on the train body also reduces direct exposure to extreme temperature variations, high humidity, and other contaminants common under the train, thereby maintaining the accuracy and reliability of the collected data. Recent research supports the effectiveness of this method, as demonstrated by a 2024 study that successfully estimated track irregularities from train body vibrations [22], and a 2025 study that integrated accelerometers with machine learning for track gauge detection, emphasizing the reliability of models combined with on-board accelerometer data [23]. The use of accelerometers in on-board monitoring not only optimizes the monitoring process but also aligns with modern trends in data-driven predictive maintenance for railway infrastructure. These sensors provide detailed acceleration data in the vertical, lateral, and longitudinal directions, which is crucial for identifying irregularities. The accelerometer data is recorded on the same day and at the exact locations as the TRV measurements, with time-stamp synchronization to ensure accurate alignment between the datasets. Vibration measurements using accelerometers on the train body are also equipped with a GPS sensor to record the train's position. While GPS provides essential location information, its inherent inaccuracies can make it difficult to synchronize accelerometer measurements with the actual track location precisely, necessitating the use of additional correction or validation methods.
The decision to install accelerometers on both left and right sides of the train body represents a fundamental aspect of our methodology, designed to capture directional vibration differences essential for comprehensive track irregularity diagnosis. This bilateral configuration enables simultaneous comparative analysis of the train's dynamic response under left- and right-rail conditions. As supported by previous research [24, 25], this configuration is critical for identifying geometric irregularities such as cross-level (elevation difference between two rails) and twist (change in cross-level over a specified distance). By analyzing phase and amplitude differences between left and right accelerometer signals, our model can effectively distinguish between pure vertical motion and rolling or lateral motion, which are key indicators of safety-critical track defect types.
A data-driven approach is employed to process and analyze the measurement results. Machine learning models are used to detect anomalies in track geometry, map irregularities to their corresponding track locations, and categorize them based on severity and type. The analysis leverages both spatial and temporal correlations between the TRV and accelerometer datasets to build a robust predictive framework for track condition monitoring. By analyzing the train body’s dynamic response to track irregularities, this methodology enables the development of predictive models to identify potential issues and prioritize maintenance actions. The approach provides an efficient and scalable solution for continuous track monitoring, ultimately enhancing railway safety and maintenance strategies.
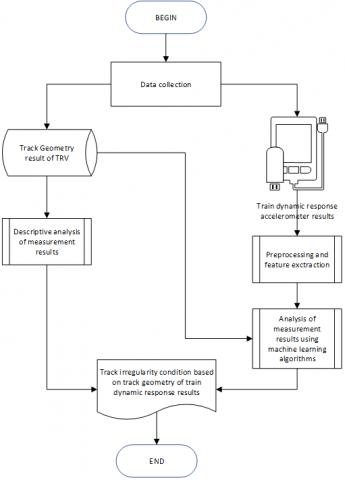
The procedural workflow of this research is illustrated in Figure 1, which shows the complete process from data collection through TRV and accelerometer measurements, preprocessing and feature extraction, machine learning model development, to final track irregularity classification and validation.
Figure 1. Track irregularity identification using a data-driven approach
The proposed monitoring approach emphasizes analyzing trains’ dynamic responses as they traverse track irregularities caused by geometric abnormalities. Accelerometers installed on regular passenger trains capture acceleration data reflecting the train’s interaction with the track geometry. This data is then compared with TRV (EM120 measuring train) measurements collected on the same railway segments. Machine learning techniques correlate findings from the two methods, identifying specific track anomalies. Detailed methodologies, including sensor placement, data collection, and model development, are elaborated further in subsequent sections of the paper.
TRV measurements are conducted continuously along specific track segments. The data from these measurements serve as the 'ground truth' or validation data for newer methods, as indicated in studies [22, 26], which use actual measurement data to validate irregularity estimation models. The four track geometry parameters modeled for irregularity estimation are:
$\mathrm{S}=\mathrm{g} \times \sin \theta$ (1)
where, S is the superelevation (cant), g is the distance between the railheads, and $\theta$ is the angle of the track's horizontal curve.
The value for each track geometry parameter is displayed in millimeters. The accumulation of the standard deviations of the measured geometry parameters yields the TQI value, as per the following formula:
$\begin{gathered}T Q I=\sum(\text {Std Dev of geometry parameter})\times T Q I \text { multiplier}\end{gathered}$ (2)
The TQI value determines the comfort and safety of the train journey, making it a reference for setting speed limits on measured track segments. Currently, the speed reference for track segments in Indonesia based on TQI values is shown in Table 1.
Table 1. Track condition categories based on TQI [27]
|
Total TQI |
Speed (km/h) |
|
< 20 |
100 – 200 |
|
20 -35 |
80 – 100 |
|
35 – 50 |
60 – 80 |
|
> 50 |
< 60 |
The results of track condition monitoring, whether by JPJ or TRV, produce a record of the track's state, which guides necessary maintenance actions. If track irregularity is indicated, a repair plan is formulated, including the schedule, repair type, supporting equipment, and cost. TRV measurement data is stored in a specific format prepared by the TRV. The railway operator in Indonesia uses the measurement results in two report formats: 'Track Quality by device' and 'exception report'. The data structures for these two reports are summarized in Tables 2 and 3.
Table 2. Data format for track quality by device
|
No. |
Field |
Data Type |
|
1 |
Track Identity |
String |
|
2 |
Segment Code |
Char [7] |
|
3 |
Speed |
Integer |
|
4 |
Class ID |
Integer |
|
5 |
Measurement Date |
Date |
|
6 |
Start position (km) |
Integer |
|
7 |
Start position (m) |
Integer |
|
8 |
End position (km) |
Integer |
|
9 |
End position (m) |
Integer |
|
10 |
Device type |
Char [4] |
|
11 |
Length (m) |
Integer |
|
12 |
Class |
Integer |
|
13 |
Cant (mm) |
Real |
|
14 |
Longitudinal Level (mm) |
Real |
|
15 |
Alignment (mm) |
Real |
|
16 |
Track Gauge (mm) |
Real |
|
17 |
Total TQI |
Real |
Table 3. Data format for exception report
|
No. |
Field |
Data Type |
|
1 |
Track Identity |
String |
|
2 |
Segment Code |
Char [7] |
|
3 |
Speed |
Integer |
|
4 |
Class ID |
Integer |
|
5 |
Measurement Date |
Date |
|
6 |
Start position (km) |
Integer |
|
7 |
Start position (m) |
Integer |
|
8 |
End position (km) |
Integer |
|
9 |
End position (m) |
Integer |
|
10 |
Measurement Distance (m) |
Integer |
|
11 |
Parameter (irregularity) |
String |
|
12 |
Irregularity Length(mm) |
Integer |
|
13 |
Max Location (km) |
Integer |
|
14 |
Max Location (m) |
Integer |
|
15 |
Rail Class |
Integer |
The track irregularity identified in the exception report is limited to track geometry parameters, which consist of:
Track condition measurement data were collected from eight quarterly measurements, spanning from early 2020 to the end of 2022, using a TRV on the track between Bandung and Cikampek stations (BD – CKP). The TRV's speed was 100 km/h over a distance of 71 km, from km 84+007 to km 155+134. The irregularity value thresholds set in Indonesian rail maintenance regulations, according to Kurniawan and Rulhendri [27], are described in Table 4.
Table 4. Irregularity value thresholds per category
|
Parameter |
New |
Cat 1 |
Cat 2 |
Cat 3 |
Cat 4 |
|
Longitudinal Level (mm) |
1 |
2 |
5 |
8 |
>8 |
|
Alignment (mm) |
1 |
1.5 |
4 |
10 |
>10 |
|
Cant (mm) |
1 |
2 |
6 |
9 |
>9 |
|
Track Gauge (mm) |
0 |
2 |
5 |
10 |
>10 |
|
Twist over 3 m (mm) |
2 |
6.5 |
9 |
12 |
>12 |
|
TQI (max) |
10 |
20 |
35 |
50 |
>50 |
|
Gapeka speed(km/h) |
|
120-100 |
100-80 |
80-60 |
< 60 |
According to Alamsyah [28], irregularity values exceeding the tolerance range fall into Category 3 and Category 4. This is used to determine the irregularity parameters in the Exception Report that require maintenance intervention.
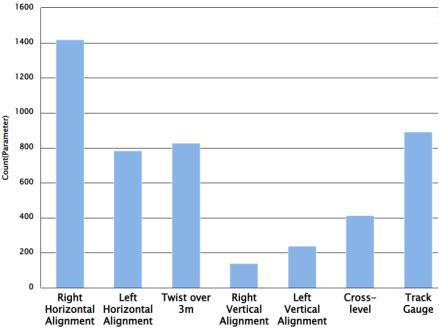
Based on the irregularity parameter measurement data and exception reports, the data in this article show a defect percentage below 7%, with the profile depicted in Figure 2.
Figure 2. Percentage of track irregularities in the data
Figure 2 illustrates the distribution of track irregularities across the eight measurement periods, revealing that 93.79% of the TRV measurement data indicates normal track conditions within standard thresholds. Among the irregularity categories, Right Horizontal Alignment (1.87%) and Left Horizontal Alignment (1.03%) have the highest occurrences, while Right Vertical Alignment (0.19%) has the lowest. This distribution pattern is characteristic of well-maintained railway infrastructure, where major defects are relatively rare but require immediate attention when detected.
The predominance of regular conditions, while positive from a safety perspective, presents a significant challenge for machine learning classification due to severe class imbalance, necessitating careful selection of evaluation metrics and potentially requiring specialized techniques such as class weighting or synthetic minority oversampling.
3.1 Data-driven approach with on-board accelerometers
Considering that the current track condition measurement process in Indonesia is conducted every three months using a TRV, this research aims to find an alternative monitoring mechanism that can be performed more intensively with more optimal use of human resources, time, and monitoring costs [5]. Kurniawan and Rulhendri [27] state that vibrations felt during a train journey can be caused by defects in the rail structure or by non-compliance with the ideal track geometry conditions set when the track was built. Similarly, De Rosa et al. [29] describe a machine learning classification model for predicting lateral and cross-level track geometry irregularities using accelerometers installed on in-service passenger trains. Considering several relevant studies [30-32], the explored alternative for track monitoring is to map the vibration measurement data from accelerometers installed on the body of an in-service passenger train with the TRV measurement results at relatively the same time and position. The TRV measurement values, which specifically identify track irregularities based on rail geometry, will serve as a reference for mapping the measured vibrations.
Recent research has investigated the use of in-service trains as a viable method for measuring geometry-based rail abnormalities [33]. According to Tsunashima [34], installing on-board sensors on in-service trains generates real-time data during routine operations, thereby eliminating the need for specialized inspection trains (TRVs). This method has proven effective in detecting minor anomalies that might otherwise go unnoticed, making it a cost-effective solution for continuous monitoring—for example, Weston et al. [31] found that equipping in-service trains with modern measurement instruments enabled consistent, precise assessment of track geometry over time. The study concluded that monitoring track conditions with in-service trains can significantly reduce operational expenses while enhancing safety and maintenance efficiency.
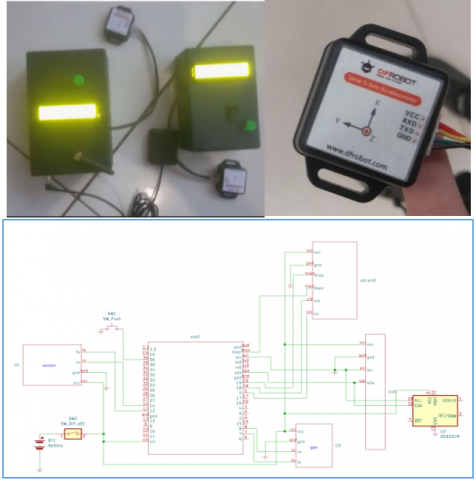
Given various factors related to accelerometer placement, this study chose the train body for installation. The accelerometer used is the DFRobot SEN0386, which offers high accuracy and provides a 6-axis gyroscope value. This module is equipped with advanced Kalman filtering, effectively reducing measurement noise and improving accuracy. A 5th-order Butterworth high-pass filter with a cutoff frequency of 0.5 Hz was applied to the accelerometer data. This cutoff frequency was selected using the carriage-passing frequency approach, in which the cutoff is set at approximately one-half to one-third of the carriage-passing frequency. For typical train speeds of 80-120 km/h and carriage lengths of 20-25 m, the carriage passing frequency ranges from 0.9 to 1.7 Hz, making 0.5 Hz an appropriate lower bound that preserves track geometry-related vibrations (0.5-20 Hz) while removing DC offset and ultra-low-frequency drift. The fifth-order design provides a sharp transition between the stopband and passband, effectively removing gravitational bias while maintaining signal integrity in the frequency range of interest. It generates acceleration data in 3 axes (Ax, Ay, Az) and is mounted on the left and right sides of the train body. The accelerometers monitor three acceleration channels (in g units) and three rotation channels for each carriage. Time and GPS sensors are also installed to obtain current position data. The output specifications of this accelerometer are:
These sensors provide acceleration data for each of the six DOFs in the car body. The measured train acceleration on each side is divided into three axes: the X-axis represents the direction of train movement, the Y-axis represents the lateral direction, and the Z-axis represents vertical vibration. Due to gravity, a low-frequency signal component causes the acceleration to shift upward on the z-axis by approximately 9.8 m/s². To eliminate this effect, a high-pass filtering procedure is used.
The measurement media in this research consist of accelerometer sensors, positioning sensors, and storage for the measurement results. Figure 3 shows an image of this measurement media.
Figure 3. Measurement media with DFRobot accelerometer
The measurement results are stored on a memory card, with the file structure is summarized in Table 5.
Table 5. Data storage format for accelerometer results
|
No. |
Field |
Data Type |
|
1 |
Measurement Date |
Date |
|
2 |
Time |
Time |
|
3 |
Longitude |
Real |
|
4 |
Latitude |
Real |
|
5 |
Speed |
Real |
|
6 |
Left Ax |
Real |
|
7 |
Left Ay |
Real |
|
8 |
Left Az |
Real |
|
9 |
Right Ax |
Real |
|
10 |
Right Ay |
Real |
|
11 |
Right Az |
Real |
3.2 Machine learning for irregularity classification
In line with the research objectives, the next step is to apply a data-driven approach to map the accelerometer measurement results from the in-service train with the exception report from the TRV measurements. The process involves the following steps:
Following this process, a dataset of 75,990 records was obtained, comprising eight features: velocity, acceleration in three axes (from the accelerometer) on both sides of the in-service train, and the type of track irregularity parameter from the TRV measurements.
The track irregularity parameter is divided into eight labels for classification (1 normal/regular condition and seven irregularity conditions). The other seven features are continuous (numeric).
Figure 4 shows the distribution of data across the 7 track irregularity classes, with the 'regular' class comprising 71,272 records (93.79% of the total). This study examines the effectiveness of various machine learning classification algorithms in identifying railway track irregularities using accelerometer data from an in-service train. Unlike conventional approaches that rely solely on accelerometer data from one side, this study utilizes explicit vibration data from both sides of the train body. This approach allows the model to distinguish between vibrations originating from irregularities on the left rail and those on the right, which often have different signal characteristics. The primary goal of this classification is to accurately identify various types of track irregularities, particularly those that pose critical conditions requiring maintenance intervention. This approach aligns with the global trend in rail condition monitoring, which is shifting from periodic manual or semi-automated inspections to more proactive and sustainable data-driven systems [1, 35].
Figure 4. Data based on irregularity track
3.3 Performance metrics and model evaluation
A preliminary analysis of the TRV data reveals significant class imbalance: normal/regular track conditions comprise 93% of the dataset (71,272 records). In comparison, irregularity classes account for only 6.21% (4,718 records) across seven defect categories (Figure 4). This imbalance poses a critical challenge for classification algorithms, as models may achieve high overall accuracy by predominantly predicting the majority class while failing to detect rare but safety-critical anomalies.
To address this challenge and ensure comprehensive model evaluation, we employ multiple performance metrics that provide different perspectives on classification effectiveness. Given that irregularity data constitute less than 7% of the total, accuracy alone is not a suitable metric. For detecting track irregularities, especially those that can pose a danger (such as Twist over 3m or extreme Track Gauge), high recall is the top priority. A focus on recall ensures that all potential safety issues are detected, even if it means conducting some extra inspections due to False Positives. The cost of False Negatives (accidents) is far higher than the cost of False Positives (unnecessary inspections). Additionally, the macro F1-Score is used to evaluate the classification performance, as it gives equal weight to each class, regardless of its size. The macro F1-Score is excellent for assessing performance on minority classes. The choice of these metrics is crucial given the imbalanced nature of the track irregularity data, where the 'normal' class is far more dominant than the 'defective' or 'irregular' classes. In this context, accuracy alone is insufficient for a comprehensive assessment of model performance, as a model could achieve high accuracy simply by classifying most samples as 'normal'. Therefore, the macro F1-Score and Recall for the minority classes are more relevant indicators of the model's ability to detect actual irregularities [36].
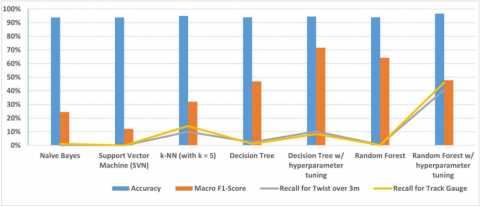
The implementation results of the machine learning algorithms in this study are summarized in Table 6.
Table 6. Algorithm performance for classification model
|
Algorithm |
Accuracy |
Macro F1-Score |
Recall for Twist over 3m |
Recall for Track Gauge |
Notes |
|
Naïve Bayes |
93.87% |
24.48% |
0% |
1.12% |
3 classes had no precision and recall values. |
|
Support Vector Machine (SVM) |
93.79% |
12.10% |
0% |
0% |
Only the 'Regular' class had precision and recall values. |
|
k-NN (k = 5) |
95.01% |
32.07% |
10.04% |
14.23% |
1 class (Right Vertical Alignment) had no precision and recall values. |
|
Decision Tree |
93.97% |
46.89% |
2.31% |
1.14% |
2 classes (Left Vertical Alignment, and Right Vertical Alignment) had no precision and recall values. |
|
Decision Tree w/ hyperparameter tuning |
94.60% |
71.73% |
10.32% |
8.28% |
Tuning with criterion: information gain, and maximal depth = 18 (All classes had precision and recall values). |
|
Random Forest |
93.92% |
64.22% |
0.53% |
0.32% |
1 class (Left Vertical Alignment) had no precision and recall values. |
|
Random Forest w/ hyperparameter tuning |
96.62% |
47.77% |
40.75% |
46.10% |
Tuning with criterion: Information gain, number of trees: 100, maximal depth: 40 (All classes defined). |
Initial analysis shows that algorithms like Naïve Bayes and Support Vector Machine (SVM) exhibit high overall accuracy (93.87% and 93.79%, respectively). Still, their performance in identifying minority classes is abysmal, with 0% recall for Twist and minimal recall for Track Gauge (1.12% and 0%). This indicates that these models tend to classify most irregularities as usual conditions, potentially jeopardizing operational safety. This phenomenon is common in imbalanced datasets, where models are biased towards the majority class [37].
In contrast, decision tree-based algorithms show more promising performance in detecting minority classes. A Decision Tree without initial tuning has a macro F1-Score of 46.89% with a Recall for Twist over 3m of 2.31% and Track Gauge of 1.14%. However, after hyperparameter tuning, the Decision Tree's performance significantly improves, achieving a macro F1-Score of 71.73%, a Recall for Twist over 3m of 10.32%, and for Track Gauge of 8.28%. This improvement demonstrates that model parameter optimization is crucial for enhancing irregularity detection capabilities.
Although several ensemble algorithms were evaluated, Random Forest (RF) was selected for further hyperparameter tuning due to its superior accuracy and stability. In similar railway infrastructure monitoring applications, RF has been shown to achieve the highest accuracy and more consistent F1 scores than gradient boosting methods such as XGBoost and LightGBM [38]. The bagging-based nature of RF makes it inherently more resistant to overfitting on imbalanced datasets, which characterizes our track defect data. While XGBoost and LightGBM exhibited high recall, RF provided a better balance between precision and recall, making it a more reliable choice for this safety-critical classification task. Therefore, optimization efforts were focused on RF hyperparameter tuning to maximize its predictive potential.
Figure 5. Classification algorithm performance
The RF algorithm, especially after tuning, shows the best recall for minority classes. The tuned RF, using the information gain criterion, achieves an accuracy of 96.62%, a macro F1-Score of 47.77%, a Recall for Twist over 3m of 40.75%, and a Recall for Track Gauge of 46.10%. Although its macro F1-Score is slightly lower than the tuned Decision Tree, the significantly higher recall values for Twist over 3m and Track Gauge indicate Random Forest's superior ability to identify actual irregularities. The performance of the classification algorithm is illustrated in Figure 5, showing the macro F1-Score and recall for two irregularity parameters sensitive to train safety. Accuracy, despite its high value, is still less important in this case.
It should be noted that the recall rate for the 'Twist over 3m' category is 40.75%, raising questions about its safety implications. We acknowledge that this detection rate is inadequate for a standalone real-time warning system. However, the primary purpose of this accelerometer-based system is to function as a complementary predictive maintenance tool, not as a replacement for periodic Track Recording Vehicle (TRV) inspections. In safety-critical domains such as railways, the trade-off between precision and recall must be carefully managed, where the consequences of false negatives far exceed those of false positives [39]. By identifying 41% of existing twist defects, this system provides valuable insights that enable targeted inspection scheduling and more efficient allocation of maintenance resources, thereby enhancing overall safety by reducing the time window during which critical defects may remain undetected.
This is crucial for predictive maintenance applications, where early detection of problems, however rare, is essential [40]. The success of Random Forest can be attributed to its ensemble nature, which reduces overfitting and improves generalization, making it a robust choice for complex accelerometer data [41].
While this study successfully demonstrates the feasibility of using on-board accelerometers for track monitoring in Indonesia, its limitations pave the way for critical future research. The model, trained on data from the Bandung-Cikampek line, is inherently specific to its unique track characteristics and operational conditions; its performance on tracks with different geometries, subgrade conditions, or traffic densities remains an open question. Model performance may be significantly influenced by various specific track characteristics that warrant further investigation. These factors include, but are not limited to, track curvature, where lateral forces in curved sections can alter vibration response compared to straight track; ballast type and condition, as different materials (e.g., crushed stone vs. concrete slab) exhibit varying stiffness and damping properties; track support conditions, such as subgrade quality and the presence of unsupported sleepers, which can lead to non-uniform dynamic responses [4]; and variations in traffic load and train speed, which directly affect the magnitude of wheel-rail dynamic forces.
Therefore, a crucial next step is to validate and retrain the model on a more diverse set of railway lines across Indonesia to develop a more generalized and robust national-level detection system. Furthermore, while our dual-sensor approach significantly improves the classification of irregularity types, the model's recall for critical faults, such as 'Twist' (40.75%), indicates that it should be considered a powerful early-warning system to complement, rather than replace, traditional TRV inspections. The next frontier of research should focus on bridging this performance gap through sensor fusion—integrating accelerometer data with other on-board sensors, such as gyroscopes (for rotational dynamics) and GPS/IMU (for more precise localization). This multi-modal approach could unlock a deeper understanding of vehicle-track dynamics and push the system's predictive accuracy towards the level required for fully autonomous, real-time railway asset management.
This study successfully pioneered a data-driven framework for railway track monitoring in Indonesia, proving that on-board accelerometers in regular in-service trains can serve as a viable, high-frequency supplement to traditional TRV inspections. Our analysis culminated in the development of a hyperparameter-tuned Random Forest model that achieved an overall accuracy of 96.62%. More critically, it delivered the highest recall rates for the most dangerous types of track defects: 40.75% for Twist over 3m and 46.10% for Track Gauge irregularities. This achievement marks a significant innovation, providing Indonesian railway operators with a reliable method to detect high-risk conditions before they escalate, thereby directly enhancing operational safety.
The key innovation presented is not merely the application of machine learning, but the validation of a dual-sided accelerometer approach against Indonesia's specific regulatory standards. By proving this model's capability to identify critical faults, this research establishes a precise and reliable foundation for the next generation of railway maintenance. The immediate follow-up is to transition this validated proof of concept into a scalable, real-time monitoring system. This work represents a definitive step away from reactive, time-based maintenance and toward a predictive, data-centric asset management strategy, promising a future of safer, more efficient, and more resilient railway infrastructure for Indonesia.
Key Implications
The main implications of this research are highly significant for railway infrastructure maintenance, particularly in developing countries like Indonesia. By demonstrating the feasibility and potential of using on-board accelerometers on regularly operating trains to monitor track irregularities, this study paves the way for a transition from resource-intensive time-based maintenance to a more efficient and sustainable predictive maintenance approach. The ability to identify and track anomalies more frequently and in real-time, validated with accurate TRV data, can not only enhance operational safety and passenger comfort through early problem detection but also optimize maintenance resource allocation, reduce long-term costs, and extend the lifespan of rail assets. This is a crucial step towards a smarter and more adaptive railway asset management system, ultimately supporting the growth and reliability of the national transportation network.
From a practical deployment perspective, while acknowledging the current model's limitations for the Bandung-Cikampek line, the proposed system offers a feasible and cost-effective solution for enhancing railway maintenance regimes. Hardware costs, primarily consisting of MEMS accelerometers, GPS modules, and microprocessors, are significantly lower than the operational costs of dedicated Track Recording Vehicles (TRV), aligning with industry needs for economical monitoring solutions [24]. For data analysis, the system can be configured for edge processing within the train to enable low-latency alerts, or it can transmit data to cloud platforms for more in-depth analysis. Successful integration into existing systems will depend on data format standardization and API development to interface with existing maintenance management software.
Before broader deployment across diverse railway networks, the model should be validated and retrained on data from various track characteristics, including different curvatures, ballast types, and traffic conditions, as discussed in the limitations section. By functioning as a first-tier continuous monitoring system, this accelerometer-based approach can effectively prioritize and optimize the deployment of more expensive inspection assets, such as TRVs, thereby taking a practical step toward a more efficient and proactive predictive maintenance framework aligned with the broader digital transformation in the railway sector [1].
All authors have contributed to the results of this study. They begin with research preparation, including finding references, system design, system testing, and manuscript preparation, and continue through to the final revision results.
The authors would like to express their deepest gratitude to the Institut Teknologi Bandung for providing the necessary resources and support throughout this research. The author also expresses his appreciation to the Infrastructure Division of PT Kereta Api Indonesia (PT KAI) for their willingness to participate in discussions and assist in the implementation of this research.
[1] Bianchi, G., Fanelli, C., Freddi, F., Giuliani, F., La Placa, A. (2025). Systematic review railway infrastructure monitoring: From classic techniques to predictive maintenance. Advances in Mechanical Engineering, 17(1): 16878132241285631. https://doi.org/10.1177/16878132241285631
[2] Haigermoser, A., Eickhoff, B., Thomas, D., Coudert, F., et al. (2014). Describing and assessing track geometry quality. Vehicle System Dynamics, 52(sup1): 189-206. https://doi.org/10.1080/00423114.2014.889318
[3] Farkas, A. (2020). Measurement of railway track geometry: A state-of-the-art review. Periodica Polytechnica Transportation Engineering, 48(1): 76-88. https://doi.org/10.3311/PPtr.14145
[4] Loidolt, M., Weilguny, R., Marschnig, S. (2024). Impact of rail irregularities on longitudinal level deterioration based on deconvoluted data. Infrastructures, 9(9): 162. https://doi.org/10.3390/infrastructures9090162
[5] Sansiñena, A., Rodríguez-Arana, B., Arrizabalaga, S. (2025). A systematic review of acceleration-based estimation of railway track quality. Vehicle System Dynamics, 2483972: 1-28. https://doi.org/10.1080/00423114.2025.2483972
[6] Track geometry – Wikipedia. Wikipedia. (2024). https://en.wikipedia.org/wiki/Track_geometry.
[7] Choi, I.I.Y., Um, J.H., Lee, J.S., Choi, H.H. (2013). The influence of track irregularities on the running behavior of high-speed trains. Proceedings of the Institution of Mechanical Engineers, Part F: Journal of Rail and Rapid Transit, 227(1): 94-102. https://doi.org/10.1177/0954409712455146
[8] Chai, G., Liu, W. (2019). Safety analysis of railway track irregularity. China Safety Science Journal, 29(S2): 57.
[9] Peixer, M.A., Montenegro, P.A., Carvalho, H., Ribeiro, D., Bittencourt, T.N., Calçada, R. (2021). Running safety evaluation of a train moving over a high-speed railway viaduct under different track conditions. Engineering Failure Analysis, 121: 105133. https://doi.org/10.1016/j.engfailanal.2020.105133
[10] Qiu, L., Zhu, M., Jiang, Y., Teng, H.H., Park, J.W. (2025). Non-disruptive rail track geometry measurement system using an unmanned aerial vehicle and a light detection and ranging sensor. International Journal of Transportation Science and Technology, 2: 8. https://doi.org/10.1016/j.ijtst.2025.02.008
[11] Chen, Q., Niu, X., Zuo, L., Zhang, T., Xiao, F., Liu, Y., Liu, J. (2018). A railway track geometry measuring trolley system based on aided INS. Sensors, 18(2): 538. https://doi.org/10.3390/s18020538
[12] Cai, X., Tang, X., Wang, Y., Wang, T., Yang, F., Sun, J. (2024). Advanced VTCDREM for dynamic reliability evaluation of railway systems: Integration of fully probabilistic track irregularities and multifaceted random factors. Journal of Sound and Vibration, 584: 118460. https://doi.org/10.1016/j.jsv.2024.118460
[13] De Rosa, A., Alfi, S., Bruni, S. (2019). Estimation of lateral and cross alignment in a railway track based on vehicle dynamics measurements. Mechanical Systems and Signal Processing, 116: 606-623. https://doi.org/10.1016/j.ymssp.2018.06.041
[14] Ingenius. (2025). Monitoring damage to railway tracks. https://ingenius.ecoledesponts.fr/en/articles/monitoring-damage-to-railway-tracks/.
[15] Binder, M., Mezhuyev, V., Tschandl, M. (2023). Predictive maintenance for railway domain: A systematic literature review. IEEE Engineering Management Review, 51(2): 120-140. https://doi.org/10.1109/EMR.2023.3262282
[16] VLink. (2025). AI in Railways: Predictive Analytics for Maintenance. https://vlinkinfo.com/blog/ai-in-railways.
[17] Vale, C., Simões, M.L. (2022). Prediction of railway track condition for preventive maintenance by using a data-driven approach. Infrastructures, 7(3): 34. https://doi.org/10.3390/infrastructures7030034
[18] Braga, J.A., Andrade, A.R. (2023). Data-driven decision support system for degrading assets and its application under the perspective of a railway component. Transportation Engineering, 12: 100180. https://doi.org/10.1016/j.treng.2023.100180
[19] Nigam, S., Kumar, D., Mukherji, S., Tomar, S.S., Shastri, S., Gupta, P. (2024). Predictive maintenance of railway tracks using LSTM. In 2024 IEEE International Conference on Intelligent Signal Processing and Effective Communication Technologies (INSPECT), Gwalior, India, pp. 1-5. https://doi.org/10.1109/INSPECT63485.2024.10896208
[20] Register, F. (2024). Track Geometry Measurement System (TGMS) Inspections. https://www.federalregister.gov/documents/2024/10/24/2024-24153/track-geometry-measurement-system-tgms-inspections.
[21] Haigermoser, A., Luber, B., Rauh, J., Gräfe, G. (2015). Road and track irregularities: Measurement, assessment and simulation. Vehicle System Dynamics, 53(7): 878-957. https://doi.org/10.1080/00423114.2015.1037312
[22] Tsunashima, H., Yagura, N. (2024). Railway track irregularity estimation using car body vibration: A data-driven approach for regional railway. Vibration, 7(4): 928-948.
[23] Sresakoolchai, J., Manakul, C., Cheputeh, N.A. (2025). Integration of accelerometers and machine learning with BIM for railway Tight-and Wide-Gauge detection. Sensors, 25(7): 1998. https://doi.org/10.3390/s25071998
[24] Hu, Z., Lau, A., Dai, J., Frøseth, G.T. (2024). Identification of optimal accelerometer placement on trains for railway switch wear monitoring via multibody simulation. Frontiers in Built Environment, 10: 1396578. https://doi.org/10.3389/fbuil.2024.1396578
[25] Westeon, P.F., Ling, C.S., Roberts, C., Goodman, C.J., Li, P., Goodall, R.M. (2007). Monitoring vertical track irregularity from in-service railway vehicles. Proceedings of the institution of mechanical engineers, Part F: Journal of Rail and Rapid Transit, 221(1): 75-88. https://doi.org/10.1243/0954409JRRT65
[26] Xie, Q., Peng, F., Tao, G., Ren, Y., Liu, F., Yang, J., Wen, Z. (2025). Monitoring track irregularities using multi-source on-board measurement data. Railway Engineering Science, 2025: 1-20. https://doi.org/10.1007/s40534-024-00374-0
[27] Kurniawan, W., Rulhendri, R. (2015). Tinjauan volume pemeliharaan tahunan jalan rel berdasarkan hasil track quality index (TQI)(Studi kasus: Lintas Manggarai-Bogor). Astonjadro, 4(2): 1-17. https://doi.org/10.32832/astonjadro.v4i2.823
[28] Alamsyah, A. (2003). Rekayasa Jalan Rel. Malang: Bayumedia.
[29] De Rosa, A., Kulkarni, R., Qazizadeh, A., Berg, M., Di Gialleonardo, E., Facchinetti, A., Bruni, S. (2021). Monitoring of lateral and cross level track geometry irregularities through onboard vehicle dynamics measurements using machine learning classification algorithms. Proceedings of the Institution of Mechanical Engineers, Part F: Journal of Rail and Rapid Transit, 235(1): 107-120. https://doi.org/10.1177/0954409720906649
[30] Sadeghi, J. (2010). Development of railway track geometry indexes based on statistical distribution of geometry data. Journal of Transportation Engineering, 136(8): 693-700. https://doi.org/10.1061/(ASCE)0733-947X(2010)136:8(693)
[31] Weston, P., Roberts, C., Yeo, G., Stewart, E. (2015). Perspectives on railway track geometry condition monitoring from in-service railway vehicles. Vehicle System Dynamics, 53(7): 1063-1091. https://doi.org/10.1080/00423114.2015.1034730
[32] Yeo, G.J. (2017). Monitoring railway track condition using inertial sensors on an in-service vehicle (Doctoral dissertation, University of Birmingham).
[33] Soleimanmeigouni, I., Ahmadi, A., Kumar, U. (2018). Track geometry degradation and maintenance modelling: A review. Proceedings of the Institution of Mechanical Engineers, Part F: Journal of Rail and Rapid Transit, 232(1): 73-102. https://doi.org/10.1177/0954409716657849
[34] Tsunashima, H. (2019). Condition monitoring of railway tracks from car-body vibration using a machine learning technique. Applied Sciences, 9(13): 2734. https://doi.org/10.3390/app9132734
[35] Jin, Z., Zhang, W., Yin, Z. Y., Zhang, N., Geng, X. (2025). Estimating track geometry irregularities from in-service train accelerations using deep learning. Automation in Construction, 173: 106114. https://doi.org/10.1016/j.autcon.2025.106114
[36] Pires, A.C., Viana, M.C.A., Scaramussa, L.M., Santos, G.F.M.D., Ramos, P.G., Santos, A.A. (2024). Measuring vertical track irregularities from instrumented heavy haul railway vehicle data using machine learning. Engineering Applications of Artificial Intelligence, 127: 107191. https://doi.org/10.1016/j.engappai.2023.107191
[37] Shaikh, K., Hussain, I., Chowdhry, B.S. (2023). Wheel defect detection using a hybrid deep learning approach. Sensors, 23(14): 6248. https://doi.org/10.3390/s23146248
[38] Soleimani-Chamkhorami, K., Karbalaie, A., Kasraei, A., Haghighi, E., Famurewa, S.M., Garmabaki, A.H.S. (2024). Identifying climate-related failures in railway infrastructure using machine learning. Transportation Research Part D: Transport and Environment, 135: 104371. https://doi.org/10.1016/j.trd.2024.104371
[39] Pineda-Jaramillo, J., Bigi, F., Villalba-Sanchis, I., Salvador-Zuriaga, P. (2025). Anomaly detection in railway tracks using hybrid clustering and spectral analysis for predictive maintenance. IEEE Access, 13: 164265-164287. https://doi.org/10.1109/ACCESS.2025.3611009
[40] Traquinho, N., Vale, C., Ribeiro, D., Meixedo, A., Montenegro, P., Mosleh, A., Calçada, R. (2023). Damage identification for railway tracks using onboard monitoring systems in in-service vehicles and data science. Machines, 11(10): 981. https://doi.org/10.3390/machines11100981
[41] Tsunashima, H., Ono, H., Takata, T., Ogata, S. (2023). Development and operation of track condition monitoring system using in-service train. Applied Sciences, 13(6): 3835. https://doi.org/10.3390/app13063835