Predicting the Distribution of Lygodium circinnatum and Its Environmental Drivers in Mount Rinjani Forest, Indonesia

Ogi Setiawan*![]() | Luthfi Hanindityasari
| Luthfi Hanindityasari![]() | I Wayan W. Susila
| I Wayan W. Susila![]() | Sigit A. Cahyono
| Sigit A. Cahyono![]() | Agung W. Nugroho
| Agung W. Nugroho![]() | Nunung P. Nugroho
| Nunung P. Nugroho![]() | Yayan Hadiyan
| Yayan Hadiyan![]() | Wuri Handayani
| Wuri Handayani![]() | Dila Swestiani
| Dila Swestiani![]() | Heru D. Riyanto
| Heru D. Riyanto![]()
© 2025 The authors. This article is published by IIETA and is licensed under the CC BY 4.0 license (http://creativecommons.org/licenses/by/4.0/).
OPEN ACCESS
Lygodium circinnatum (Burm.f.) Sw. is a well-known species of fern found in Mount Rinjani, used to make a variety of woven handicrafts, and is currently endangered. Therefore, it is essential to understand its distribution in the forest area and potential environmental influences for conservation strategic planning. This study aimed to predict the distribution of and assess the potential environmental influences on L. circinnatum in the forest area of Mount Rinjani. Using the Maxent model, with 10 replications, 500 iterations, and 10,000 background points, the species distribution was created based on environmental factors, i.e., vegetation coverage as indicated by the NDVI (Normalized Difference Vegetation Index) and morphological characteristics (elevation, slope, curvature, aspect, plan curvature, profile curvature, TPI, and TWI). The result showed that the Maxent model was acceptable for defining L. circinnatum distribution with an AUC of 0.82 and the influence of environmental factors on its dispersion. The species preferred to be distributed spatially in the West, East, and Northeast of the forest in Mount Rinjani. Morphological characteristics that played an essential role in influencing the presence of L. circinnatum were slope, elevation, and aspect. Regarding NDVI, the species occurrence was predicted in low to moderate dense vegetation coverage, indicated by low to moderate NDVI values (0.05 - 0.35). This study contributes to the understanding of L. circinnatum habitat and provides valuable information for future conservation strategies through providing a 30 m resolution map of species distribution.
maximum entropy, spatial distribution, environmental influences, Lygodium circinnatum, conservation strategies
Non-timber forest products (NTFPs), such as Lygodium circinnatum (Burm.f.) Sw., are essential on Lombok Island, especially in the forest area of Mount Rinjani [1]. It is locally known as ketak grass, and in some places, it is called reed, vine, ata, or grass. With a short rhizome, this climbing fern typically twines itself up other plants or trees to get out of the shade and into a sunnier spot [2]. The plant stems are used as raw material for handicraft industries around the forest areas. Generally, local people harvest the plant directly from the wild in the forest area to supply the industries' needs. This condition threatens plant sustainability because of overexploitation [3]. Therefore, cultivation and conservation efforts of L. circinnatum are needed to minimize the adverse impacts of threatening factors.
One of the valuable information to support conservation efforts is the species distribution model (SDM). An SDM for L. circinnatum provides an understanding of its spatial distribution and the environmental features of its habitat. It is critical to reconcile its ecological adaptability with conservation needs. The model is also essential for establishing the ideal growing conditions for the plant and for implementing conservation plans to halt habitat destruction and ecosystem degradation [4].
Furthermore, habitat mapping and modeling are practical approaches for analyzing the connection between the plant’s existence and the possible environmental influences. They also create the habitat illustration spatially with various diversity and use it to define protection needs to conserve the natural ecosystem [5].
Integrating statistical modeling into the Geographic Information System (GIS) framework has become vital for evaluating spatial phenomena, including species distribution [6]. The approach uses the niche concept to exhibit the species' spatial distribution. The notion behind the concept is that a species’ niche is defined by the features of the habitat it inhabits. Statistic modeling, which is widely used to model species distribution, SDMs, including Support Vector Machine (SVM) [7], a generic algorithm [8], binary Logistic Regression (LR) [9], boosted regression tree [10], Multivariate Adaptive Regression Spline (MARS) [10], Artificial Neural Networks (ANN) [11], Generalized Additive Model (GAM) [12], Generalized Linear Model (GLM), and Maximum Entropy (Maxent) [13]. Additionally, these models allow spatial extrapolation from comparatively small field data sample sizes in the research region [14].
Several studies concluded that Maxent is a more flexible and robust technique for species distribution evaluation. The maximum entropy distribution likelihood is employed in the maxent algorithm, which forecasts species distribution in various environmental settings [15]. The Maxent model performs well with sparse or limited spatial samples and has a higher prediction capability than other models [16]. The model uses the presence data of species to deal with sample biases, such as visual sighting data. The effectiveness of the Maxent model has also been assessed for various species and geographical areas. For example, Eshetae et al. [17] utilized the Maxent model to identify Ensete ventricosum’s characteristics and its geographical distribution in Ethiopia, Africa. The model had excellent prediction with an AUC (Area Under Curve) of more than 0.8. Assessment of killer whale (Orcinus orca) distribution in Australia using the Maxent model has been done by Jones et al. [18] with excellent performance. The result also defines potential environmental influence on the species distribution. Other various studies have also been conducted, e.g., mapping the habitat suitability of Juniperus spp. in Iran by Boogar et al. [19], predicting the potential distribution of an invasive species [20] and threatened medicinal plants [21], analyzing bird diversity and the environmental variables [22], and modeling the probability of pathogens occurrence on rice [23].
Comparative studies between the Maxent model and other SDM models, such as random forest and ensemble models, have been conducted. Kaky et al. [24] held a comparison study between the Maxent model and the Ensemble model for Egyptian medicinal plants. They concluded that Maxent, ensemble, and random forest achieved the highest predictive result based on AUC and True Skill Statistic (TSS). For a single algorithm, the Maxent model was capable of producing a distribution map and reducing computational time. Zhao et al. [25] compared the performance of Maxent and random forest in predicting the distribution of Quasipaa boulengeri in China. These models had a good performance in mapping the species distribution. They also concluded that the Maxent model is preferable for presence-only data, while the random forest model excels with presence-absence data and complex ecological interactions. Considering that the current study involves a sparse sample and the presence records only of the target species occurrences, the Maxent model was ideal for the current study analysis.
The main goal of this study was to predict the distribution of and assess the potential environmental influences on L. circinnatum in the forest area of Mount Rinjani using the Maxent model. Defining environmental factors as the predictor of the Maxent model has a critical role in determining species distribution. To evaluate L. circinnatum distribution, several environmental predictors for the Maxent model input were utilized, including morphological characteristics and vegetation coverage. One of the key elements affecting vegetation distribution is morphology [26]. Morphology controls climatic conditions, soil properties distribution [27], hydrological processes, and seed migration [28]. All these processes contribute to vegetation spatial distribution. Morphological characteristics commonly used in species distribution models are elevation, slope, aspect, and surface curvature. In addition, the distribution of grass species in different landscapes was also controlled by vegetation coverage [29]. Variations in vegetation coverage affect the availability of understory light. The level of understory light availability controls the distribution of understory species, including fern species. This study used the NDVI value, calculated from remotely sensed data, to represent the vegetation coverage. Numerous researchers discovered a strong correlation between vegetation density and NDVI [30].
2.1 Study site
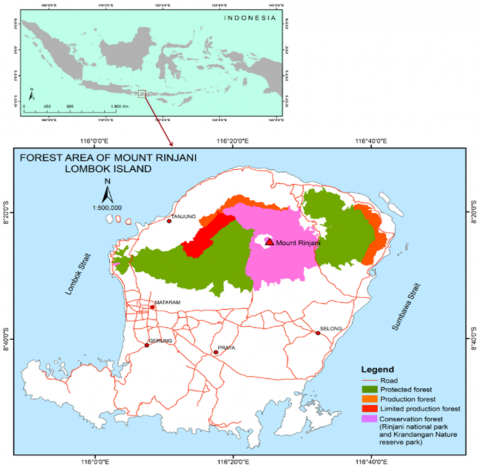
This study was carried out in the forest area of Mount Rinjani, Lombok Island, West Nusa Tenggara Province, Indonesia. It comprises over 117,891 hectares (ha) and lies geographically between 8°14′1″S-8°32′1″S and 116°2′1″E-116°40′2″E (Figure 1). The elevation from the lowest area in the North to the peak of Mount Rinjani ranges from 8 to 3,726 meters Above Sea Level (m a.s.l.). Based on forest functionality, the study area consists of a production forest, a protected forest, a limited production forest, Krandangan Nature Reserve Park, and Mount Rinjani National Park. Generally, the forest area has a moderate climate based on the Schmidt-Fergusson classification [31]. These areas receive rainfall ranging from 500-2,300 mm of rainfall annually. The spatial distribution of rainfall in the study area varies due to elevation differences. The minimum and maximum mean annual temperatures are 23℃ and 27℃, respectively.
Figure 1. A map indicating the location of the study area in Lombok Island, Indonesia
The land cover of the study areas is dominated by primary forest coverage. Secondary forests cover the border between forest areas and non-forest areas. The forest area includes various ecosystems ranging from lowland tropical forests to mountainous tropical rainforests. The variety of ecosystems in the forest area also leads to a broad variability of vegetation. Elevations of up to 1,000 m a.s.l. are home to various plants and herbs, such as Pandanus tectorius, Asplenium nidus, Daemonorops sp., Usnea sp., and Imperata cylindrica. The broadleaf trees spread from an elevation of less than 1,000 to about 2,000 m a.s.l., including Ficus benjamina, Laportea stimulans, Myristica fatua, Pterospermum javanicum, Artocarpus elastica, Engelhardia spicata, Podocarpus vaccinium, Vaccinium caringiifolia, Syzigium sp., and Photinia noniana. In contrast, coniferous trees can be found at elevations greater than 2,000 m a.s.l., such as Casuarina junghuhniana. At an elevation of more than 3,000 m a.s.l. (close to Mount Rinjani Peak), grass and shrubs with thick leaves, and C. junghuhniana live sporadically [32].
The volcanism process controls the geomorphology of the forest area in Mount Rinjani. The study area mainly comprises volcanic deposits, such as lava and lahar breccia [33]. The components of the morphological expression include the volcanic cone around the peak, mountainous and hilly volcanic, and alluvial plains in the Northeast. Various climatic, morphological, and vegetation factors result in a wide soil diversity. The soils in the study area consist of inceptisols, andisols, entisols, and vertisols, subdivided into aquic, humic, lithic, typic, and vertic.
2.2 Data preparation
The input data of the Maxent model consists of species presence data and environmental variables as the predictors. A purposive sampling technique was used in point sample determination, as explained by Hirzel and Guisan [34]. The point samples were selected based on the information from local people who harvest the L. circinnatum directly from the forest area. Biases might be present in information gathered from local residents. Corrections have therefore been performed via cross-validation by integrating field surveys and earlier reports with participatory mapping, which involves marking on the map. A total of 190 distinct possible habitats of L. circinnatum were collected utilizing the Global Positioning System (GPS) in the field and employed as species presence data. These data were divided into 80% for training data of model development and the other 20% data for validation. The projection used for species presence data was Universal Transverse Mercator (UTM) zone 50S.
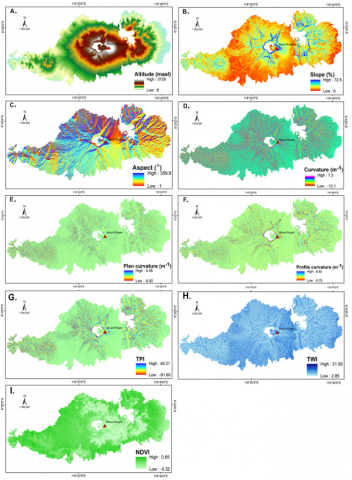
Figure 2. Environmental predictor maps of the research area: elevation (A), slope (B), aspect (C), curvature (D), plan curvature (E), profile curvature (F), TPI (G), TWI (H), and NDVI (I)
A study conducted by Colgan et al. [35] concluded that morphology within a landscape controls vegetation distribution and characteristics on the local scale. Local morphological characteristics influence soil property distribution spatially, ultimately determining vegetation cover. In addition, grass or fern species are influenced by vegetation coverage as well. The morphological variables used in this study consisted of elevation, slope, aspect, curvature, plan curvature, profile curvature, TPI, and TWI (Figure 2). These morphological variables were obtained from a Digital Elevation Model (DEM) with 12.5-meter spatial resolution generated from the topographic map on a scale of 1:25,000. The definitions and formulas used in the calculation of morphological characteristics are shown in Table 1. This study used the NDVI to represent the vegetation coverage calculated from SPOT remotely sensed data (Figure 2). The resulting morphological and NDVI layers were pre-processed and projected to UTM zone 50S for equal spatial extent and spatial resolution.
Table 1. The morphological characteristics description extracted from DEM data
|
Attributes |
Definition and Formula |
|
Elevation (m a.s.l.) |
The vertical distance from the reference point to specific cells is derived from the DEM cell value. |
|
Slope (%) |
The rate of change is both the direction and the steepness of elevation. $G=\arctan \sqrt{p^2+q^2}$ where, $p=\frac{\delta z}{\delta x}$, and $q=\frac{\delta z}{\delta y}$ Slope = tan (G) × 100 |
|
Aspect (°) |
The direction that a slope face $A=\arctan \left(\frac{q}{p}\right)$ where, $p=\frac{\delta \mathrm{z}}{\delta \mathrm{x}}$, and $q=\frac{\delta z}{\delta y}$ |
|
Curvature (m-1) |
A total curvature within a group of grid cells or the average of plan and profile curvature. Cur $=($Pl_cur + Pr_cur $) / 2$ |
|
Plan curvature (m-1) |
The rate of change of aspect angle in the horizontal plane. Pl_cur $=\frac{q^2 r-2 p q s+p^2 t}{\left(p^2+q^2\right) \sqrt{1+p^2+q^2}}$
where, $p=\frac{\delta z}{\delta x}, q=\frac{\delta z}{\delta y}, r=\frac{\delta^2 z}{\delta x^2}, t=\frac{\delta^2 z}{\delta y^2}$, and $s=\frac{\delta^2 z}{\delta x \delta y}$ |
|
Profile curvature (m-1) |
The slope rate changes downhill or uphill in the direction of the maximum slope. Pr_cur $=\frac{p^2 r-2 p q s+q^2 t}{\left(p^2+q^2\right) \sqrt{\left(1+p^2+q^2\right)^3}}$ where $: p=\frac{\delta z}{\delta x}, q=\frac{\delta z}{\delta y}, r=\frac{\delta^2 z}{\delta x^2}, t=\frac{\delta^2 z}{\delta y^2}$, and $s=\frac{\delta^2 z}{\delta x \delta y}$ |
|
Topographic Position Index (TPI) |
The relative hillslope position of the central point is the difference between the elevation at this point and the mean elevation within a predetermined neighborhood. $T P I=z_0-\bar{z}$ where z0 is an elevation of a central location, z is the average elevation around the central location within a predetermined radius. |
|
Topographic Wetness Index (TWI) |
The ratio between the contributing area and slope reflects flow accumulation. $T W I=\ln \left[\frac{A}{\tan (\beta)}\right]$, where A is the contributing area, β is the slope. |
2.3 Data analysis and modeling
This study used a collinearity test to reduce model overparameterization. The test was applied to all nine environmental variables, including morphological characteristics and vegetation coverage. The Pearson correlation coefficient (r) was used to assess the degree of collinearity between the variables. The threshold used in this study was 0.8 to identify correlated variables [36]. The highly correlated variables with a correlation value higher than 0.8 were excluded from the analysis. A high correlation value also indicates collinearity existence among the predictor variables that can decline model accuracy.
The Maxent version 3.4.1 software from the biodiversity informatics portal (https://biodiversityinformatics.amnh.org/ open_source/maxent/) was employed to model the spatial habitat of L. circinnatum. The default settings (Table 2) have been fine-tuned to deliver strong performance across various datasets while ensuring the models remain appropriately constrained to prevent overfitting [37]. The input data used in this investigation were the species presence and environmental layers (morphological characteristics and NDVI). The Maxent model predicts species distribution by calculating the probability according to the event data. The model utilizes the maximum entropy approach to approximate the most likely distribution of the target species, which is constrained by environmental predictors. The model also randomly generates background 'pseudo-absence' points in the study area to distinguish uninhabited habitats. The Maxent model attributes each grid of the output in the study area with a log-scale value for habitat suitability between 0 and 1, which means low to high suitability, respectively [38]. The model also analyzes the contribution of the predictor variables to the model using the Jackknife test, representing the relative importance of each variable. This study used relative importance to assess the critical environmental factors that drive the L. circinnatum occurrence and potential geographic range.
Table 2. Model setting applied to the Maxent model
|
Setting |
Value |
|
Feature classes (FC) |
Linear, Quadratic, Product, Hinge |
|
Regularisation multiplier |
1 |
|
Prevalence |
0.5 |
|
Maximum number of background points |
10,000 |
|
Output format |
Logistic |
|
Maximum iteration |
500 |
|
Convergence threshold |
0.0001 |
|
Replicate |
10 |
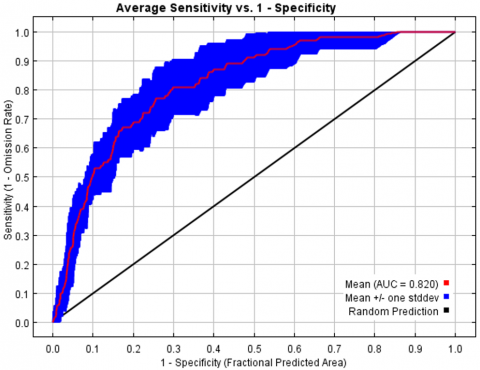
The resulting model’s accuracy in predicting L. circinnatum distribution was analyzed using the AUC of the Receiver Operator Characteristic (ROC) method. The positive rate (sensitivity) was plotted against the false positive rate (1-specificity) to create the ROC curve. The AUC indicates the level of the model in discriminating actual presence from random noise. The value of AUC ranges from 0 to 1; the closer the value is to 1, the better the model fits [39].
3.1 The Maxent model’s performance
The correlation among morphological characteristics based on correlation analysis of predictor variables is shown in Figure 3. There was a strong correlation (r > 0.80) between curvature, plan curvature, and profile curvature. Thus, plan curvature and profile curvature were left out of the model development process in favor of curvature. The model’s last variables were elevation, slope, aspect, curvature, TPI, TWI, and NDVI.
Figure 3. Heatmap of morphological variables correlation
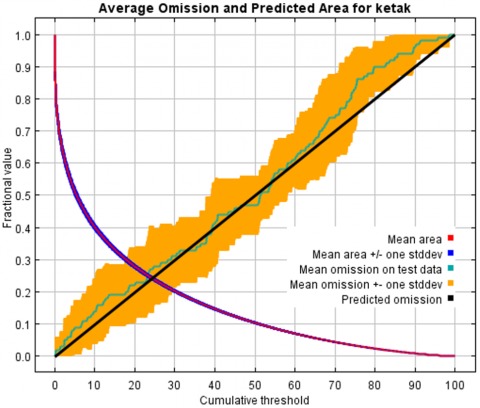
Considering the model’s overall performance indices, the model's performance was adequate to predict the spatial distribution of L. circinnatum. Figure 4 shows that the average AUC of the replicate runs was 0.820, with a 0.046 standard deviation. AUC for training data and test data of replicate runs were 0.899 and 0.819, respectively. According to Vernooij et al. [40], the model's predicted accuracy based on AUC was good (0.7-0.9). In addition, the test data’s omission rate was in line with the expected omission rate, demonstrating the high degree of precision in the generated model. Figure 5 shows the test omission rate and prediction area as a function of the cumulative threshold.
Figure 4. ROC curve and AUC for L. circinnatum
Figure 5. The curve of the predicted area and test omission rate for L. circinnatum
The model generates the percentage contribution of each environmental variable. The contribution percentage indicates the significance of the environmental variable to the model associated with the presence of data for L. circinnatum (Table 3). Morphological characteristics that significantly contributed to the model were elevation, slope, and aspect. In comparison, the study of SDM for New Zealand ferns using the GAM model also found that landform parameters, especially slope gradient, were the most contributing variable [41]. NDVI, which represents vegetation coverage, also controlled the species distribution significantly. The Maxent model also generates the permutation importance (a critical constituent) for each environmental variable. Permutation provides quantitative values to evaluate a variable's role concerning model accuracy when the variable is excluded from the analysis. Among the environmental variables, elevation, NDVI, slope, and aspect had higher permutation importance of 35.7%, 24.2%, 16.3%, and 14.2%, respectively. On the other hand, the model accuracy decreased according to the permutation of important values when these variables were left out of the model’s creation.
Table 3. Contribution percentage and significance of permutation
|
Variable |
Contribution (%) |
Significance of Permutations (%) |
|
Elevation |
34.8 |
35.7 |
|
NDVI |
25.9 |
24.2 |
|
Slope |
18.9 |
16.3 |
|
Aspect |
15.7 |
14.2 |
|
TWI |
2.2 |
5.8 |
|
Curvature |
1.5 |
1.0 |
|
TPI |
1.0 |
2.9 |
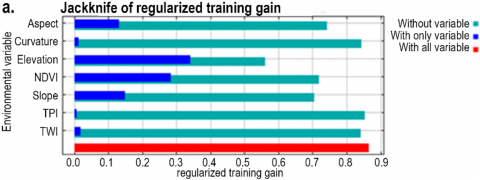
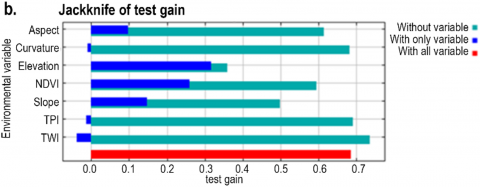
The variable importance was also assessed using the Jackknife test, and Figures 6(a) and 6(b) show the model’s Jackknife output for both training and test gain. The Jackknife test indicated the same pattern between the two gains. Both plots, training and test gain, exhibited that elevation, NDVI, slope, and aspect had higher gain than other variables in isolation. When these variables were used independently, they revealed more insightful data. In addition, these variables were also the variables that decreased the gain the most when they were excluded. Therefore, these variables seem to contain most of the data that is absent from the remaining variables.
Figure 6. Jackknife output plots of the Maxent model as the averages over ten replicate runs for (a) the training gain, (b) the test gain, and (c) the AUC
According to the Jackknife plot of AUC (Figure 6(c)), the variables that had high prediction ability were elevation, NDVI, slope, and aspect. It implies that the information contained in these variables is absent from the other variables. Nevertheless, the other variables do not seem to have substantial details related to the spatial distribution of L. circinnatum. Therefore, neglecting curvature, TPI, and TWI did not decrease the model accuracy significantly in terms of training gain, test gain, or AUC.
The species distribution modeling provided the likelihood of species occurrence and an understanding of the influence of morphological characteristics and NDVI on the spatial distribution of L. circinnatum. The model revealed that elevation, slope, and aspect were the most important morphological variables that controlled the species distribution. The finding supports earlier studies' results that state that elevation, slope, and aspect affect species distribution geographically. Examples of these discoveries include the diversity of shrubs found in Beijing, deciduous broad-leaved forests [42], and plant species distribution in Oregon [43]. The other morphological variables, such as TPI, TWI, and curvature, had little influence on the species distribution and habitat suitability. The NDVI variable was satisfactory to express vegetation openness as an essential variable. Morphology and vegetation coverage created the spatial heterogeneity of L. circinnatum's existence as the expression of the specific spatial distribution. As explained by Wang et al. [44], understory vegetation, such as grass and ferns, is the environmental component that reacts to different morphological characteristics and canopy openness.
3.2 Probabilistic distribution of L. circinnatum
The Maxent model produced the probabilistic distribution of L. circinnatum with a range value of 0.01 - 1.0. This value indicated the probability of species presence and suitable habitat for L. circinnatum. The grids with values close to one indicate the locations where the species are present, and they have morphological characteristics and vegetation cover appropriate for the species' habitat. The species presence probability values were divided into five probability classes (Figure 7), i.e., very low (0 - 0.20), low (0.20 - 0.40), moderate (0.40 - 0.60), high (0.60 - 0.80), and very high (0.80 - 1.00). The model predicted that the existence of high and very high species and habitat suitability, i.e., areas with an occurrence probability of > 60%, was observed at the west, northeast, and east of the forest area in the Mount Rinjani flank.
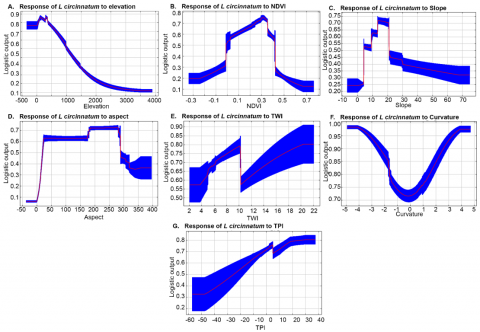
The Maxent model also generates the response curves of morphological characteristics and NDVI (Figure 8). The response curves depict the relationship between predictor variables and the species presence probability. The elevation response curve revealed that the high presence probability (> 60%) and habitat suitability of L. circinnatum occurred at the elevation of 8 to 800 m a.s.l. The high probability of species occurrence was also observed in a relatively low to moderate density of vegetation coverage, represented by NDVI values of 0.05 - 0.35. It was in line with a study conducted by Purwanto [44] that found the NDVI values of 0.02-0.39 represented the low to moderate vegetation density. Generally, fern species require shaded understory environments where the vegetation coverage is moderate to high. Consistent moisture and low evapotranspiration are also needed for germination and growth, which are common in the moderate NDVI areas. In addition, L. circinnatum is able to colonize open, disturbed areas in the forest ecosystem where the vegetation density is low to moderate [45].
Regarding the slope response curve, the high presence probability and habitat suitability increased with increasing slope, ranging from 8% to 22%. The response curve for aspect also revealed a rising likelihood of species occurrence and habitat suitability following the increasing aspect values from 170 - 280 degrees. The high probability of species presence has a wide range of values for low important variables: curvature, TPI, and TWI, with values of -5 - 5, -1 - 40, and 4 - 22, respectively.
Figure 7. Probability of predicted distribution for L. circinnatum
Figure 8. The response curves of morphological characteristics and NDVI to the L. circinnatum existence probability
According to important morphological factors, the model identified the preferable elevation and slope gradient for the high probability presence of L. circinnatum, which was less than 800 m a.s.l. with a flat to moderately steep slope gradient (8% - 22%). These areas were gently undulating terrain with a south-to-west-facing slope aspect. The desirable elevation and slope findings are consistent with conclusions by Susila et al. [46], which documented the exploration of L. circinnatum in the West and East Rinjani FMU. Their study found the L. circinnatum at an elevation of 30-400 m a.s.l. and slope gradient from flat to steep. Wahyuningsih et al. [47] also found the L. circinnatum at an elevation of higher than 500 m a.s.l. in their study of climbing trees for the species in the natural forest of Lombok Island. According to herbarium specimens in Herbarium Bogoriense, Bogor, Indonesia, this fern was also distributed at an elevation of up to 1,000 m a.s.l. In addition, Bidin and Jaman [48] stated that the habitat of L. circinnatum (Burn. F) was generally at low or medium elevation. The preferred elevation and slope were also in accordance with the results of a study on SDM for Gymnocarpium appalachianum fern using the Maxent model, where this fern is spatially distributed at low elevations with varying slope gradients [49].
According to Zou et al. [50], slope, aspect, and elevation are frequently utilized as oblique indicators of the distribution of vegetation and are crucial for understanding the spatial distribution of species in mountainous environments. These morphological traits influence the local temperature’s spatial variations, precipitation, and soil qualities, which are essential for vegetation growth and consequently influence the vegetation’s spatial distribution. Slight elevation changes in mountainous topology can have a noteworthy effect on the microclimate, particularly concerning localized temperature and precipitation characteristics [51]. Because the aspect controls the quantity of solar radiation received, it also affects the local microclimate [52]. Slopes that face south receive more solar energy and are subject to quick variations in the microclimate during the day and season. In contrast, the North-facing slope receives the least solar radiation and is subject to slow microclimate change [53]. Hydrologically, elevation and slope gradient have an essential role in controlling erosion processes and surface runoff generation, which impact the distribution of soil properties, particularly in hillslope areas [54]. Due to variations in solar irradiation and evapotranspiration, several soil characteristics, including pH, soil moisture, and organic matter, also varied significantly [55]. Another study by Hamid et al. [53] found that aspect, slope, and elevation affect the patterns of vegetation distribution by influencing the distribution of soil nutrients and water availability.
As the fern species live on the forest floor, L. circinnatum distribution is also controlled by light availability [47]. This study revealed that the vegetation coverage represented by NDVI values is the essential variable. The high probability of L. circinnatum was found in the low to moderate density of vegetation indicated by low values of NDVI (0.05-0.35), where sufficient light was available. This finding agrees with several studies of understory species distribution. For example, Revillini et al. [56] found that C4 grass species tended to grow in an exposed environment with abundant light availability. Liu et al. [57] concluded that sapling species distribution varied with canopy openness. Another study found that Lygodium, including L. circinnatum, not only thrives in an understory environment but is also able to colonize open disturbed forest ecosystems [45]. Additionally, several studies revealed that light availability limited the growth and development of vegetation on the forest floor. The spatial distribution pattern of light availability within forest stands is expected to affect the distribution of understory species, including fern species [58].
Based on the low important factor, the higher TWI values of the high presence probability of L. circinnatum indicated that the species generally was laid where the overland flow accumulated. The location also has convex, linear, or concave surface curvature designated by curvature values. The TPI value showed that the species were dominantly found at the lower slope position, such as toeslope, footslope, and flat slope. Setiawan et al. [27] confirmed that a lower slope position is characterized by a low to medium slope gradient, low TPI, high TWI, and concave or linear surface curvature.
According to the predicted slope position where the L. circinnatum takes place, the characteristics of the lower slope position are related to soil moisture. The overland flow from the higher slope gathers at the lower slope position. It was also noted in earlier research by Setiawan et al. [27] that in comparison to the upper slope position, the lower slope position had a higher soil moisture content. The differences in spatial soil moisture influence the variability of a good soil environment for plant growth and its distribution. The study of relationships between vegetation, soil, and topography in a dry, warm river valley in SW China concluded that soil moisture was essential for plant diversity and distribution [59]. In addition, Lygodium circinnatum is primarily found in wet soils and never in places where the soil becomes seasonally dry [60].
The impact of the edaphic variable on the species was not included in the scope of this study. It is advised to consider edaphic variables in understanding the L. circinnatum distribution and predicting the species' future distribution, especially under changing climate conditions. Because of the high correlation between morphological characteristics and soil properties, we recognize that spatial variations in edaphic variables could potentially impact the distribution and richness of L. circinnatum at the local scale.
3.3 Policy implications
The probabilistic distribution map of L. circinnatum in the forest area of Mount Rinjani would assist the forest management authorities as the starting point for species conservation and management. The spatial distribution information can be utilized for a more thorough resource inventory and decision-making process related to species conservation, particularly in creating management interventions. Some management intervention strategies that can be implemented to ensure the species’ sustainability are the maintenance of existing plants and setting harvesting times. Recognizing the influence of morphological characteristics and vegetation coverage on Lygodium circinnatum spatial variability is valuable in species domestication through ex-situ cultivation, including the propagation method.
The results of this study can also have significant socio-economic and institutional implications [3]. A more profound comprehension of these species’ distribution offers opportunities for local economic development. Local communities can optimize the use of these natural resources to increase their income through economic activities such as cultivation, collection, processing, and marketing of products related to these crops without ignoring the sustainability aspect of the species. Furthermore, this study highlights the importance of collaboration between various stakeholders in an institutional context. Government agencies, NGOs, and local communities can work together to design sustainable policies by better understanding the environmental factors affecting the distribution of L. circinnatum. The involvement of local communities in data collection and habitat mapping can also strengthen regional capacity in natural resource management and environmental conservation.
In addition, this research provides a solid scientific basis for decision-making in sustainable regional development planning. Information on species distribution and environmental factors can be used in land-use planning, sustainable tourism development, market development, and conservation efforts [61]. It highlights the importance of integrating science, policy, and community participation to achieve sustainable development in this area.
This study examined the spatial distribution of L. circinnatum in Mount Rinjani’s forest. The species distribution was adequately modeled using the Maxent model, which had high overall performance indices. The model could also describe the essential morphological and vegetation coverage variables as the drivers of the species distribution. The relationship between environmental variables and the probability that a species will exist was sufficient to identify the habitat characteristics of the species that could be predicted.
The Maxent model demonstrated the high likelihood of the L. circinnatum distribution dominating the Western and Eastern Forest areas. The distribution of the species was controlled mainly by elevation, vegetation coverage, slope gradient, and slope aspect. The preferred habitat for L. circinnatum, based on the essential variables, consisted of low to medium elevation (0-800 m a.s.l.), low to moderate dense vegetation coverage (NDVI 0.05 - 0.35), and flat to moderately steep slope (8% - 22%) with South to West-facing aspect.
Comprehending L. circinnatum's predictive habitat is critical to defining the species conservation strategies. The conservation strategies are not only in situ but also ex-situ strategies. A species distribution map could be used to identify high-priority zones for conservation, guide habitat restoration efforts, enhance monitoring of forest areas, and control utilization of the species through regulating harvesting schedules. Domesticating the plants is an ex-situ conservation strategy to minimize local people’s dependence on L. circinnatum in forest areas.
This work is supported by West Rinjani FMU and the NTFPs Technology Research and Development Institute in field observation and measurement. The authors also highly appreciate the cooperation of the local grass collectors for the valuable information during data collection.
|
ANN |
Artificial Neural Networks |
|
AUC |
Area Under Curve |
|
DEM |
Digital Elevation Model |
|
GAM |
Generalized Additive Model |
|
GIS |
Geographic Information System |
|
GLM |
Generalized Linear Model |
|
GPS |
Global Positioning System |
|
LR |
Logistic Regression |
|
MARS |
Multivariate Adaptive Regression Spline |
|
m a.s.l. |
Meters Above Sea Level |
|
Maxent |
Maximum Entropy |
|
NDVI |
Normalized Difference Vegetation Index |
|
NTFPs |
Non-timber forest products |
|
ROC |
Receiver Operator Characteristic |
|
SDM |
Species Distribution Model |
|
SVM |
Support Vector Machine |
|
TPI |
Topographic Position Index |
|
TSS |
True Skill Statistic |
|
TWI |
Topographic Wetness Index |
|
UTM |
Universal Transverse Mercator |
[1] Sebayang, A.F., Indratno I, Sebayang, L.K. (2020). Local economic innovation. International Journal of Economics Development Research, 1(2): 150-165. https://doi.org/10.37385/ijedr.v1i2.65
[2] Cicuzza, D. (2021). Lygodium circinnatum (Burm. f.) Sw. Lygodiaceae. In Ethnobotany of the Mountain Regions of Southeast Asia, pp. 633-638. https://doi.org/10.1007/978-3-030-14116-5_64-1
[3] Cunningham, A.B., Brinckmann, J.A. (2023). Smoke and mirrors: The global trade in Fern (Lygodium circinnatum) fiber basketry. Economic Botany, 77(3): 243-266. https://doi.org/10.1007/s12231-023-09576-9.
[4] Volis, S., Tojibaev, K. (2021). Defining critical habitat for plant species with poor occurrence knowledge and identification of critical habitat networks. Biodiversity and Conservation, 30(12): 3603-3611. https://doi.org/10.1007/s10531-021-02265-w
[5] Guo, L., Gao, Y., He, P., He, Y., Meng, F. (2023). Modeling for predicting the potential geographical distribution of three ephedra herbs in China. Plants, 12(4): 787. https://doi.org/10.3390/plants12040787
[6] Rubec, P.J., Santi, C.E., Ault, J.S., Monaco, M.E. (2023). Development of modelling and mapping methods to predict spatial distributions and abundance of estuarine and coastal fish species life-stages in Florida. Aquaculture, Fish and Fisheries, 3(1): 1-22. https://doi.org/10.1002/aff2.82
[7] Bansal, M., Goyal, A., Choudhary, A. (2022). A comparative analysis of K-nearest neighbor, genetic, support vector machine, decision tree, and long short term memory algorithms in machine learning. Decision Analytics Journal, 3: 100071. https://doi.org/10.1016/j.dajour.2022.100071
[8] An, X., Huang, T., Zhang, H., Yue, J., Zhao, B. (2023). Prediction of potential distribution patterns of three larix species on Qinghai-Tibet Plateau under future climate scenarios. Forests, 14(5): 1058. https://doi.org/10.3390/f14051058
[9] Zevgolis, Y.G., Kouris, A., Christopoulos, A. (2023). Spatiotemporal patterns and road mortality hotspots of herpetofauna on a Mediterranean island. Diversity, 15(4): 478. https://doi.org/10.3390/d15040478
[10] Costa, Y., Martins, I., Carvalho, G.C., Barros, F. (2022). Sea-level rise effects on macrozoobenthos distribution within an estuarine gradient using Species Distribution Modeling. Ecological Informatics, 71: 101816. https://doi.org/10.1016/j.ecoinf.2022.101816
[11] Edara, G.R., Reddy, A.R. (2025). Interpretable deep learning framework for early classification of tomato and grapevine leaf diseases. Acadlore Transactions on AI and Machine Learning, 4(3): 174-185. https://doi.org/10.56578/ataiml040303
[12] Salako, G., Russell, D.J., Stucke, A., Eberhardt, E. (2023). Assessment of multiple model algorithms to predict earthworm geographic distribution range and biodiversity in Germany: Implications for soil-monitoring and species-conservation needs. Biodiversity and Conservation, 32(7): 2365-2394. https://doi.org/10.1007/s10531-023-02608-9
[13] Arisanti, R., Syarnurli, A.P., Destin, D., Febrianti, M.R., Hidayat, Y., Ginanjar, I., Purwandari, T. (2024). Modeling air quality determinants in Indonesia using generalized linear models for sustainable development. Challenges in Sustainability, 12(3): 219-236. https://doi.org/10.56578/cis120305
[14] Erickson, K.D., Smith, A.B. (2023). Modeling the rarest of the rare: A comparison between multi-species distribution models, ensembles of small models, and single‐species models at extremely low sample sizes. Ecography, 2023(6): e06500. https://doi.org/10.1111/ecog.06500
[15] Hallgren, W., Santana, F., Low-Choy, S., Zhao, Y., Mackey, B. (2019). Species distribution models can be highly sensitive to algorithm configuration. Ecological Modelling, 408: 108719. https://doi.org/10.1016/j.ecolmodel.2019.108719
[16] Mowry, S., Moore, S., Achee, N.L., Fustec, B., Perkins, T.A. (2025). Improving distribution models of sparsely documented disease vectors by incorporating information on related species via joint modeling. Ecography, 2025(3): e07253. https://doi.org/10.1111/ecog.07253
[17] Eshetae, M.A., Hailu, B.T., Demissew, S. (2021). Spatial characterization and distribution modelling of Ensete ventricosum (wild and cultivated) in Ethiopia. Geocarto International, 36(1): 60-75. https://doi.org/10.1080/10106049.2019.1588392
[18] Jones, A., Bruce, E., Davies, K.P., Blewitt, M., Sheehan, S. (2019). Assessing potential environmental influences on killer whale (Orcinus orca) distribution patterns in the Bremer Canyon, south-west Australia. Australian Geographer, 50(3): 381-405. https://doi.org/10.1080/00049182.2019.1602901
[19] Boogar, A.R., Salehi, H., Pourghasemi, H.R., Blaschke, T. (2019). Predicting habitat suitability and conserving Juniperus spp. habitat using SVM and maximum entropy machine learning techniques. Water, 11(10): 2049. https://doi.org/10.3390/w11102049
[20] Yan, H., Feng, L., Zhao, Y., Feng, L., Zhu, C., Qu, Y., Wang, H. (2020). Predicting the potential distribution of an invasive species, Erigeron canadensis L., in China with a maximum entropy model. Global Ecology and Conservation, 21: e00822. https://doi.org/10.1016/j.gecco.2019.e00822
[21] Yang, L., Zhu, X., Song, W., Shi, X., Huang, X. (2024). Predicting the potential distribution of 12 threatened medicinal plants on the Qinghai‐Tibet plateau, with a maximum entropy model. Ecology and Evolution, 14(2): e11042. https://doi.org/10.1002/ece3.11042
[22] Lai, J., Wang, Y., Huang, T., Lyu, Y., Zhao, Y., Liu, J. (2024). Maximum entropy analysis of bird diversity and environmental variables in Nanjing Megapolis, China. Sustainability, 16(5): 2139. https://doi.org/10.3390/su16052139
[23] Saputra, M.H., Humaida, N., Hadiyan, Y. (2023). Smart farming: Modeling distribution of Xanthomonas campestris pv. oryzae as a leaf blight-causing bacteria in rice plants. IOP Conference Series: Earth and Environmental Science, 1133: 012026. https://doi.org/10.1088/1755-1315/1133/1/012026
[24] Kaky, E., Nolan, V., Alatawi, A., Gilbert, F. (2020). A comparison between Ensemble and MaxEnt species distribution modelling approaches for conservation: A case study with Egyptian medicinal plants. Ecological Informatics, 60: 101150. https://doi.org/10.1016/j.ecoinf.2020.101150
[25] Zhao, Z., Xiao, N., Shen, M., Li, J. (2022). Comparison between optimized MaxEnt and random forest modeling in predicting potential distribution: A case study with Quasipaa boulengeri in China. Science of the Total Environment, 842: 156867. https://doi.org/10.1016/j.scitotenv.2022.156867
[26] Salehi, A., Nasrollahi, N. (2024). Assessing vegetation distribution based on geometrical and morphological characteristics of the urban fabric to provide thermal comfort for pedestrians: A case study in Sanandaj. Sustainable Cities and Society, 104: 105297. https://doi.org/10.1016/j.scs.2024.105297
[27] Setiawan, O., Sartohadi, J., Hadi, M.P., Mardiatno, D. (2020). Infiltration characterization using principal component analysis and K-means cluster analysis on quaternary volcanic landscape at the southern flank of Rinjani Volcano, Lombok Island, Indonesia. Physical Geography, 41(3): 217-237. https://doi.org/10.1080/02723646.2019.1620526
[28] Luo, P., Zhang, M., Zhou, S. (2024). Research on the reconstruction of aquatic vegetation landscape in coal mining subsidence wetlands based on ecological water level. Water, 16(10): 1339. https://doi.org/10.3390/w16101339
[29] Técher, D., Berthier, E. (2023). Supporting evidences for vegetation-enhanced stormwater infiltration in bioretention systems: A comprehensive review. Environmental Science and Pollution Research, 30(8): 19705-19724. https://doi.org/10.1007/s11356-023-25333-w
[30] Ferchichi, A., Abbes, A.B., Barra, V., Farah, I.R. (2022). Forecasting vegetation indices from spatio-temporal remotely sensed data using deep learning-based approaches: A systematic literature review. Ecological Informatics, 68: 101552. https://doi.org/10.1016/j.ecoinf.2022.101552
[31] Nandini, R., Narendra, B.H. (2011). Kajian perubahan curah hujan, suhu dan tipe iklim pada zone ekosistem di Pulau Lombok. Jurnal Analisis Kebijakan Kehutanan, 8(3): 228-244. https://doi.org/10.20886/jakk.2011.8.3.228-244
[32] Reyes-García, V., Fernández-Llamazares, Á., Aumeeruddy-Thomas, Y., Benyei, P., et al. (2022). Recognizing indigenous peoples’ and local communities’ rights and agency in the post-2020 Biodiversity Agenda. Ambio, 51(1): 84-92. https://doi.org/10.1007/s13280-021-01561-7
[33] Suratno, N. (1994). Peta Geologi dan Potensi Bahan Galian Nusa Tenggara Barat. Lembar Lombok dan Sumbawa. Sekala, 1(250.000).
[34] Hirzel, A., Guisan, A. (2002). Which is the optimal sampling strategy for habitat suitability modelling. Ecological Modelling, 157(2-3): 331-341. https://doi.org/10.1016/S0304-3800(02)00203-X
[35] Colgan, M.S., Asner, G.P., Levick, S.R., Martin, R.E., Chadwick, O.A. (2012). Topo-edaphic controls over woody plant biomass in South African savannas. Biogeosciences, 9(5): 1809-1821. https://doi.org/10.5194/bg-9-1809-2012
[36] Kyriazos, T., Poga, M. (2023). Dealing with multicollinearity in factor analysis: The problem, detections, and solutions. Open Journal of Statistics, 13(3): 404-424. https://doi.org/10.4236/ojs.2023.133020
[37] Phillips, S.J., Dudík, M. (2008). Modeling of species distributions with Maxent: New extensions and a comprehensive evaluation. Ecography, 31(2): 161-175. https://doi.org/10.1111/j.0906-7590.2008.5203.x
[38] Low, B.W., Zeng, Y., Tan, H.H., Yeo, D.C. (2021). Predictor complexity and feature selection affect Maxent model transferability: Evidence from global freshwater invasive species. Diversity and Distributions, 27(3): 497-511. https://doi.org/10.1111/ddi.13211
[39] Nguyen, D., Leung, B. (2022). How well do species distribution models predict occurrences in exotic ranges? Global Ecology and Biogeography, 31(6): 1051-1065. https://doi.org/10.1111/geb.13482
[40] Vernooij, J.E.M., Koning, N.J., Geurts, J.W., Holewijn, S., Preckel, B., Kalkman, C.J., Vernooij, L.M. (2023). Performance and usability of pre‐operative prediction models for 30‐day peri‐operative mortality risk: A systematic review. Anaesthesia, 78(5): 607-619. https://doi.org/10.1111/anae.15988
[41] Zaniewski, A.E., Lehmann, A., Overton, J.M. (2002). Predicting species spatial distributions using presence-only data: A case study of native New Zealand ferns. Ecological Modelling, 157(2-3): 261-280. https://doi.org/10.1016/S0304-3800(02)00199-0
[42] Mi, X., Feng, G., Hu, Y., Zhang, J., et al. (2021). The global significance of biodiversity science in China: An overview. National Science Review, 8(7): nwab032. https://doi.org/10.1093/nsr/nwab032
[43] Wengert, G.M., Higley, J.M., Gabriel, M.W., Rustigian-Romsos, H., Spencer, W.D., Clifford, D.L., Thompson, C. (2021). Distribution of trespass cannabis cultivation and its risk to sensitive forest predators in California and Southern Oregon. PloS One, 16(9): e0256273. https://doi.org/10.1371/journal.pone.0256273
[44] Wang, B., Zhang, G., Duan, J. (2015). Relationship between topography and the distribution of understory vegetation in a Pinus massoniana forest in Southern China. International Soil and Water Conservation Research, 3(4): 291-304. https://doi.org/10.1016/j.iswcr.2015.10.002
[45] Umair, M., Hu, X., Cheng, Q., Ali, S., Ni, J. (2023). Distribution patterns of fern species richness along elevations the Tibetan Plateau in China: Regional differences and effects of climate change variables. Frontiers in Plant Science, 14: 1178603. https://doi.org/10.3389/fpls.2023.1178603
[46] Susila, I.W.W., Setiawan, O., Hidayatullah, M. (2019). Potency and growth habitat of Lygodium circinnatum (Burn. F.) Swartz) in Lombok. Jurnal Penelitian Hutan Tanaman, 16(2): 103-114. https://doi.org/10.20886/jpht.2019.16.2.103-114
[47] Wahyuningsih, E., Faridah, E., Budiadi. (2017). Types of creeper plants for the growth of ketak (Lygodium circinatum(Burm.) Sw) in the natural forests of Lombok, NTB. Jurnal Sangkareang Mataram, 3(2): 16-19. https://www.sangkareang.org/index.php/SANGKAREANG/article/view/229.
[48] Bidin, A.A., Jaman, R. (1999). The pteridophytes of Tawau Hills Park, Sabah. ASEAN Review of Biodivetrsity and Environmental Conservation (ARBEC), 2: 1-11.
[49] Hay, N.M., Akinwuntan, J.V., Cai, V., Windham, M.D., Pryer, K.M. (2023). Exploring past and future distributions of the rare Appalachian oak fern using MaxEnt modeling. American Fern Journal, 113(2): 109-125. https://doi.org/10.1640/0002-8444-113.2.109
[50] Zou, L., Tian, F., Liang, T., Eklundh, L., et al. (2023). Assessing the upper elevational limits of vegetation growth in global high-mountains. Remote Sensing of Environment, 286: 113423. https://doi.org/10.1016/j.rse.2022.113423
[51] Watson, A., Kralisch, S., Künne, A., Fink, M., Miller, J. (2020). Impact of precipitation data density and duration on simulated flow dynamics and implications for ecohydrological modelling of semi-arid catchments of Southern Africa. Journal of Hydrology, 590: 125280. https://doi.org/10.1016/j.jhydrol.2020.125280
[52] Zhu, J., Feng, J., Lu, J., Chen, Y., Li, W., Lian, P., Zhao, X. (2023). A review of the influence of courtyard geometry and orientation on microclimate. Building and Environment, 236: 110269. https://doi.org/10.1016/j.buildenv.2023.110269
[53] Hamid, M., Khuroo, A.A., Malik, A.H., Ahmad, R., Singh, C.P. (2021). Elevation and aspect determine the differences in soil properties and plant species diversity on Himalayan Mountain summits. Ecological Research, 36(2): 340-352. https://doi.org/10.1111/1440-1703.12202
[54] Li, L., Liu, J., Liu, H., Sun, B., Zhang, Z., Shi, Z., Ren, F., Li, J. (2024). Effects of hillslope aspect on erosion rate of alpine meadows in the Three-River Headwater Region, China. Catena (Amst) 239: 107971. https://doi.org/10.1016/j.catena.2024.107971
[55] Semeraro, S., Kipf, P., Le Bayon, R.C., Rasmann, S. (2023). Solar radiation explains litter degradation along alpine elevation gradients better than other climatic or edaphic parameters. Frontiers in Microbiology, 14: 1152187. https://doi.org/10.3389/fmicb.2023.1152187
[56] Revillini, D., Reich, P.B., Johnson, N.C. (2024). Plant diversity and functional identity drive grassland rhizobacterial community responses after 15 years of CO2 and nitrogen enrichment. Journal of Ecology, 112: 817-831. https://doi.org/10.1111/1365-2745.14271
[57] Liu, D., Zhou, C., He, X., Lei, X., Zhang, H., Liu, X. (2024). Exploring the role of canopy triangular units in analysing canopy effects on saplings. Forest Ecology and Management, 552: 121572. https://doi.org/10.1016/j.foreco.2023.121572
[58] Denslow, J.S., Guzman, G.S. (2000). Variation in stand structure, light and seedling abundance across a tropical moist forest chronosequence, Panama. Journal of Vegetation Science, 11: 201-212. https://doi.org/10.2307/3236800
[59] Xu, X.L., Ma, K.M., Fu, B.J., Song, C.J., Liu, W. (2008). Relationships between vegetation and soil and topography in a dry warm river valley, SW China. Catena, 75(2): 138-145. https://doi.org/10.1016/j.catena.2008.04.016
[60] Sharma, M., Devi, A., Badola, R., Sharma, R.K., Hussain, S.A. (2023). Impact of management practices on the tropical riverine grasslands of Brahmaputra floodplains: Implications for conservation. Ecological Indicators, 151: 110265. https://doi.org/10.1016/j.ecolind.2023.110265
[61] Sisriany, S., Furuya, K. (2024). Understanding the spatial distribution of ecotourism in Indonesia and its relevance to the protected landscape. Land (Basel), 13: 370. https://doi.org/10.3390/land13030370