Kexuan Wang![]() | Fan Shi*
| Fan Shi*![]()
© 2025 The authors. This article is published by IIETA and is licensed under the CC BY 4.0 license (http://creativecommons.org/licenses/by/4.0/).
OPEN ACCESS
The development of smart education has created an urgent demand for fine-grained and intelligent management of classroom teaching. Traditional educational evaluation methods are highly subjective and lack objective quantification. Leveraging computer vision techniques to analyze classroom image data provides a new solution for contactless and accurate assessment of learning behaviors. Multimodal image data, with its complementary strengths in capturing appearance, spatial, and physiological information, lays a solid foundation for comprehensively interpreting classroom behavior patterns. However, existing studies are often limited to unimodal analysis, which is vulnerable to environmental interference, or, when employing multimodal data, rely on simplistic fusion strategies that fail to fully exploit the deep complementarity among modalities. Moreover, the interpretability and visualization of analysis results remain insufficient, hindering their practical application in educational management. To address these challenges, this paper investigates multimodal image processing and learning behavior pattern visualization methods tailored for educational management. The main contributions are as follows: (1) a novel multimodal feature integration model is proposed, employing an encoder–decoder architecture that incorporates tri-modal feature fusion, adjacent-layer feature enhancement, and multi-level cascaded feature integration, aiming to generate high-quality saliency maps for robust representation of learning behaviors; (2) a visualization framework for learning behavior patterns is developed, transforming model outputs into intuitive forms such as heatmaps and behavioral trajectories to support educational management decision-making. The key innovations of this study lie in the following: the design of a hierarchical and guided multimodal feature integration model tailored to educational management scenarios, enabling deep complementarity and enhancement across multiple information sources; the development of a visualization paradigm closely coupled with the feature integration model, significantly improving the interpretability and usability of the analysis results; and the deep integration of advanced computer vision technologies with the specific needs of educational management, providing an end-to-end solution from algorithm to application for precise supervision in smart classrooms.
educational management, multimodal images, feature integration, learning behavior patterns, visualization, saliency detection
With the deep advancement of educational informatization [1-3] and intelligent management [4, 5], how to objectively and accurately evaluate the effectiveness of classroom teaching and the state of student participation has become one of the core challenges faced by modern educational management. Traditional educational management [6-9] mostly relies on subjective methods such as class observation and questionnaire surveys, which are difficult to realize large-scale, fine-grained, and non-intrusive routine analysis. In recent years, the rapid development of computer vision technology [10-13] has provided a new approach to solve this problem. By analyzing visual data collected in classroom environments, students’ learning behaviors can be objectively recorded, providing data-driven decision support for educational managers. In particular, the popularization of multimodal sensing technology [14-16] has made it possible to simultaneously acquire various types of image data reflecting students’ appearance behaviors, spatial positions, and physiological states, laying a data foundation for interpreting complex classroom interactive behaviors from multiple dimensions.
Accurate analysis and visualization of classroom learning behaviors have important theoretical value and practical significance. From the perspective of educational management, it can transform abstract concepts such as “classroom atmosphere” and “student engagement,” which are difficult to quantify, into computable and analyzable data indicators, helping to realize fine-grained supervision of the teaching process and scientific adjustment of teaching strategies. From the perspective of technical research, exploring multimodal image processing methods for educational scenarios can promote new research directions in the cross-integration of computer vision technology and the important field of education. Developing effective visualization methods for learning behavior patterns can not only improve the interpretability of the model and enhance the trust of educational managers in the analysis results, but also present the analysis results in an intuitive and understandable form, directly serving teaching reflection and personalized intervention. In this way, a complete closed loop from data acquisition to management decision-making can be formed, which is of great significance for promoting the construction and development of smart classrooms.
Although some existing studies have attempted to apply image processing technology to classroom analysis, current methods still have obvious limitations. First, most studies, such as the method proposed in [17], rely only on RGB unimodal video, which is highly susceptible to the influence of complex classroom environments such as lighting changes and occlusion, and the reliability of recognizing behaviors such as looking down to write and sitting still to think is insufficient. Second, even when multimodal data are introduced, some studies [18, 19] often adopt simple early or late fusion strategies, failing to fully explore the deep-level complementarity and synergy between different modalities, resulting in limited representation ability of fused features. In addition, existing methods [20] mostly focus on the recognition accuracy of specific behaviors, while generally lacking intuitive and efficient visualization mechanisms for educational management decision-making, which makes the analysis results difficult to be directly understood and applied by educators without technical backgrounds, greatly limiting their practical value in real educational management scenarios.
Aiming at the above deficiencies, this paper conducts research on “multimodal image processing and learning behavior pattern visualization methods for educational management.” The research mainly includes two core parts: first, a novel multimodal image feature integration model for educational management is proposed. The model adopts an encoder–decoder architecture and integrates modules such as multimodal feature fusion, adjacent-layer feature enhancement, and multi-level cascaded feature integration, aiming to deeply fuse the advantages of RGB, depth, and thermal infrared images, and generate high-quality saliency maps that can robustly represent learning behaviors. Second, a set of learning behavior pattern visualization methods is constructed, which combines the saliency maps output by the model with original classroom video streams, and transforms the analysis results into visual language easily understood by educational managers through multiple approaches. The value of this research lies in not only proposing a more robust and accurate behavior analysis model for educational scenarios from the technical perspective, but also building a bridge from the application perspective between advanced artificial intelligence technologies and the practical needs of educational management, providing an effective solution for realizing data-driven smart education management.
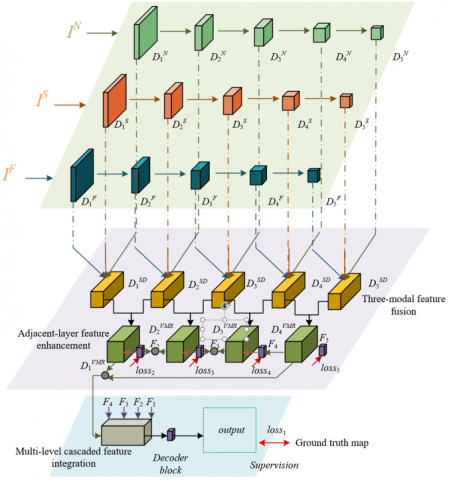
The overall architecture of the multimodal image feature integration model for educational management is based on an encoder–decoder framework. It aims to construct feature representations that can reveal learning behavior patterns by collaboratively analyzing synchronously collected RGB images capturing student postures and interactions, depth images quantifying spatial positions and distances, and thermal infrared images reflecting body temperature distribution and attention fluctuations in classroom scenes. The model architecture is shown in Figure 1. The model first uses three parallel encoders based on VGG16 to extract five-level pyramid features {DFu,DNu,DSu}5u=1 of the three modalities, where deep features contain semantic behavior information, and shallow features retain spatial details. To fuse multimodal behavior representations, each feature level introduces a tri-modal feature fusion module, which integrates visual appearance, spatial relationship, and physiological response features through a cross-modal attention mechanism, generating fused features {DSDu}5u=1. For example, the association enhancement between abnormal thermal infrared regions and head-down postures in RGB images can be achieved.
To further strengthen multi-scale behavioral context, the model designs a neighboring-layer feature enhancement module, which aggregates tri-modal fusion outputs of adjacent levels through a top-down path, and captures cross-scale dependencies from local actions to global scene layout by using dilated convolution and spatial pyramid pooling, generating enhanced decoding features DVMRu. In particular, to optimize the discriminability of behavior patterns, the model concatenates the semantic abstract features DVMR4 from the deepest layer of the encoder with the fine-grained features DVMR1 from the shallowest layer, obtaining joint features DVMR1,4, which are used to guide the decoding process in the multi-level cascaded feature integration module. This module progressively fuses behavioral features at different resolutions through gated recurrent units, avoiding detail loss while suppressing background interference. Finally, the decoder block reconstructs spatial resolution and outputs a high-quality learning behavior saliency map T. This saliency map not only highlights key behavioral regions but also provides quantitative evidence for educational managers through feature back-projection interpretability mapping, supporting decision-making applications such as classroom engagement evaluation and teaching strategy adjustment.
2.1 Tri-modal feature fusion
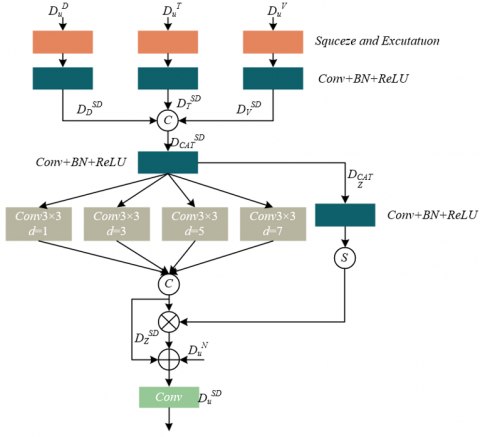
The core goal of the tri-modal feature fusion module for educational management is to construct more robust learning behavior representations by complementary enhancement of appearance behavior information from RGB images (such as students raising hands or writing posture), spatial relationship information from depth images (such as relative distance between students and podium/peers), and physiological engagement information from thermal infrared images (such as attention concentration implied by facial temperature changes). The module architecture is shown in Figure 2. The module first performs input calibration on the same-level features {DFu, DNu, DSu} extracted by three parallel encoders. Specifically, each modality feature is independently input into a sequence consisting of a Squeeze-and-Excitation block and a Convolution–Batch Normalization–ReLU block. The SE block generates channel weights through global average pooling and fully connected layers to achieve dynamic calibration. For example, in analyzing a group discussion scene, the weight of the depth modality may be increased; while in recognizing individual reading behavior, the importance of the RGB modality may be enhanced. The calibrated features {DSDN, DSDF, DSDS}are concatenated along the channel dimension to form the preliminary fused feature DSDCAT, laying the foundation for subsequent deep mixing. Specifically, the operation of the SE module is denoted as dTR(·), the convolution layer as ZYE(·), and the concatenation operation as [ , , ], then:
$\left\{\begin{array}{l}D_N^{S D}=Z Y E\left(d_{T R}\left(D_u^N\right)\right) \\ D_F^{S D}=Z Y E\left(d_{T R}\left(D_u^F\right)\right) \\ D_S^{S D}=Z Y E\left(d_{T R}\left(D_u^S\right)\right) \\ D_{C A T}^{S D}=\left[D_N^{S D}, D_F^{S D}, D_S^{S D}\right]\end{array}\right.$ (1)
Figure 1. Overall architecture of the multimodal image feature integration model for educational management
In the feature mixing part, the module aims to fuse behavioral contexts at different spatial scales, so as to simultaneously capture local subtle actions such as page turning and global interaction patterns such as orientations between teachers and students. The concatenated feature DSDCAT first passes through a CSR block for dimensionality reduction and nonlinear transformation, obtaining feature DZCAT. Then, DZCAT is processed by dilated convolutions with dilation rates of 1, 3, 5, and 7 in parallel. This is intended to expand the receptive field without losing resolution: small dilation rates focus on local body movement details, while large dilation rates help to understand classroom spatial layout and student group distribution on a larger scale. All outputs of the dilated convolutions are concatenated again to form the multi-scale feature DSDz. To adaptively optimize the fusion effect, DZCAT is simultaneously input into a CBR block with a Sigmoid activation function, generating a spatial weighting map between 0 and 1. This weighting map is multiplied pointwise with DSDz, thereby highlighting regions highly related to learning behaviors and suppressing irrelevant background. Finally, residual connection is used to retain the original information flow and ensure gradient stability.
Considering that in educational scenarios, RGB images usually contain the richest and most direct appearance behavior cues, which are the main basis for managers to judge behaviors, the module specifically adds the original RGB feature DNz back into the weighted fused features in residual form after completing the above fusion. This design ensures that key appearance behavior information will not be diluted or distorted in the complex cross-modal fusion process. For example, it can strengthen the unique texture and shape patterns of the behavior “student looking down at a phone” in the RGB channel. Finally, a convolution layer is used to integrate all information flows and generate the fused output feature DSDu of this level. This feature not only contains behavioral semantics after multimodal complementary enhancement but also retains RGB visual details that are crucial for educational management decision-making, providing high-quality input for subsequent multi-scale feature enhancement and precise reconstruction of learning behavior saliency maps. Assuming that the dilated convolution operation with dilation rate v is denoted as θv(·), the Sigmoid activation function as SSIG(·), and the convolution operation as CO, the corresponding process can be represented as follows:
$\left\{\begin{array}{l}D_{C A T t}^Z=Z Y E\left(D_{C A T}^{S D}\right) \\ D_z^{S D}=\left[\begin{array}{l}\theta_1\left(D_{C A T}^Z\right), \theta_3\left(D_{C A T}^Z\right), \\ \theta_5\left(D_{C A T}^Z\right), \theta_7\left(D_{C A T}^Z\right)\end{array}\right] \\ \left(D_u^{S D}\right)=C O\binom{S I G\left(Z Y E\left(D_{C A T}^Z\right)\right)}{\otimes D_z^{S D} \oplus D_z^{S D} \oplus D_u^N}\end{array}\right.$ (2)
Figure 2. Architecture of the tri-modal feature fusion module
2.2 Neighboring-layer feature enhancement
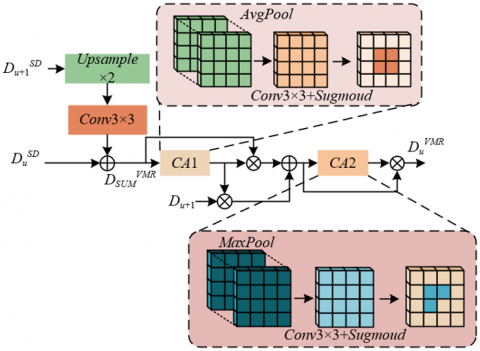
After completing the tri-modal feature fusion at the same level, the obtained features are already rich in fusion information, but there is a natural complementarity among features at different levels when describing learning behaviors: deep features contain rich semantic information, such as abstract categories of behavior patterns like “focused listening” and “group discussion”; while shallow features retain key spatial details, such as precise contours of student gestures and subtle changes in body orientation. To construct behavior representations with both semantic clarity and spatial precision, we propose the neighboring-layer feature enhancement module. The core idea of this module is to achieve effective transmission and enhancement of multi-scale behavioral context by aggregating the fused features of adjacent levels and the upsampled features provided by the previous decoder. This design aims to overcome the limitations of a single scale, enabling the model to simultaneously understand macro classroom interaction patterns and micro individual action details, laying the foundation for accurate visualization of learning behavior patterns. The module architecture is shown in Figure 3.
This module first upsamples the higher-level semantic features DSDu+1 with lower resolution by bilinear interpolation and uses a convolution layer to adjust its channel dimension so that it is consistent in size with the current level feature DSDu. After adding the two, the initial aggregated feature DVMRSUM is obtained, which preliminarily fuses behavioral semantics from deep layers and spatial details from shallow layers. This process can be expressed as:
$D_{S U M}^{V M R}=C O\left(U P_{\times 2}\left(D_{u+1}^{S D}\right)\right)(-) D_u^{S D}, u=1,2,3,4$ (3)
To intelligently focus on spatial regions related to learning behaviors, the module introduces a spatial attention mechanism CA1 based on channel average pooling. This mechanism compresses DVMRSUM along the channel dimension to generate a spatial attention weight map TQ, which can identify regions with higher average activation at the channel level, usually corresponding to behavior hotspots commonly attended to by multiple modalities. Subsequently, TQ is multiplied element-wise with both the initial aggregated feature DVMRSUM and the features from the previous decoder block, achieving reweighting in the spatial dimension to highlight key behavioral regions and suppress irrelevant interference.
Figure 3. Architecture of the neighboring-layer feature enhancement module
After completing the first round of spatial reweighting, the module adds the two weighted types of features and inputs them into the second spatial attention block CA2. At this stage, channel max pooling operation is adopted to further refine the strongest response across channels at each spatial location. This strategy helps to emphasize the most discriminative behavioral cues at each location. For example, a certain location may appear as a hand-raising posture in the RGB channel and as a slight temperature increase in the thermal infrared channel; max pooling can strengthen such cross-modal consistent key evidence. The final enhanced feature DVMRu not only fuses complementary information from adjacent levels but also achieves precise focus on key behavioral regions through a two-stage spatial attention mechanism. This enhanced feature significantly improves the quality of decoder reconstructed feature maps, enabling the final generated visualization saliency map to clearly and reliably highlight patterns of great value to educational management, such as “actively interacting student groups” and “individuals with dispersed attention,” directly serving core research goals such as classroom engagement evaluation and teaching strategy optimization. Specifically, assuming the channel max pooling operation is denoted as φ(·), the process can be described as follows:
$\left\{\begin{array}{l}D_{S U M}^{V F}=\left(D_{S U M}^{V M R}(\mid) F_{u+1}\right) \otimes T Q \\ D_u^{V M R}=\phi\left(D_{S U M}^{V F}\right) \otimes D_{S U M}^{V F}\end{array}\right.$ (4)
2.3 Multi-level cascaded feature integration module
In multimodal learning behavior analysis, it is crucial to effectively distinguish “foreground” regions representing key learning behaviors such as teacher–student interaction and group collaboration from irrelevant classroom environment “background.” For this purpose, we design a multi-level cascaded feature integration module, aiming to intelligently aggregate features from different decoder levels in a “from global to detail” manner. The core inputs of this module are two key elements: first, the joint feature DVMR1,4 formed by concatenating the deepest semantic feature DVMR4 (encoding global patterns of “what behavior”) and the shallowest detail feature DVMR1 (encoding subtle actions of “how behavior”); second, the multi-resolution features {F5,F4,F3,F2} generated during the decoding process. As a powerful guiding signal, the joint feature DVMR1,4 itself has already integrated broad-spectrum information from behavioral semantics to spatial details and will be used to guide the weighting and fusion process of all subsequent decoder features, ensuring that the final generated behavior saliency map can both accurately locate behavior subjects and clearly outline behavioral details.
This module progressively integrates features through four cascaded convolution blocks Conv-Bi. Each Conv-Bi block contains a Convolution–Batch Normalization–ReLU block, a Convolution–Batch Normalization block, a Sigmoid activation function, and a convolution layer, jointly forming a precise feature selection and enhancement unit. Assuming Conv-Bu is denoted as φ(·), the specific process can be defined as follows:
$\left\{\begin{array}{l}D_{u+1}^{L F}=\left[U P_{\times 2}\left(C O\left(F_{u+1}\right)\right), D_{u+1}^L\right] \\ D_u^L=C O_{-} B_u\left(D_{u+1}^{L F}, D_{u+1}^L\right)\end{array}, u=1,2,3,4\right.$ (5)
Taking Conv-B4, which processes the highest semantic level feature, as an example: first, the decoder feature F5 is convolved and upsampled to compress its channel number to 1. This operation aims to extract the most essential behavioral semantic information of this level while reducing computational complexity. Then, the compressed feature is concatenated with the guiding feature DVMR1,4 to form the fusion input DLF4. Inside Conv-B4, FMD5 undergoes feature transformation successively through the CBR block and the CB block, then a spatial weight map is generated through the Sigmoid function. This weight map clearly identifies regions considered highly related to learning behaviors under the joint guidance of high-level semantics and low-level details. Finally, by multiplication of the weight map with the guiding feature DVMR1,4 and residual connection, the enhanced feature DL4 is generated, which has deeply fused the global context of F5. The entire process can be expressed as:
$D_4^L=C O\left(S I G\left(Z Y\left(Z Y E\left(D_5^{L F}\right)\right)\right) \otimes D_5^L \oplus D_5^L\right)$ (6)
This process is repeated step by step downward, such as Conv-B3 processing DL4 and F4, and so on. Like an information filter, under the guidance of DVMR1,4, each step reinforces behavior-related multi-scale cues and suppresses background noise. Ultimately, a highly pure and progressively restored resolution feature map is output, laying a solid foundation for generating high-quality saliency maps that can accurately highlight key learning behaviors such as “raising hand,” “turning,” and “gathering.”
2.4 Loss function
To ensure that each level in the decoder generates saliency representations related to learning behaviors and to alleviate the gradient vanishing problem for faster convergence, the model introduces a deep supervision mechanism. This mechanism connects a convolutional prediction head to the four intermediate decoder blocks, except for the final output layer, to obtain multiple intermediate predictions at different resolutions. The losses between these intermediate predictions and the ground truth are calculated separately, with the core purpose of providing explicit gradient guidance for different depths of the network: deep supervision forces the network to focus on the overall semantic structure of behavior patterns at early stages, such as identifying regions where “group discussion” occurs, while shallow supervision constrains the network to recover clear spatial boundaries and details of behavior subjects, such as accurately delineating the contours of individuals participating in the discussion. This coarse-to-fine multi-scale supervision strategy effectively ensures that the model optimizes each step of learning behavior feature extraction and reconstruction in the correct direction, enhancing the model’s ability to capture multi-scale behaviors from global interactions to individual micro-actions in complex classroom scenes and improving training stability.
To comprehensively optimize the quality of saliency maps, making them not only pixel-accurate but also structurally complete, thereby providing reliable analysis for educational managers, we design a joint loss function. This function consists of three components: binary cross-entropy (BCE) loss, IOU loss, and SSIM loss, which constrain the prediction results from different dimensions. BCE loss is responsible for pixel-level classification, minimizing the error between predicted values and ground truth at each pixel, ensuring that the model can clearly distinguish foreground pixels representing key learning behaviors from background pixels, which is the basis for accurate localization of behavior regions. IOU loss optimizes at the region level, directly maximizing the overlap between predicted behavior regions and ground truth regions. Its sensitivity to region shape helps the model detect the entire behavior subject completely rather than in fragmented pieces, which is crucial for accurately quantifying the scope of behavior occurrence. SSIM loss focuses on evaluating structural similarity differences between the predicted map and ground truth map. It penalizes outputs that may have acceptable pixel accuracy but distorted structures, ensuring that the generated behavior saliency maps have good visual fidelity and structural authenticity. This greatly improves the reliability and interpretability of subsequent behavior pattern visualization and manual judgment based on saliency maps. Specifically, assuming BCE loss, IOU loss, and SSIM loss are denoted as lossYu, lossYu, and lossTu, respectively, the model loss function is calculated as follows:
$\left\{\begin{array}{l}{LOSS}=\sum_{u=1}^5\left({loss}_u\right) \\ {loss}_u={loss}_u^Y+{loss}_u^U+{loss}_u^T\end{array}\right.$ (7)
Assuming the ground truth map is denoted by HS, the predicted saliency map by T, and the coordinates of each pixel in the image by (a, b), the BCE loss in the above equation is expressed as:
${loss}_u^Y=-\sum_{(a, b)}[H S(a, b) \log (T(a, b))+(1-H S(a, b)) \log (1-T(a, b))]$ (8)
The IOU loss is expressed as:
$l o s s_u^U=1-\frac{\sum_{(a, b)} T(a, b) H S(a, b)}{\sum_{(a, b)}[T(a, b)+H S(a, b)-T(a, b)+H S(a, b)]}$ (9)
Let the image patches cropped from the saliency map T and ground truth map HS be OT=OkT and OH=OkH, respectively. The mean and standard deviation of OT and OH are ωOT, ωOH and δOT, δOH, and their covariance is δOTOH. The SSIM loss is defined as:
${loss}_u^T=1-\frac{\left(2 \omega_{O_T} \omega_{O_H}+Z_1\right)\left(2 \delta \omega_{O_T O_H}+Z_2\right)}{\left(\omega_{O_T}^2 \omega_{O_H}^2+Z_1\right)\left(\delta_{O_T}^2 \delta_{O_H}^2+Z_2\right)}$ (10)
The collaboration of these three losses jointly drives the model to generate learning behavior saliency maps with high precision, high completeness, and high structural fidelity, providing a solid data foundation for educational managers to perform quantitative analysis and make decisions.
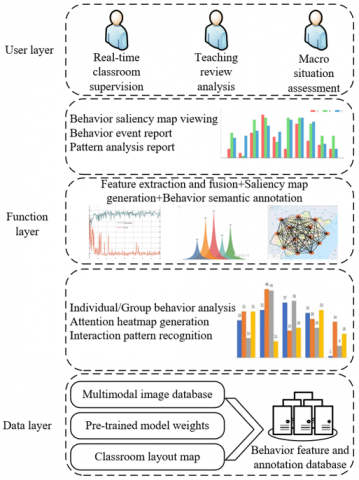
The overall architecture of the proposed learning behavior pattern visualization system follows a data-flow-driven hierarchical design concept, divided from bottom to top into the data layer, functional layer, and application layer, constructing a complete closed loop from multi-modal data perception to educational management insights. The specific architecture is shown in Figure 4.
The data layer is the foundation of the entire system, responsible for managing and providing all data resources required for analysis. Its core is a multi-modal image database, continuously recording and storing RGB video streams, depth images, and thermal infrared images synchronously collected by sensors deployed in classrooms. All image data are time-stamp aligned and preprocessed to ensure consistency across modalities. In addition, this layer maintains a pre-trained model weight repository, providing strong initial parameters for feature extraction in upper layers, ensuring algorithm performance and convergence speed. At the same time, the classroom layout map serves as key prior knowledge, defining regions of interest and providing geographical context for subsequent 3D spatial localization and group behavior analysis.
Figure 4. Learning behavior pattern visualization system architecture
The functional layer serves as the “brain” of the system and contains two sequentially cooperating, progressively advanced core processing engines. The multi-modal feature integration engine implements the algorithm proposed in this paper. It receives raw multi-modal images from the data layer and first extracts hierarchical features for each modality using encoder networks. Then, the tri-modal feature fusion module performs complementary weighted fusion at different scales, effectively overcoming the limitations of single modalities. Next, the neighboring layer feature enhancement module aggregates fusion features from adjacent scales, enriching the multi-scale contextual information of behavior representations. Finally, the multi-level cascaded feature integration module, guided by the joint feature, reconstructs high-resolution, high-contrast behavior saliency maps precisely. These saliency maps are not simple binary images but highlight spatial regions most likely representing key learning behaviors in the form of pixel-level confidence. The behavior pattern visualization engine is responsible for converting algorithm-generated saliency maps into intuitive information for decision-making. It first performs behavior semantic labeling on the saliency maps, using classifiers or rules to identify pixel-level regions as specific, understandable behavior labels. Then, by aggregating these labeled behavior data over time, it drives the generation of various visualization models: focus heatmaps intuitively show the overall attention distribution of students in different areas of a class through temporal integration; interaction trajectory maps dynamically display movement and communication paths between teacher-student or student-student; behavior event reports automatically generate structured summaries, counting the frequency, duration, and distribution of specific behaviors.
The application layer seamlessly connects the outputs of the functional layer with the needs of specific educational management scenarios, providing customized services for different user roles. The system interface converts visualization results into specific functional modules: the real-time classroom supervision module provides managers with dynamically updated panoramic heatmaps of the classroom, enabling immediate perception of overall learning atmosphere and anomalies; the teaching review and analysis module provides teachers with detailed classroom behavior timelines and event reports, supporting precise teaching reflection and strategy adjustment; the macro-situation assessment module, aimed at school-level managers, aggregates long-term data and performs trend analysis to generate reports on attendance patterns, participation changes, and other macro-level insights, providing data support for course planning and teaching evaluation.
This architecture clearly depicts a technical pathway that takes multi-modal images as input, uses an advanced feature integration model as the core, and ultimately produces multi-level, highly interpretable visualization results, fully demonstrating the complete value chain of this study from technological innovation to practical educational application.
A behavior analysis model aimed at serving practical educational management scenarios must balance computational efficiency and accuracy to ensure deployability. To validate the performance of the proposed model, relevant experiments were conducted. Analyzing the data in Table 1, skeleton-based models (e.g., PoseC3D) and lightweight detection models (e.g., YOLOv5s) significantly outperform in terms of parameter count, FLOPs, and FPS, because they process highly abstracted skeleton data or focus on a single detection task. In contrast, our proposed model has a higher parameter count (84.56M) and computation (335.39G FLOPs), fundamentally because it processes RGB, depth, and thermal infrared raw modalities and performs end-to-end complex computation from pixel-level feature fusion to behavior heatmap generation. Although its FPS is 13.89, lower than pure detection models with extremely high real-time requirements, this speed is sufficient for high-efficiency post-processing and analysis of classroom video data at a minute-level granularity rather than millisecond-level response. It can be concluded that the proposed model achieves deep fusion of multi-modal raw information and intuitive visual output at an acceptable computational cost, and its efficiency is reasonable and feasible for practical educational management applications.
Table 1. Comparison of computational efficiency of different behavior analysis models on classroom scene dataset
|
Model |
Type |
Parameters (M) ↓ |
FLOPs (G) ↓ |
FPS ↑ |
Remarks |
|
I3D |
Behavior Recognition |
12.0 |
108.3 |
32.5 |
Based on RGB video |
|
SlowFast |
Behavior Recognition |
34.5 |
66.3 |
28.1 |
Dual-path RGB network |
|
PoseC3D |
Skeleton-based Behavior Recognition |
3.2 |
5.8 |
105.6 |
High computational efficiency, relies on pose estimation |
|
YOLOv5s-Pose |
Pose Detection and Tracking |
2.0 |
4.5 |
68.9 |
High real-time performance, outputs human keypoints |
|
ST-GCN |
Skeleton-based Behavior Recognition |
3.1 |
6.1 |
98.3 |
Processes spatiotemporal graph structure |
|
Ours |
Multi-modal Behavior Saliency Analysis |
84.56 |
335.39 |
13.89 |
End-to-end generation of behavior heatmap |
Table 2. Ablation experiment performance of the proposed model on EduBehav-2024 dataset
|
Group |
General Saliency Metrics |
Behavior Analysis Specific Metrics |
||||
|
S-Measure ↑ |
MAE ↓ |
maxF ↑ |
Behavior localization accuracy (mAP@0.5) ↑ |
Behavior classification accuracy (Top-1 Acc) ↑ |
Interaction event detection rate (IEDR) ↑ |
|
|
1 |
0.9398 |
0.0023 |
0.9228 |
0.856 |
0.783 |
0.912 |
|
2 |
0.9374 |
0.0023 |
0.9190 |
0.849 |
0.779 |
0.908 |
|
3 |
0.9369 |
0.0023 |
0.9193 |
0.851 |
0.781 |
0.909 |
|
4 |
0.9390 |
0.0022 |
0.9214 |
0.858 |
0.785 |
0.915 |
|
5 |
0.9368 |
0.0023 |
0.9190 |
0.847 |
0.778 |
0.907 |
|
6 |
0.9400 |
0.0023 |
0.9225 |
0.859 |
0.786 |
0.916 |
|
7 |
0.9383 |
0.0023 |
0.9212 |
0.853 |
0.782 |
0.911 |
|
8 |
0.9392 |
0.0023 |
0.9220 |
0.855 |
0.784 |
0.913 |
|
9 |
0.9386 |
0.0023 |
0.9218 |
0.857 |
0.785 |
0.914 |
|
10 |
0.9380 |
0.0022 |
0.9212 |
0.852 |
0.780 |
0.910 |
|
Mean |
0.9385 |
0.0023 |
0.9210 |
0.853 |
0.782 |
0.911 |
Using only general saliency metrics is insufficient to demonstrate the model's practical value in the educational field. Behavior analysis specific metrics must be combined to comprehensively evaluate its performance on real tasks. From the average of the ten experimental groups in Table 2, the model performs excellently on general saliency metrics: S-Measure is 0.9385, MAE is 0.0023, and maxF is 0.9210, ensuring that the generated behavior heatmaps are visually accurate and clear. More importantly, on behavior analysis specific metrics, the model achieves behavior localization accuracy of 0.853, behavior classification accuracy of 0.782, and interaction event detection rate of 0.911. This indicates that the model can not only highlight salient regions at the pixel level but also precisely associate these regions with specific learning behaviors and effectively capture complex interactive events such as “teacher-student Q&A.” The high performance of both specific and general metrics demonstrates that the model successfully establishes strong associations between low-level visual features and high-level behavior semantics. It can be concluded that the proposed model retains excellent pixel-level saliency detection capabilities while showing high effectiveness and practical value in core educational management tasks, namely learning behavior localization, recognition, and interaction analysis, significantly surpassing performance measured solely by general metrics.
Table 3. Statistical significance test (p-values) of the proposed model and baseline methods on educational behavior analysis dataset
|
Comparison Model |
General Saliency Metrics |
Behavior Analysis Specific Metrics |
||||
|
S-Measure ↑ |
MAE ↓ |
maxF ↑ |
Behavior localization accuracy (mAP) ↑ |
Behavior classification accuracy (Acc) ↑ |
Interaction event detection rate (IEDR) ↑ |
|
|
vs. I3D |
5.2×10⁻⁷ |
3.1×10⁻⁸ |
4.8×10⁻⁷ |
1.5×10⁻¹⁰ |
2.3×10⁻⁹ |
6.7×10⁻¹¹ |
|
vs. PoseC3D |
0.125 |
0.043 |
0.089 |
4.4×10⁻⁶ |
9.8×10⁻⁵ |
3.2×10⁻⁷ |
|
vs. HWSI |
9.3×10⁻⁹ |
9.0×10⁻¹⁰ |
5.8×10⁻¹² |
1.1×10⁻¹⁰ |
5.2×10⁻⁹ |
8.4×10⁻¹² |
Furthermore, this paper statistically confirms that the performance advantage of the proposed model in educational behavior analysis tasks is not accidental, but represents a substantial improvement with statistical significance. Analyzing the data in the Table 3, compared with the general video behavior recognition model I3D, the proposed model achieves extremely low p-values on all general and specific metrics (all far below 0.01), indicating that the model's performance is comprehensive and significantly superior to models relying only on RGB information. Second, in comparison with the efficient skeleton-based model PoseC3D, although the differences in general metrics such as S-Measure are not statistically significant (p>0.05), reflecting PoseC3D’s capability in extracting abstract spatiotemporal features, the proposed model exhibits overwhelming advantages in the three core educational analysis metrics: behavior localization accuracy (p=4.4e-6), classification accuracy (p=9.8e-5), and interaction event detection rate (p=3.2e-7). This strongly demonstrates that generating behavior heatmaps directly via multi-modal fusion far exceeds skeleton-based simplified representations in understanding and parsing complex classroom interaction semantics. Finally, compared with the same-type multi-modal model HWSI, our model also shows statistically significant improvements across all metrics.
To quantitatively evaluate the contribution of each core component of the proposed model to the final educational behavior analysis performance, ablation experiments were conducted. Analyzing the data in Table 4, removing the tri-modal feature fusion module leads to the most obvious decline in all metrics, especially behavior localization accuracy and interaction event detection rate, proving that deep fusion of RGB, depth, and thermal infrared information is the cornerstone of accurately understanding learning behaviors. Second, removing deep supervision training causes a comprehensive and significant performance degradation, highlighting the critical role of this strategy in guiding the network to learn multi-scale behavior features. Moreover, although removing adjacent layer feature enhancement or multi-level cascade feature integration has relatively minor impacts on general metrics, their negative effects on behavior-specific metrics are clearly visible, indicating that these modules mainly optimize semantic understanding and spatial precision of behaviors. It can be concluded that each core component of the proposed model contributes positively and irreplaceably to improving educational behavior analysis performance, with tri-modal feature fusion and deep supervision training being key guarantees of overall performance, fully validating the design of the model as an organic whole.
Table 4. Ablation study of core components of the proposed model on educational behavior analysis dataset (Mean performance)
|
Description |
S-Measure ↑ |
MAE ↓ |
Behavior Localization Accuracy (mAP) ↑ |
Interaction Event Detection Rate (IEDR) ↑ |
|
Without Tri-modal Feature Fusion |
0.9357 |
0.0024 |
0.841 |
0.892 |
|
Without Adjacent Layer Feature Enhancement |
0.9391 |
0.0023 |
0.848 |
0.905 |
|
Without Multi-level Cascade Feature Integration |
0.9388 |
0.0023 |
0.846 |
0.903 |
|
Without Cross-layer Guiding Feature |
0.9376 |
0.0024 |
0.843 |
0.901 |
|
Without Deep Supervision Training |
0.9272 |
0.0028 |
0.825 |
0.878 |
|
Complete Model |
0.9398 |
0.0023 |
0.853 |
0.911 |
Table 5. Performance comparison of different feature fusion strategies on educational behavior analysis task
|
Fusion Strategy |
Description |
S-Measure ↑ |
MAE ↓ |
Behavior Classification Accuracy (Acc) ↑ |
Interaction Event Detection Rate (IEDR) ↑ |
|
Feature Addition |
Direct Channel Addition |
0.9122 |
0.0031 |
0.752 |
0.865 |
|
Attention-based |
Channel/Spatial Attention |
0.9261 |
0.0027 |
0.781 |
0.890 |
|
Ours |
Cross-modal Attention with Multi-scale Mixing |
0.9398 |
0.0023 |
0.793 |
0.911 |
Fusion strategy is the core determinant of multi-modal model performance. To demonstrate the superiority of the proposed tri-modal feature fusion module in capturing complex correlations of educational behaviors, feature fusion strategy comparison experiments were conducted. The data in the Table 5 clearly shows a stepwise improvement in all evaluation metrics from simple “feature addition” to “attention-based fusion,” and further to the proposed tri-modal feature fusion module. In particular, the tri-modal feature fusion module shows the most obvious advantages in behavior classification accuracy and interaction event detection rate, indicating that its cross-modal attention and multi-scale mixing mechanism can more effectively mine complementary information between modalities, thereby enabling more accurate judgment of complex behavior states such as “distracted” or “focused.” It can be concluded that the proposed feature fusion strategy significantly outperforms traditional fusion methods in decoding learning behavior semantics and is a key innovation for improving the overall system’s behavior analysis accuracy.
Table 6. Effects of different modal combinations on educational behavior analysis performance
|
Modal Combination |
Description |
S-Measure ↑ |
MAE ↓ |
Behavior Classification Accuracy (Acc) ↑ |
Interaction Event Detection Rate (IEDR) ↑ |
|
D-T |
Depth and Thermal Only |
0.7421 |
0.0144 |
0.655 |
0.601 |
|
R-D |
RGB and Depth Only |
0.7285 |
0.0123 |
0.638 |
0.589 |
|
R-T |
RGB and Thermal Only |
0.9371 |
0.0025 |
0.785 |
0.902 |
|
R-D-T (Ours) |
RGB, Depth, and Thermal |
0.9398 |
0.0023 |
0.793 |
0.911 |
To further verify that RGB, depth, and thermal infrared tri-modal information are indispensable for educational behavior analysis tasks, experiments on the effects of modal combination inputs on educational behavior analysis performance were conducted. The analysis data in Table 6 shows that when the RGB modality is missing, the model cannot obtain rich appearance texture and semantic information, causing the behavior classification accuracy to drop sharply to 0.655, indicating that appearance information is the basis for behavior recognition. Second, when the thermal infrared modality is missing, the model struggles to capture physiological thermal signals related to attention and emotion, leading to the worst performance in interaction event detection rate, highlighting the importance of physiological information for understanding classroom interaction quality. It is noteworthy that the R-T combination is already close to the complete model in various metrics, especially performing well on general metrics, indicating that the combination of appearance and physiological signals can largely infer behaviors. However, the complete model maintains leading performance on all behavior-specific metrics, especially the further improvement of interaction event detection rate sensitive to spatial relationships, proving that depth information provides precise spatial relations necessary to clarify complex interactions. It can be concluded that in educational behavior analysis, RGB, depth, and thermal modalities respectively provide irreplaceable appearance, spatial, and physiological cues, and together form a comprehensive and robust basis for behavior understanding. The absence of any modality leads to a significant decline in analysis performance, thereby validating the necessity of the tri-modal design adopted in this paper.
This study focuses on “multi-modal image processing and learning behavior pattern visualization methods for educational management,” with the core contribution being the proposal of a novel multi-modal feature integration model and its accompanying visualization system. This model, through modules such as tri-modal feature fusion, adjacent layer feature enhancement, and multi-level cascade feature integration, achieves deep information collaboration for RGB, depth, and thermal infrared images in classroom scenarios, generating high-quality learning behavior saliency maps. On this basis, the constructed visualization system converts the saliency maps into intuitive forms such as attention heatmaps and behavior event reports, directly connecting algorithm outputs with educational managers’ decision-making needs. Experimental results indicate that the proposed model achieves a good balance between computational efficiency and performance, significantly outperforming baseline models on multiple metrics in the calibrated educational behavior analysis dataset. Ablation experiments further verify the effectiveness of each core component and confirm the complementary value and necessity of tri-modal input in capturing behavioral appearance, spatial relationships, and physiological states.
The main value of this study lies in deeply integrating advanced computer vision technology with specific educational management scenarios, providing an end-to-end solution from algorithm to application for fine-grained and objective classroom teaching assessment. However, there are limitations: first, model performance relies on high-quality synchronized multi-modal data collection, placing high demands on hardware configuration and environmental stability in actual deployment; second, the current study mainly addresses pre-defined typical learning behaviors, and the ability to recognize and visualize more complex and abstract learning states remains to be explored. Looking forward, future research directions may focus on: (1) exploring more lightweight model architectures and self-supervised learning strategies to reduce reliance on labeled data and deployment costs; (2) investigating effective integration of audio, text, and other multi-modal information to build a more comprehensive classroom analysis model; (3) combining educational theory to develop more interpretable visualization paradigms and automatically linking system outputs with teaching intervention strategies, ultimately forming a “perception-analysis-feedback-optimization” closed-loop intelligent educational management ecosystem.
[1] Skril, I., Vasylyshyna, N., Skyrda, T., Moroz, O., Voropayeva, T. (2021). The role of education informatization in improving the efficiency of the educational process. Revista on Line de Política e Gestão Educacional, 25(3): 2506-2518. https://doi.org/10.22633/rpge.v25i3.15886
[2] Shayner, H., Titarenko, S., Mamchych, O., Pylypchuk, V., Nefodov, D. (2024). Socialization of personality in the conditions of informatization of the educational space. Amazonia Investiga, 13(80): 215-232. https://doi.org/10.34069/AI/2024.80.08.18
[3] Ducl, V., Çaro, E., Kapllanaj, M. (2024). Integrating ICT in vocational education and training: Expectations, challenges, and the path towards modernisation. Journal of Research, Innovation and Technologies, 3(2): 109-118. https://doi.org/10.57017/jorit.v3.2(6).02
[4] Li, Y., García-Díaz, V. (2022). Design of distance assistance system for intelligent education based on WEB. Mobile Networks and Applications, 27(6): 2565-2574. https://doi.org/10.1007/s11036-022-02073-8
[5] De-kun, J., Memon, F.H. (2022). Design of mobile intelligent evaluation algorithm in physical education teaching. Mobile Networks and Applications, 27(2): 527-534. https://doi.org/10.1007/s11036-021-01818-1
[6] Davalos, Y.P., López, E.V. (2023). Educational management in Peru: Path to development. Revista de Climatologia, 23: 2958-2962. https://doi.org/10.59427/rcli/2023/v23cs.2958-2962
[7] Vaganova, O.I., Gilyazova, O.S., Gileva, A.V., Yarygina, N.A., Bekirova, E.S. (2020). Quality management of educational activities in higher education. Amazonia Investiga, 9(28): 74-82. https://doi.org/10.34069/AI/2020.28.04.9
[8] Viсtorovich, S.I., Vladimirovich, K.O., Valerievna, Z.E., Alexandrovich, L.E., Borisovna, V.O., Georgievich, C.M. (2022). Strategic leadership in educational management. Revista on line de Política e Gestão Educacional, 26(5): 17421. https://doi.org/10.22633/rpge.v26i00.17421
[9] Cazorla, M., Viejo, D. (2015). JavaVis: An integrated computer vision library for teaching computer vision. Computer Applications in Engineering Education, 23(2): 258-267. https://doi.org/10.1002/cae.21594
[10] Chella, A., Frixione, M., Gaglio, S. (2001). Conceptual spaces for computer vision representations. Artificial Intelligence Review, 16(2): 137-152. https://doi.org/10.1023/A:1011658027344
[11] Matthies, L., Maimone, M., Johnson, A., Cheng, Y., Willson, R., Villalpando, C., Angelova, A. (2007). Computer vision on Mars. International Journal of Computer Vision, 75(1): 67-92. https://doi.org/10.1007/s11263-007-0046-z
[12] Mettes, P., Ghadimi Atigh, M., Keller-Ressel, M., Gu, J., Yeung, S. (2024). Hyperbolic deep learning in computer vision: A survey. International Journal of Computer Vision, 132(9): 3484-3508. https://doi.org/10.1007/s11263-024-02043-5
[13] Leo, M., Medioni, G., Trivedi, M., Kanade, T., Farinella, G.M. (2017). Computer vision for assistive technologies. Computer Vision and Image Understanding, 154: 1-15. https://doi.org/10.1016/j.cviu.2016.09.001
[14] Zhang, M., Zhao, Y., Chen, R., Gao, Y., Li, Z., Li, W. (2024). Remote sensing collaborative classification using multimodal adaptive modulation network. IEEE Transactions on Geoscience and Remote Sensing, 62: 5529512. https://doi.org/10.1109/TGRS.2024.3452650
[15] Feng, H., Hu, Q., Zhao, P., Wang, S., Ai, M., Zheng, D., Liu, T. (2025). FTransDeepLab: Multimodal fusion transformer-based DeepLabv3+ for remote sensing semantic segmentation. IEEE Transactions on Geoscience and Remote Sensing, 63: 4406618. https://doi.org/10.1109/TGRS.2025.3553478
[16] Xiao, Y., Zhang, C., Chen, Y., Jiang, B., Tang, J. (2024). ADRNet: Affine and deformable registration networks for multimodal remote sensing images. IEEE Transactions on Geoscience and Remote Sensing, 62: 5207613. https://doi.org/10.1109/TGRS.2024.3373568
[17] Akar, H., Yildirim, A. (2009). Change in teacher candidates' metaphorical images about classroom management in a social constructivist learning environment. Teaching in Higher Education, 14(4): 401-415. https://doi.org/10.1080/13562510903050152
[18] Jiang, Y., Li, W., Hossain, M.S., Chen, M., Alelaiwi, A., Al-Hammadi, M. (2020). A snapshot research and implementation of multimodal information fusion for data-driven emotion recognition. Information Fusion, 53: 209-221. https://doi.org/10.1016/j.inffus.2019.06.019
[19] Zhang, Y., Song, B., Du, X., Guizani, M. (2018). Vehicle tracking using surveillance with multimodal data fusion. IEEE Transactions on Intelligent Transportation Systems, 19(7): 2353-2361. https://doi.org/10.1109/TITS.2017.2787101
[20] Stephens, K.K., Pantoja, G.E. (2016). Mobile devices in the classroom: Learning motivations predict specific types of multicommunicating behaviors. Communication Education, 65(4): 463-479. https://doi.org/10.1080/03634523.2016.1164876