Pratomo Setiaji*![]() | Arif Setiawan
| Arif Setiawan![]() | R. Rhoedy Setiawan
| R. Rhoedy Setiawan![]()
© 2025 The authors. This article is published by IIETA and is licensed under the CC BY 4.0 license (http://creativecommons.org/licenses/by/4.0/).
OPEN ACCESS
Accurate estimation of live chicken weight is essential for improving poultry production efficiency; however, manual weighing is time-consuming and often unreliable. This study develops a predictive model using digital image processing and machine learning. A dataset of 100 chickens was collected under natural pen conditions. Preprocessing included grayscale conversion, binarization, edge detection, and Region of Interest (ROI) extraction, followed by geometric feature derivation. These features were used as input for a Random Forest regression model. The model achieved strong performance with a mean absolute percentage error (MAPE) of 0.0041, root mean square error (RMSE) of 0.083, mean absolute error (MAE) of 0.069, and coefficient of determination (R²) of 0.919. Compared with ANN, SVM, and Decision Tree, Random Forest provided the lowest prediction error and fastest computation. The dataset size of 100 chickens is considered adequate for an initial model, as evaluation results showed consistently high accuracy. However, larger datasets are needed to enhance generalization. Images were acquired under natural pen conditions with variations in lighting and background. The model maintained good predictive performance, though the impact of acquisition conditions on generalization warrants further study. These findings highlight the potential of computer vision and ensemble learning for non-invasive, real-time livestock monitoring and support the development of scalable, cost-effective precision poultry farming solutions.
weight estimation, chicken weight, image analysis, geometric features, Random Forest, precision livestock farming
The poultry industry plays a critical role in meeting the growing global demand for affordable and accessible animal protein, particularly in developing countries. As poultry consumption continues to rise, optimizing production processes has become increasingly essential for ensuring both sustainability and operational efficiency [1]. Effective broiler farm management involves multiple domains, including production planning, financial oversight, human resource coordination, and market distribution strategies [2]. Within the production domain, the accurate estimation of live chicken body weight serves as a key performance indicator, as it directly influences feed conversion efficiency, harvesting schedules, and overall profitability [3]. However, traditional methods relying on manual weighing are often inefficient, labor-intensive, and can induce physical stress in animals, which may negatively affect meat quality and welfare outcomes [4]. As a result, there is a growing need for automated, accurate, and scalable solutions. Recent advances in digital image processing and machine learning provide a promising technological frontier for transforming livestock monitoring and predictive modeling in poultry farming [5].
Digital image analysis enables the extraction of quantitative visual features from static or dynamic images of livestock, which can then be used to identify phenotypic indicators closely associated with body weight and growth performance [6]. These features typically include body dimensions, contours, surface area, and color distribution patterns, which serve as proxies for biometric parameters. Concurrently, machine learning techniques offer robust algorithms capable of learning from labeled datasets, enabling the generation of predictive models based on complex, non-linear patterns in the data.
The integration of image-based feature extraction with supervised machine learning models—such as Random Forest or neural networks—has shown significant promise in automating livestock weight estimation. This fusion of technologies facilitates precise, non-invasive, and real-time monitoring of animal growth, enhancing decision-making in feed management, harvesting schedules, and resource allocation. Moreover, it supports the broader agenda of smart farming by applying digital innovations to improve productivity, reduce labor dependency, and minimize operational costs [7].
For instance, in the context of chicken egg quality classification, the combination of Gray-Level Co-occurrence Matrix (GLCM) with Convolutional Neural Networks (CNN) has yielded remarkable success in extracting textural features from egg images, leading to high classification accuracy [8]. A similar approach, utilizing image-based feature extraction for geometric parameters in live chickens, could be adapted for non-invasive live weight estimation. By integrating feature extraction techniques with machine learning models, such as Random Forest or neural networks, this method holds the potential to enhance the accuracy of weight prediction while maintaining computational efficiency and scalability.
The convergence of these technologies has already shown positive outcomes in industrial poultry systems. For example, the study developed a method for estimating live chicken weight using 3D point cloud data from a depth camera and PointNet++, achieving an R² of 0.8817 and MAE of 0.095 [9]. Similarly, other studies have focused on non-contact carcass volume estimation through 3D reconstruction and point cloud stitching, with high accuracy (R² = 0.985), although they require complex hardware setups unsuitable for live monitoring [10]. Another study utilized CT imaging and a modified YOLOv5 segmentation model combined with a Random Forest regressor to estimate chicken leg weight, obtaining R² = 0.889 and MAE = 0.072, but again limited by infrastructural demands [11]. More relevant to live monitoring applications, video-based approaches using 2D image features and regression models have reported promising results, such as MAE of 0.07, but were constrained by limited feature diversity and environmental variability [12]. Similarly, the study employed depth imaging and Active Shape Modeling to estimate broiler carcass part weights, reporting an R² of 0.9129, yet again dependent on post-mortem imaging and processing infrastructure [13].
The advancement of image acquisition technologies—including high-resolution digital cameras and three-dimensional imaging systems—has significantly improved the precision and robustness of image-based livestock monitoring systems [14]. State-of-the-art image preprocessing techniques are employed to mitigate visual noise, standardize illumination, and perform precise segmentation of individual chickens from complex backgrounds, thereby enhancing the reliability of extracted features and improving predictive accuracy [15]. Moreover, the growing availability of large-scale annotated image datasets, collected under varying environmental conditions, has enabled the development of more generalizable and adaptable machine learning models.
These technical improvements are particularly relevant in the context of antibiotic-free poultry production systems, where stress-reducing, non-invasive monitoring tools are essential for maintaining animal health and minimizing mortality risks [16]. In response to mounting pressures to reduce production costs while ensuring product quality and safety, the poultry industry is increasingly compelled to adopt streamlined, data-driven, and cost-efficient management practices [17].
A wide range of machine learning algorithms has been applied to predict live chicken weight, ranging from traditional regression models to advanced deep learning architectures. Classical approaches, such as linear regression and support vector regression (SVR), remain popular due to their ease of implementation and interpretability, often serving as benchmarks for comparative evaluation [17]. However, these models are generally limited in their ability to capture the complex, non-linear growth patterns exhibited by broilers under variable rearing conditions [18].
A notable study [7] introduced a novel method for estimating live chicken weight using three-dimensional point cloud data captured by an overhead depth camera, addressing accuracy challenges posed by animal movement during traditional weighing procedures. This approach utilized the PointNet++ deep learning architecture, trained and evaluated on 2,000 point cloud samples from two chicken breeds—Huainan and Huxu. The model achieved a mean absolute error (MAE) of 0.095, a mean absolute percentage error (MAPE) of 6.66%, and an R² of 0.8817. The study incorporated advanced preprocessing techniques, including pass-through filtering and curvature-based downsampling, and found that RGB color features contributed more significantly to prediction accuracy than surface normal vectors.
While this method demonstrated high performance, it requires complex hardware setups and substantial computational resources, which may limit its practical scalability in conventional poultry farming environments. In contrast, this study proposes a more accessible image-based approach using standard 2D cameras and the Random Forest algorithm, aiming to achieve comparable accuracy with reduced system complexity and cost.
Another line of research has focused on developing non-contact methods for estimating chicken carcass volume using depth imaging and three-dimensional reconstruction techniques [19]. In this approach, an imaging system captures depth images of carcasses moving along the production line, and a real-time 3D model is constructed via point cloud stitching. The reconstructed model is then used to compute carcass volume, which is validated against ground truth measurements obtained through the water displacement method. The system achieved high predictive accuracy, with an R² value of 0.985 and a MAPE of 4.22% [19].
A similar study proposes a non-invasive system for predicting live chicken leg weight using computed tomography (CT) imaging and a deep learning approach. This system integrates a modified YOLOv5 segmentation algorithm with a multiscale attention mechanism and an atrous spatial pyramid pooling (ASPP) architecture, then employs a Random Forest regression model to estimate the leg weight of chickens based on morphological parameters obtained from segmentation. The developed model (YOLO-MCLW) is capable of simultaneously detecting the tibia bone and segmenting the chicken leg area, achieving an MAE of 0.072, MAPE of 4.82%, and R² of 0.889. This model also outperforms other detection and segmentation models and processes 37 images per second, making it suitable for efficient and accurate industrial poultry breeding applications without harming the animals [18].
Recent developments in deep learning have shown significant improvements in image segmentation accuracy proposed a modified U-Net architecture, namely U-Net11, which employs 11 convolutional layers to enhance segmentation performance across various biomedical datasets. Their results demonstrated a 2–5% improvement in Dice Similarity Coefficient compared to the classical U-Net model. Although applied in the biomedical domain, this approach highlights the effectiveness of deep convolutional architectures for extracting precise object boundaries, which is also essential in non-invasive chicken body segmentation for weight estimation [20]. Classical edge detection algorithms such as Canny, Sobel, and Prewitt are still widely used in image preprocessing to extract object boundaries effectively. The study [21] demonstrated that the Canny method achieved the best performance across various image types when the threshold value was between 0.30 and 0.45. In this study, a similar edge-based preprocessing approach was applied to extract geometric features from chicken images before regression modeling [21].
Introduced an online weight estimation system for broiler chickens and their anatomical parts using computer vision techniques based on depth imaging and the Active Shape Model (ASM) framework. The system was designed to segment and quantify carcass components—including the breast, thighs, wings, head, and neck—by extracting geometric features such as area, perimeter, and major-to-minor axis ratios from 2D projections of depth images. Using a dataset of 155 chicken carcass samples, the regression model achieved a coefficient of determination (R²) of 0.9129. The system was capable of processing each sample within a time range of 0.924 to 1.656 seconds, indicating its potential for real-time industrial application [19].
In live poultry production, achieving both efficiency and accuracy in weight estimation remains a persistent challenge. Although the literature review is comprehensive, it lacks a clear statement on the novelty and distinct advantages of the proposed method compared to existing approaches, particularly 3D methods. Unlike 3D-based methods that often require complex hardware setups and substantial computational resources, the proposed method—using 2D image processing with Random Forest regression—offers a cost-effective, simpler, and scalable solution. This approach not only simplifies the process but also ensures more practical and accessible real-time weight estimation, making it highly suitable for conventional poultry farming environments.
Conventional manual weighing methods are time-consuming, labor-intensive, and prone to measurement inconsistencies. The integration of digital image-based technologies offers a promising alternative for automating the monitoring process and enhancing real-time decision-making in farm management. Despite recent advancements in machine learning and imaging systems, few studies have addressed the development of low-cost, scalable solutions capable of accurately predicting live chicken weight under practical farm conditions.
In response to this gap, the present study proposes a novel approach that combines Region of Interest (ROI) detection, geometric feature extraction, and the Random Forest (RF) algorithm to estimate the body weight of live chickens using two-dimensional image data. The main contributions of this study include: 1) a cost-effective and non-invasive solution for live weight estimation using 2D imaging and machine learning, 2) a simplified and scalable method compared to 3D-based approaches, and 3) a tool that provides real-time weight monitoring with practical application potential in conventional poultry farming.
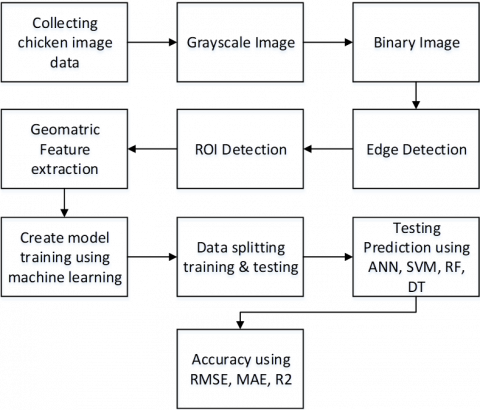
This study was conducted in several stages, as outlined below. The first step involved the collection of chicken images. In the second step, image preprocessing was performed, where digital image processing techniques were applied to enhance and prepare the chicken images for further analysis. The third step involved feature extraction, where geometric feature extraction methods were employed to capture key characteristics from the chicken images. The fourth and final step was weight prediction, in which training and testing data were processed using machine learning algorithms. A detailed overview of the research stages is presented in Figure 1.
Image segmentation is the initial step in digital image processing [20]. The collected chicken image is processed through a segmentation stage that includes converting the image into grayscale, followed by its transformation into a binary image and edge contour detection [21]. The contour detection step outlines the shape of the chicken, which is then stored in a separate file. The first task in segmentation is to convert the colored image to grayscale [22]. Grayscale images have pixel values that range from black (representing the lowest pixel value) to white (representing the highest pixel value), with the grayscale value corresponding to the image's brightness level [23]. The next step is converting the grayscale image into a binary image using the thresholding method [24, 25], which divides the image pixels into two categories: foreground and background, based on the grayscale level [26]. Thresholding is a crucial technique in image segmentation, where pixel values in the grayscale image are represented by L, and the total number of pixels is represented by Coskun et al. [27].
Figure 1. Research workflow
After obtaining the binary image, Region of Interest (ROI) detection is performed [28], this step is used to define specific areas within the digital image, ensuring that image processing is applied exclusively to the region identified as the chicken. ROI detection also helps to minimize noise, thereby improving the accuracy of the analysis [29]. In this study, a square ROI is used to define the chicken object, and the image is cropped according to the detected ROI boundaries [30].
Geometric feature extraction of the chicken image is then carried out to capture key information, such as color, texture, and shape [31]. Geometric features describe the shape of the poultry, with morphological, physiological, and behavioral characteristics typically used for species identification [32]. This study specifically focuses on extracting shape features, utilizing geometric morphometric features such as length and height [33]. Based on these geometric parameters, the area of the chicken is calculated [34].
The estimation of chicken weight is built using the Random Forest (RF) prediction algorithm. The RF approach has been increasingly adopted across various applications and industries due to its robustness and accuracy [35]. This algorithm is employed to model predictions involving multiple independent variables [36]. RF is a statistical algorithm designed to predict the outcome of a variable y, where Y represents the prediction result based on input variables X [37].
This algorithm is chosen because it is a suitable predictive algorithm [38], particularly for predicting live chicken weight in this study. RF is a supervised learning algorithm that can be used to solve classification and regression problems. The characteristic of this method is that each tree grows on a different bootstrap sample taken randomly from the training data. During each node split while constructing the decision tree, a subset of m variables is randomly selected from the original dataset, and the best ones are used for that node. For RF, which consists of N trees, the calculation is performed using the following formula [37]. Where I is the indicator function, and hn represents the n-th tree of the Random Forest (RF).
$l(y)=argma{{x}_{c}}\left( \sum\limits_{n=1}^{n}{{{I}_{{{h}_{n}}(y)=c}}} \right)$ (1)
The accuracy of the model is evaluated using validation metrics such as Root Mean Square Error (RMSE), Mean Absolute Error (MAE), and the coefficient of determination (R²). The optimal model is determined by selecting the prediction with the lowest RMSE and MAE values, while the highest R² value indicates the best model fit [39, 40]. The formulas for RMSE, MAE, and R² are described in Eqs. (2)-(5). Where $Y_{d a}$ is the actual value, $Y_{d p}$ a is the predicted value, $Y_{d w}$ is the average predicted value, and $n$ is the number of available data points [41].
$MAPE=\frac{1}{n}\sum\limits_{i=1}^{n}{\left| \frac{{{A}_{i}}-{{F}_{i}}}{{{A}_{i}}} \right|}\cdot x\cdot 100$ (2)
$RMSE=\sqrt{\frac{1}{N}\sum\limits_{I=1}^{N}{{{\left( {{Y}_{da}}-{{Y}_{dp}} \right)}^{2}}}}$ (3)
$MAE=\frac{1}{N}\sum\limits_{i=1}^{N}{\left| {{Y}_{da}}-{{Y}_{dp}} \right|}$ (4)
${{R}^{2}}=\frac{{{\left( \sum\limits_{i=1}^{N}{\left( {{Y}_{da}}-{{Y}_{dp}} \right)}\left( {{Y}_{dp}}-{{Y}_{dw}} \right) \right)}^{2}}}{\sum\limits_{i=1}^{N}{{{\left( {{Y}_{da}}-{{Y}_{dp}} \right)}^{2}}}\sum\limits_{i=1}^{N}{{{\left( {{Y}_{dp}}-{{Y}_{dw}} \right)}^{2}}}}$ (5)
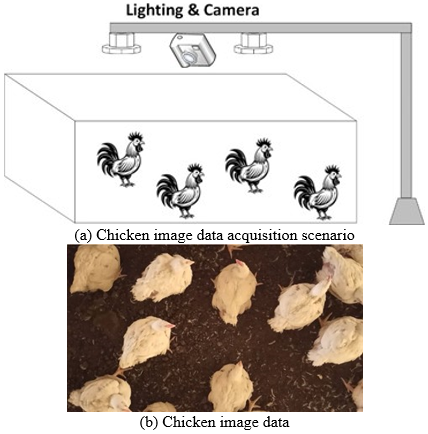
In this study, data was collected using images of chickens captured from an overhead perspective. A total of 100 chickens were photographed from the top view in a 3x3 meter chicken coop. This data collection approach may limit the model's ability to generalize to different angles or postures of the chickens. The camera used for data collection had a resolution of 48 megapixels, and four overhead lamps provided uniform lighting throughout the coop. The captured video was converted into digital image frames, and a single camera was used to capture all the images, ensuring consistency in data collection. The images were stored in JPG format, and the data consisted of 100 images of chickens viewed from above. Due to the small sample size, data augmentation techniques were not applied in this study, which could have helped expand the dataset and improve model generalization. Future work should consider collecting data from multiple angles or postures to improve the model's ability to generalize across different real-world conditions, and incorporate data augmentation methods such as rotation, flipping, and scaling to increase dataset diversity and further enhance the model's robustness.
A detailed description of the data collection setup is provided in Figure 2(a), and the processed chicken digital image data is shown in Figure 2(b).
Figure 2. Chicken image data acquisition
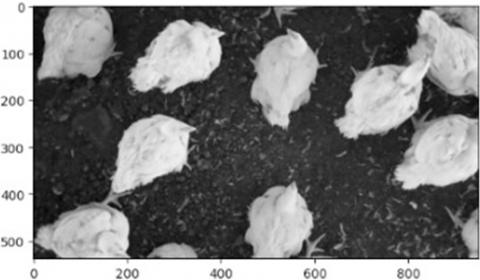
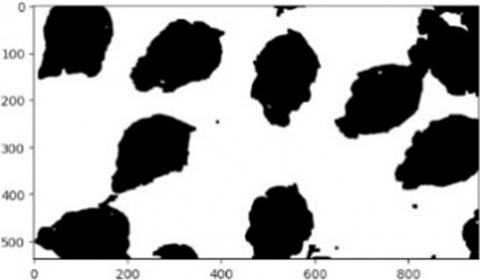
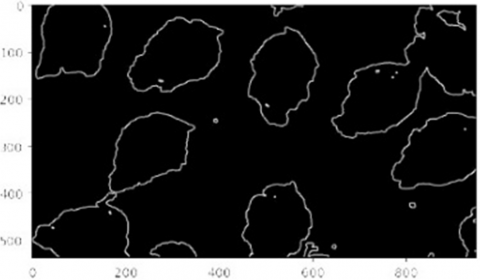
The study commenced with the image preprocessing stage, which included several steps: converting the images to grayscale, binarizing the images, detecting edge contours, and performing Region of Interest (ROI) detection. Figure 3(a) illustrates the grayscale image, while Figure 3(b) presents the binary image, generated using a threshold value of 0.01. The binarization process was carried out using the Otsu algorithm. Edge detection was performed using the Canny edge detection algorithm, which effectively identifies the boundaries of the chicken image. The result of this process is shown in Figure 3(c), where the contours of the chicken are highlighted.
(a) Grayscale image
(b) Binary image
(c) Contour detection
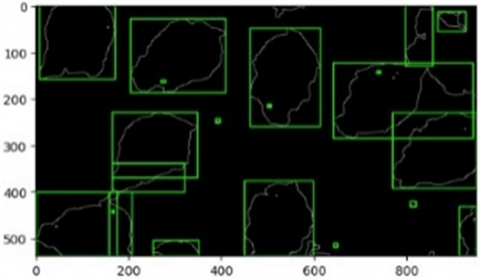
(d) ROI detection
Figure 3. Image preprocessing stage
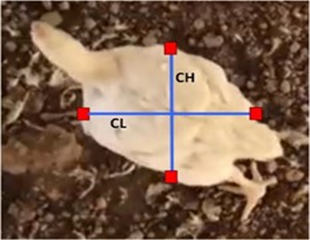
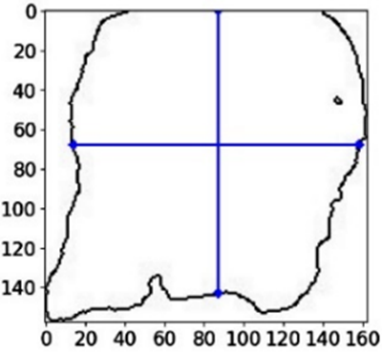
Figure 4. Geometric features of a chicken's image
The ROI detection process was then applied to isolate the chicken shape from the background. This technique helps to focus image processing on the area containing the chicken, reducing irrelevant data and enhancing processing accuracy. The detected region corresponding to the shape of the chicken is illustrated in Figure 3(d), showing the area selected for further analysis.
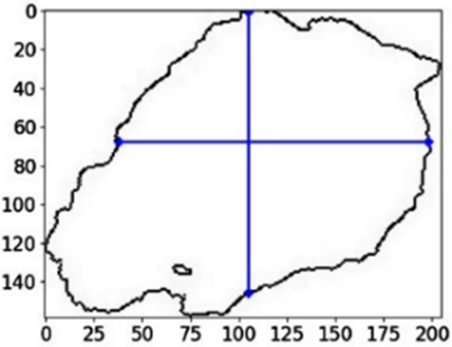
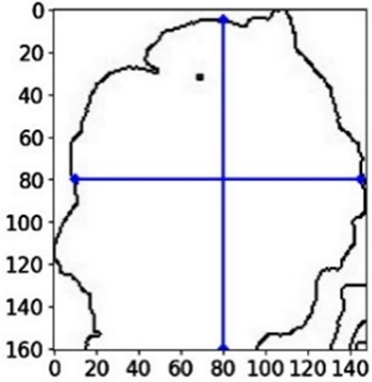
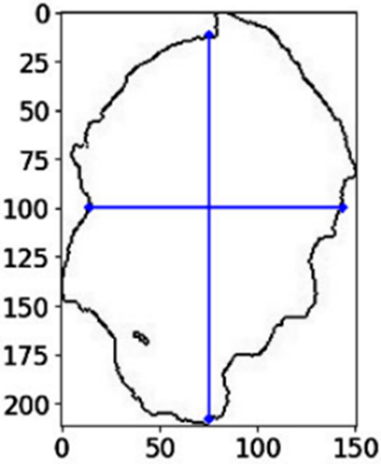
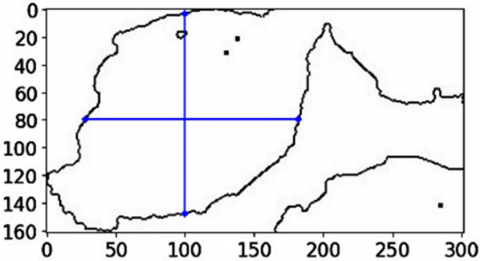
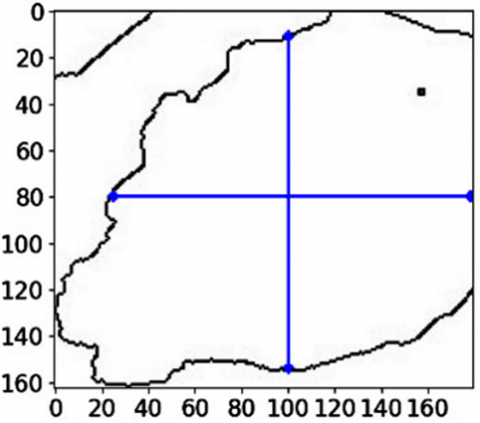
From the preprocessed image, the next step involves the feature extraction process for the chicken data. Figure 4 provides a detailed illustration of the geometric features extracted from the chicken image. In Figure 4, the red line represents the outer rectangular contour of the chicken, which is used to define its length (CL) and height (CH). These two dimensions are critical for calculating the Aspect Ratio (Ar), which is the ratio of the length to the height of the chicken.
Additionally, the area (A) and perimeter (P) of the chicken are calculated based on the pixel values detected in the image. These geometric properties are then used to calculate the complexity (M), defined as the ratio of the area to the perimeter of the chicken. The complexity metric helps in understanding the shape and structure of the chicken, providing insights into its form.
The variables 'a' and 'b' represent the major and minor axes of the chicken, respectively. The major axis ('a') is measured from the center point of the chicken to the edge of its length, while the minor axis ('b') is measured from the center point to the edge of the height. These axes are used to calculate the eccentricity, defined as the ratio of the minor axis to the major axis of the chicken's body.
In total, 6 geometric morphometric features are considered for analysis. These features offer a comprehensive understanding of the chicken's shape and structure. A detailed explanation of the geometric morphometric features, along with their formulas, is provided in Table 1 [33, 34].
Table 1. List of geometric morphometric features of chicken images
|
Feature |
Feature Description |
Symbol and Formula |
|
Chicken Length |
Length of the chicken's frame |
CL |
|
Height |
Height of the chicken's frame |
CH |
|
Area |
Number of pixels in the chicken's area |
A |
|
Perimeter |
Number of pixels around the chicken's edge |
P |
|
Aspect Ratio |
Length / height |
Ar = TL/H |
|
Complexity |
Area / perimeter |
M = A/P |
The detailed image processing procedure for geometric morphometric features is illustrated in Figure 5.
(a)
(b)
(c)
(d)
(e)
(f)
Figure 5. Geometric features from chicken image processing
The measurement of the chicken's length (CL) is calculated using the distance between two pixels, applying the formula provided by Chen et al. [42]. This process is performed on a total of 100 chickens to obtain the geometric values for CL, CH, A, P, AR, and M.
For the calculation of area (A) and perimeter (P), these values are derived from the detected pixels in the binary image. Specifically, the area corresponds to the number of pixels representing the chicken's body, and the perimeter is calculated by tracing the edge of the chicken in the binary image. The aspect ratio (AR) and complexity (M) are calculated using the formulas provided in Table 1 [43] based on the geometric properties of the chicken's shape.
${{L}_{D}}={{\left[ {{\left( \left| {{x}_{i}}-{{x}_{n}} \right|{{S}_{H}} \right)}^{2}}+{{\left( \left| {{y}_{i}}-{{y}_{n}} \right|{{S}_{v}} \right)}^{2}} \right]}^{\frac{1}{2}}}$ (6)
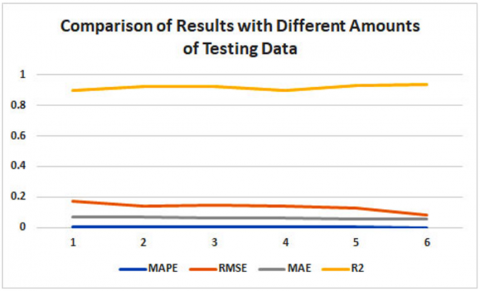
The study used 100 chicken data samples, divided into six experimental trials, combining the ROI method, Geometric Features (GF), and the Random Forest method (ROI-GF-RF). The research evaluated different test sizes using cross-validation. The test sizes varied at 80%, 70%, 60%, 50%, 40%, and 30% of the total dataset. The Random Forest (RF) hyperparameters were set as follows: n_estimators = 50, max_depth = 5, and random_state = 42. The results revealed that the best values for MAPE, RMSE, MAE, and R² were achieved in the sixth experiment, where 30% of the data was used for testing. At a test size of 30%, the largest training size used is 70%, resulting in a model with the lowest MAPE, RMSE, MAE, and highest R2 results. The resulting values were 0.0041 for MAPE, 0.134 for RMSE, 0.062 for MAE, and 0.919 for R².
From the 6 experiments, it was observed that the values of MAPE, RMSE, and MAE decreased as the size of the training data increased and the testing data size decreased. This indicates that a larger training dataset helps reduce the error rate. Conversely, the R² value increased, demonstrating that as the amount of training data increases and the testing data decreases, the coefficient of determination becomes larger, suggesting improved model accuracy. The detailed statistical results from these experiments are presented in Table 2 and Figure 6.
Figure 6. Comparison with different amounts of testing data
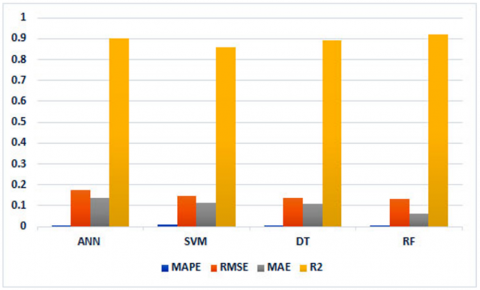
In this study, three machine learning-based comparison methods were employed to predict chicken weight: Artificial Neural Networks (ANN), Support Vector Machine (SVM), and Decision Tree (DT). Each method was tested using the same set of parameters and preprocessed data to ensure consistency across the experiments.
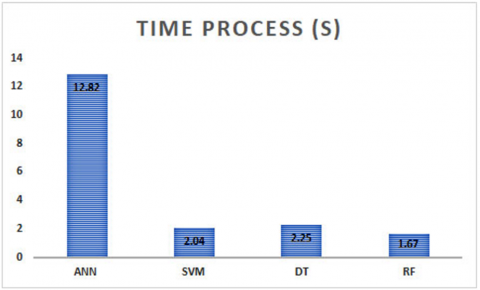
The experimental results demonstrated that the proposed algorithm, which combines ROI detection, shape feature extraction, and the Random Forest (RF) method, yielded the lowest error values for MAPE, RMSE, and MAE compared to other methods. Additionally, the computation process was the fastest, with an average processing time of 1.67 seconds.
Table 2. Experimental statistics using the development of the ROI-GF-RF method
|
Number of Experiment |
Test Size |
MAPE |
RMSE |
MAE |
R2 |
|
1 |
0.8 |
0.0049 |
0.17 |
0.07 |
0.901 |
|
2 |
0.7 |
0.0046 |
0.142 |
0.069 |
0.924 |
|
3 |
0.6 |
0.004 |
0.145 |
0.065 |
0.923 |
|
4 |
0.5 |
0.0039 |
0.141 |
0.059 |
0.901 |
|
5 |
0.4 |
0.0037 |
0.124 |
0.058 |
0.932 |
|
6 |
0.3 |
0.0036 |
0.082 |
0.056 |
0.938 |
|
Average |
0.0041 |
0.134 |
0.062 |
0.919 |
Table 3. Experiments with the comparison algorithms
|
Prediction Algorithm |
ANN |
SVM |
DT |
RF |
|
Feature Selection |
CL, CH, A, P, Ar, M |
|||
|
Number of Selected Feature |
6 |
|||
|
MAPE |
0.0072 |
0.0081 |
0.0062 |
0.0041 |
|
RMSE |
0.175 |
0.148 |
0.139 |
0.134 |
|
MAE |
0.139 |
0.115 |
0.107 |
0.062 |
|
R2 |
0.902 |
0.86 |
0.891 |
0.919 |
|
Time Process (s) |
12.82 |
2.04 |
2.25 |
1.67 |
The comparison between the Random Forest model and the other methods revealed significant differences in performance. Compared to ANN, the values of MAPE, RMSE, and MAE decreased by 0.031, 0.041, and 0.077, respectively, while the R² value increased by 0.017. When comparing RF to SVM, reductions in MAPE, RMSE, and MAE of 0.004, 0.014, and 0.053 were observed, respectively, accompanied by an increase in R² of 0.059. Furthermore, when RF was compared to DT, there were reductions in MAPE, RMSE, and MAE by 0.0021, 0.005, and 0.045, respectively, with an increase in R² of 0.028.
RF combines many decision trees and processes them quickly, reducing the risk of overfitting. This allows the model to remain stable against variations in chicken data. In the real world, this method can be integrated into an automatic monitoring system, helping to make optimal feed and harvest decisions.
In terms of computation time, RF outperformed the other methods, being 11.15 seconds faster than ANN, 0.37 seconds faster than SVM, and 0.58 seconds faster than DT. Detailed statistical results of the experiments with the comparison algorithms are shown in Table 3, and the error value graph is presented in Figure 7.
The results of this study, when compared with previous research, show the MAPE, RMSE, MAE, and R² values from several related studies using different methods. Below is the comparison analysis, where this study employs the ROI-GF-RF method. Overall, this study demonstrates that the proposed method outperforms other methods in terms of accuracy and efficiency in predicting live chicken weight. The detailed comparison of the results is presented in Table 4.
(a)
(b)
Figure 7. Accuracy values using comparison algorithms and processing time
Table 4. Experimental statistics using the development of the ROI-GF-RF method
|
Researcher |
Method |
MAPE |
RMSE |
MAE |
R2 |
|
[7] |
PoinNet++ |
6.66% |
0.095 |
0.8817 |
|
|
[44] |
Depth Imaging and 3-D Reconstruction |
4.22% |
0.985 |
||
|
[18] |
YOLOv5-MCLW |
4.82% |
0.072 |
0.889 |
|
|
[45] |
2D Video Feature Analysis and Machine Learning |
5.8% |
0.07 |
||
|
[19] |
RBF-SVR |
0.9129 |
|||
|
This research |
ROI-Geometric Feature (GF)-RF |
4.11% |
0.083 |
0.069 |
0.919 |
This research is limited by a small dataset and the use of only one viewpoint for data collection. This study successfully developed a predictive model for live chicken weight using a digital image processing approach, integrating Region of Interest (ROI) detection, shape feature extraction, and the Random Forest (RF) algorithm. The ROI process effectively isolates the chicken's area in the digital image, reducing noise interference and enhancing the accuracy of the analysis. Shape feature extraction, which includes measuring geometric parameters such as length, height, perimeter, area, aspect ratio, and complexity, provided critical information for accurate weight prediction.
The Random Forest method applied in this study has proven to generate accurate live chicken weight estimates, with low error values. The study achieved excellent predictions, with an average MAPE of 0.0041, RMSE of 0.083, MAE of 0.069, and R² of 0.919. These results demonstrate that the proposed method can predict live chicken weight with high accuracy.
This algorithm shows its advantage in handling complex input data, predicting chicken weight based on the extracted geometric features from the images. The findings of this study contribute significantly to improving the efficiency of chicken monitoring and management systems on farms, and open avenues for further applications in agriculture and livestock farming using digital image technology. Future research will expand on this work by exploring deep learning algorithms to further improve prediction accuracy, with more dynamic data retrieval scenarios.
The author would like to express gratitude to Universitas Muria Kudus (UMK), Kementerian Pendidikan Tinggi, Sains, dan Teknologi Republik Indonesia (Kemdiktisaintek) for their support through Contract No. 127/C3/DT.04.00/PL/2025, as well as to all individuals and institutions who have provided direct or indirect support throughout this research.
|
CNN |
Convolutional Neural Network |
|
GLCM |
Gray-Level Co-occurrence Matrix |
|
R² |
Coefficient of Determination |
|
MAE |
Mean Absolute Error |
|
MAPE |
Mean Absolute Percentage Error |
|
RMSE |
Root Mean Squared Error: |
|
PointNet++ |
A deep learning architecture used to process 3D point |
|
YOLOv5 |
You Only Look Once version 5 |
|
RF |
Random Forest |
|
ASM |
Active Shape Model |
|
CT Imaging |
Computed Tomography Imaging |
|
Depth Imaging |
A technique used in image processing to capture three-dimensional data of objects |
|
2D Imaging |
Two-dimensional image processing used to extract geometric features like minor axis length and chicken age for live weight estimation |
|
l(y) |
A function representing the decision or output label for the input y |
|
argmax |
The argument of the maximum function, used to find the value of a variable that maximizes a given function |
|
c |
The class or category label that is being predicted in the classification model |
|
hn(y) |
A hypothesis or model prediction for the nth instance, applied to the input y |
|
n |
The index of summation, typically representing the number of data points or features in the model |
|
Ai |
The actual value for the ith data point |
|
Fi |
The forecasted or predicted value for the ith data point |
|
| | |
Absolute value |
|
100 |
A factor used to convert the error to a percentage |
|
N |
The number of data points or instances in the dataset |
|
Yda |
The actual value for the ith data point |
|
Ydp |
The predicted value for the ith data point |
|
Ydw |
The mean of the actual values (Yda) |
|
LD |
A metric for measuring the distance or deviation in a 2D space |
|
xi, xn |
The x-coordinates for the ith data point and nth reference point |
|
yi, yn |
The y-coordinates for the ith data point and nth reference point |
|
SH |
A scale factor for the horizontal axis |
|
Sv |
A scale factor for the vertical axis |
|
ROI |
Region of Interest |
|
GF |
Geometric Features |
|
RF |
Random Forest |
|
ANN |
Artificial Neural Networks |
|
SVM |
Support Vector Machine |
|
DT |
Decision Tree |
|
Greek symbols |
|
|
∑ |
Summation symbol |
[1] Tulsi, A., Momin, A., Ayres, V. (2025). Moisture prediction in chicken litter using hyperspectral data and machine learning. Smart Agricultural Technology, 11: 101058. https://doi.org/10.1016/j.atech.2025.101058
[2] Bakar, M.A.A., Ker, P.J., Tang, S.G., Shah, F.N.A., et al. (2025). A hybrid chromaticity-morphological machine learning model to overcome the limit of detecting newcastle disease in experimentally infected chicken within 36 h. Computers and Electronics in Agriculture, 234: 110248. https://doi.org/10.1016/j.compag.2025.110248
[3] Chen, J.T., He, P.G., Jiang, J.S., Yang, Y.F., et al. (2023). In vivo prediction of abdominal fat and breast muscle in broiler chicken using live body measurements based on machine learning. Poultry Science, 102(1): 102239. https://doi.org/10.1016/j.psj.2022.102239
[4] Sitorus, A., Pambudi, S., Boodnon, W., Lapcharoensuk, R. (2025). Quantitative analysis based on image processing combined with machine learning and deep learning to determine the adulteration in nutmeg powder. Journal of Food Composition and Analysis, 146: 107913. https://doi.org/10.1016/j.jfca.2025.107913
[5] Lu, H., Yao, C., An, L., Song, A., et al. (2025). Classification and identification of chicken-derived adulteration in pork patties: A multi-dimensional quality profile and machine learning-based approach. Food Control, 176: 111381. https://doi.org/10.1016/j.foodcont.2025.111381
[6] Liu, Y., Huo, Z., Huang, M., Yang, R., et al. (2025). Rapid detection of microplastics in chicken feed based on near infrared spectroscopy and machine learning algorithm. Spectrochimica Acta Part A: Molecular and Biomolecular Spectroscopy, 329: 125617. https://doi.org/10.1016/j.saa.2024.125617
[7] Zheng, H., Ma, C., Liu, D., Huang, J., et al. (2025). Weight prediction method for individual live chickens based on single-view point cloud information. Computers and Electronics in Agriculture, 234: 110232. https://doi.org/10.1016/j.compag.2025.110232
[8] Setiaji, P., Adi, K., Surarso, B. (2024). Development of classification method for determining chicken egg quality using GLCM-CNN method. Ingenierie des Systemes d'Information, 29(2): 397. https://doi.org/10.18280/isi.290201
[9] Franzo, G., Legnardi, M., Faustini, G., Tucciarone, C.M., Cecchinato, M. (2023). When everything becomes bigger: big data for big poultry production. Animals, 13(11): 1804. https://doi.org/10.3390/ani13111804
[10] Mou, D., Wang, Z., Tan, X., Shi, S. (2022). A variational inequality approach with SVM optimization algorithm for identifying mineral lithology. Journal of Applied Geophysics, 204: 104747. https://doi.org/10.1016/j.jappgeo.2022.104747
[11] Merenda, V.R., Bodempudi, V.U., Pairis-Garcia, M.D., Li, G. (2024). Development and validation of machine-learning models for monitoring individual behaviors in group-housed broiler chickens. Poultry Science, 103(12): 104374. https://doi.org/10.1016/j.psj.2024.104374
[12] Li, P., Li, Z., Ying, F., Zhu, D., et al. (2025). Leveraging ultrasonic-derived phenotypes and estimated breeding value to improve abdominal fat weight prediction in chickens throughout the egg laying period. Smart Agricultural Technology, 11: 100912. https://doi.org/10.1016/j.atech.2025.100912
[13] Astill, J., Dara, R.A., Fraser, E.D., Roberts, B., Sharif, S. (2020). Smart poultry management: Smart sensors, big data, and the Internet of Things. Computers and Electronics in Agriculture, 170: 105291. https://doi.org/10.1016/j.compag.2020.105291
[14] Marić, K., Gvozdanović, K., Djurkin Kušec, I., Kušec, G., Margeta, V. (2025). Smart pig farms: Integration and application of digital technologies in pig production. Agriculture, 15(9): 937. https://doi.org/10.3390/agriculture15090937
[15] Hou, G., Li, R., Tian, M., Ding, J., et al. (2024). Improving efficiency: Automatic intelligent weighing system as a replacement for manual pig weighing. Animals, 14(11): 1614. https://doi.org/10.3390/ani14111614
[16] Jainonthee, C., Sivapirunthep, P., Pirompud, P., Punyapornwithaya, V., Srisawang, S., Chaosap, C. (2025). Modeling and forecasting dead-on-arrival in broilers using time series methods: A case study from Thailand. Animals, 15(8): 1179. https://doi.org/10.3390/ani15081179
[17] Neethirajan, S. (2023). Digital phenotyping: a game changer for the broiler industry. Animals, 13(16): 2585. https://doi.org/10.3390/ani13162585
[18] Sun, S., Wei, L., Chen, Z., Chai, Y., Wang, S., Sun, R. (2024). Nondestructive estimation method of live chicken leg weight based on deep learning. Poultry Science, 103(4): 103477. https://doi.org/10.1016/j.psj.2024.103477
[19] Nyalala, I., Okinda, C., Makange, N., Korohou, T., et al. (2021). On-line weight estimation of broiler carcass and cuts by a computer vision system. Poultry Science, 100(12): 101474. https://doi.org/10.1016/j.psj.2021.101474
[20] Luo, S., Li, Y., Gao, P., Wang, Y., Serikawa, S. (2022). Meta-seg: A survey of meta-learning for image segmentation. Pattern Recognition, 126: 108586. https://doi.org/10.1016/j.patcog.2022.108586
[21] Tatli, U., Budak, C. (2023). Biomedical image segmentation with modified U-Net. Traitement du Signal, 40(2): 523-531. https://doi.org/10.18280/ts.400211
[22] Hagara, M., Stojanović, R., Bagala, T., Kubinec, P., Ondráček, O. (2020). Grayscale image formats for edge detection and for its FPGA implementation. Microprocessors and Microsystems, 75: 103056. https://doi.org/10.1016/j.micpro.2020.103056
[23] Mohan, V.M., Kanaka Durga, R., Devathi, S., Srujan Raju, K. (2015). Image processing representation using binary image; grayscale, color image, and histogram. In Proceedings of the Second International Conference on Computer and Communication Technologies: IC3T 2015, pp. 353-361. https://doi.org/10.1007/978-81-322-2526-3
[24] Du, S., Luo, K., Zhi, Y., Situ, H., Zhang, J. (2022). Binarization of grayscale quantum image denoted with novel enhanced quantum representations. Results in Physics, 39: 105710. https://doi.org/10.1016/j.rinp.2022.105710.
[25] Yang, Y., Xiang, C., Hu, H., Ye, T.X. (2024). Application of high-resolution satellite imagery techniques in the assessment of urban park green cover. Traitement du Signal, 41(2). 1009-1017. https://doi.org/10.18280/ts.410241
[26] Senthilkumaran, N., Vaithegi, S. (2016). Image segmentation by using thresholding techniques for medical images. Computer Science & Engineering: An International Journal, 6(1): 1-13. https://doi.org/10.5121/cseij.2016.6101
[27] Coskun, H., Yiğit, T., Üncü, İ.S., Ersoy, M., Topal, A. (2022). An industrial application towards classification and optimization of multi-class tile surface defects based on geometric and wavelet features. Traitement du Signal, 39(6): 2011-2022. https://doi.org/10.18280/ts.390613
[28] Islam, R., Islam, M.R., Talukder, K.H. (2022). An efficient ROI detection algorithm for Bangla text extraction and recognition from natural scene images. Journal of King Saud University-Computer and Information Sciences, 34(8): 6150-6164. https://doi.org/10.1016/j.jksuci.2022.02.001
[29] Abdellatif, H., Taha, T.E., El-Shanawany, R., Zahran, O., Abd El-Samie, F.E. (2022). Efficient ROI-based compression of mammography images. Biomedical Signal Processing and Control, 77: 103721. https://doi.org/10.1016/j.bspc.2022.103721
[30] Alfraheed, M. (2024). 3D synthetic view for x-ray breast cancer mammogram images. Ingénierie des Systèmes d’Information, 29(4): 1639-1652. https://doi.org/10.18280/isi.290437
[31] Gopal, A., Alagarsamy, P.C., Kalivaradhan, U.M., Gandhimaruthian, L. (2023). An automatic region based optimal segmentation and detection of features on dermoscopy images using V-shaped waterfall and water ridges. Traitement du Signal, 40(2): 511-522. https://doi.org/10.18280/ts.400210
[32] Fan, Q., Bi, Y., Xue, B., Zhang, M. (2022). Genetic programming for feature extraction and construction in image classification. Applied Soft Computing, 118: 108509. https://doi.org/10.1016/j.asoc.2022.108509
[33] Dineshbabu, A.P., Sasikumar, G., Rohit, P., Thomas, S., Rajesh, K.M., Zacharia, P.U. (2013). Methodologies for Studying Finfish and Shellfish Biology. CMFRI-NICRA publication No. 2, Central Marine Fisheries Research Institute, Kochi.
[34] Zhang, L., Wang, J., Duan, Q. (2020). Estimation for fish mass using image analysis and neural network. Computers and Electronics in Agriculture, 173: 105439. https://doi.org/10.1016/j.compag.2020.105439
[35] Meerasri, J., Sothornvit, R. (2022). Artificial neural networks (ANNs) and multiple linear regression (MLR) for prediction of moisture content for coated pineapple cubes. Case Studies in Thermal Engineering, 33: 101942. https://doi.org/10.1016/j.csite.2022.101942
[36] Shams, S.R., Jahani, A., Kalantary, S., Moeinaddini, M., Khorasani, N. (2021). The evaluation on artificial neural networks (ANN) and multiple linear regressions (MLR) models for predicting SO2 concentration. Urban Climate, 37: 100837. https://doi.org/10.1016/j.uclim.2021.100837
[37] Oukawa, G.Y., Krecl, P., Targino, A.C. (2022). Fine-scale modeling of the urban heat island: A comparison of multiple linear regression and random forest approaches. Science of the Total Environment, 815: 152836. https://doi.org/10.1016/j.scitotenv.2021.152836
[38] Kamboj, U., Guha, P., Mishra, S. (2022). Comparison of PLSR, MLR, SVM regression methods for determination of crude protein and carbohydrate content in stored wheat using near Infrared spectroscopy. Materials Today: Proceedings, 48: 576-582. https://doi.org/10.1016/j.matpr.2021.04.540
[39] Akan, R., Keskin, S.N. (2019). The effect of data size of ANFIS and MLR models on prediction of unconfined compression strength of clayey soils. SN Applied Sciences, 1(8): 843. https://doi.org/10.1007/s42452-019-0883-8
[40] Jahani, A., Rayegani, B. (2020). Forest landscape visual quality evaluation using artificial intelligence techniques as a decision support system. Stochastic Environmental Research and Risk Assessment, 34(10): 1473-1486. https://doi.org/10.1007/s00477-020-01832-x
[41] Pourmohammad, P., Jahani, A., Zare Chahooki, M.A., Goshtasb Meigooni, H. (2020). Road impact assessment modelling on plants diversity in national parks using regression analysis in comparison with artificial intelligence. Modeling Earth Systems and Environment, 6(3): 1281-1292. https://doi.org/10.1007/s40808-020-00799-6
[42] Chen, F., Xu, J., Wei, Y., Sun, J. (2019). Establishing an eyeball-weight relationship for Litopenaeus vannamei using machine vision technology. Aquacultural Engineering, 87: 102014. https://doi.org/10.1016/j.aquaeng.2019.102014
[43] Setiawan, A., Hadiyanto, H., Widodo, C.E. (2022). Shrimp body weight estimation in aquaculture ponds using morphometric features based on underwater image analysis and machine learning approach. Revue d'Intelligence Artificielle, 36(6): 905. https://doi.org/10.18280/ria.360611
[44] Nyalala, I., Jiayu, Z., Zixuan, C., Junlong, C., Chen, K. (2024). Online chicken carcass volume estimation using depth imaging and 3-D reconstruction. Poultry Science, 103(12): 104232. https://doi.org/10.1016/j.psj.2024.104232
[45] Campbell, M., Miller, P., Díaz-Chito, K., Irvine, S., et al. (2025). Automated precision weighing: Leveraging 2D video feature analysis and machine learning for live body weight estimation of broiler chickens. Smart Agricultural Technology, 10: 100793. https://doi.org/10.1016/j.atech.2025.100793