Hayder Salah Mohammed*![]() | Firas Saaduldeen Ahmed
| Firas Saaduldeen Ahmed![]()
© 2025 The authors. This article is published by IIETA and is licensed under the CC BY 4.0 license (http://creativecommons.org/licenses/by/4.0/).
OPEN ACCESS
With the growing adoption of solar photovoltaic (PV) systems, developing effective fault detection techniques is crucial to ensure high efficiency and reliability. This paper presents a wireless PV fault detection system where the solar field is divided into sectors, each containing multiple PV cells. After applying test signals, each cell's/panel status is identified as normal operation, short circuit, open circuit, or misalignment. The test data is encoded into protocol frames using binary encoding and Hamming error correction coding implemented in Field Programmable Gate Arrays (FPGA). This enables single-bit error detection and correction during wireless transmission. NRF24 modules transmit the encoded data between the solar field and the central control station. The received data is Hamming decoded, and the protocol frames are extracted to identify and localize faults to specific cells/panels. Experimental validation on a 4-module laboratory setup demonstrates 99.2% fault detection accuracy with an average detection time of 77.7 ms. The system achieves a 4.3 dB coding gain in wireless transmission through Hamming (14,10) error correction. Statistical analysis confirms system reliability with significance at p < 0.001. This wireless monitoring approach offers centralized identification of faults across distributed solar installations, improving operational efficiency and system reliability.
PV system, fault detection and localization, wireless sensor network (WSN), FPGA, hamming code, real-time monitoring
The world's energy map has been drastically shifting, and solar photovoltaic (PV) technology is a key component of renewable and sustainable power generation. The importance of PV systems for climate protection and future energy needs is amply demonstrated by their growing use, which ranges from rooftops and facades in residential and commercial systems to large commercial and utility-scale solutions [1]. However, a number of fault types, such as partial shading, short-circuiting, open-circuiting, and module degradation, have a substantial impact on the overall performance, dependability, and security of these systems [2]. Unnoticed faults can cause significant amounts of power losses, damage the lifespan of the system, increase maintenance costs, and create safety threats as well [3]. Therefore, the implementation of reliable, accurate, real-time fault detection and localization systems becomes a necessity for efficient operation and economic viability of the PV systems. Conventional fault detection techniques are based on a direct search of cells and are labor-consuming, time-consuming, and not applicable to large-scale PV arrays. Although different automatic methods have been suggested, most of them have some disadvantages, such as being expensive and complicated, non-real-time, or with poor localization accuracy [4]. Wireless Sensor Network (WSNs) and FPGAs are emerging technologies that seem to be successful in addressing these challenges. The WSNs are the convenient way to monitor the distributed PV systems without heavy wire, whereas FPGAs provide the parallel processing and reconfigurable capability, so we use them to process high-speed data in real time and implement the complex algorithm [5, 6]. Although there have been some improvements in PV fault detection, there are still some challenges that need to be resolved, including real-time scanning, accurate position localization, and data integrity in the wireless conditions. Current solutions frequently fail to deliver timely fault warnings and notifications so that extended energy losses and possible damage may be avoided. In addition, most techniques can identify if an open-circuit fault occurred; however, they are unable to provide the position of the fault to the device level in a large PV plant, thereby making the maintenance and repair tasks inefficient. Although the use of wireless communication has many attractions resulting from flexibility of deployment, it also introduces the risk of data becoming corrupted by noise and interference, so an effective error correction mechanism is required. Especially, there is an urgent demand for a unified fault detection scheme that can simultaneously make use of the advantages of wireless data transmission and high-speed, reliable processing to accomplish accurate and prompt local fault diagnosis. Such a system should not only be able to identify different kinds of faults but should also be able to maintain the signal integrity of the transmitted data, thereby minimizing false positives and false negatives and ultimately improving the reliability and performance of PV systems.
This paper tackles these challenges by presenting and verifying an FPGA-based WSN for the real-time detection and localization of faults in a PV system.
This work provides six main contributions toward the improvement of photovoltaic fault detection systems:
1. FPGA-WSN Hybrid Architecture: Creation of a modular wireless sensor network architecture, based on FPGA for high-speed data processing and NRF24 modules for data transmission, in a distributed photovoltaic context.
2. Advanced Formulated Mathematical Modelling: The overall systematic formulated investigations for characterization of photovoltaic behavior during different faults, such as short circuits, open circuits, and misalignments, using robust threshold-based fault detection algorithms.
3. Hardware-Assisted Error Correction: Hamming (14,10) error correction codes are implemented in the FPGA core to ensure single-bit error correction during wireless transmission, thereby guaranteeing data integrity and system reliability.
4. Integrated Validation Framework: Twin validation scheme including conceptual simulation modelling and experimental validation on scale laboratory hardware, showing behavior of the system under a set of diverse fault conditions.
5. Performance Benchmarking: This section compares the performance of our system with existing fault detection schemes, confirming its competitive advantages in detection rate, computational efficiency, and reliability of wireless transmission.
6. Fine Fault Isolation: Modular architecture supports cell-level fault isolation in any sector, minimizing maintenance efforts and system losses.
The remainder of the paper is organized as follows: Section 2 highlights the current research gap and provides a thorough review of earlier studies in PV fault detection, WSNs, and FPGA applications. Section 3 outlines the suggested system architecture and design, including the data flow and hardware components. In Section 4, we outline the theoretical and methodological foundation, with particular attention to PV cell modeling, fault condition representation techniques, the fault detection algorithm, and the error correction hamming code. The experimental setup, data collection methods, and evaluation metrics are presented in Section 5. The results are discussed and described in Section 6, taking into account wireless transmission efficiency, fault detection rate, detection time, and comparison with alternative techniques. Section 7 concludes the paper and outlines the next steps.
Recent photovoltaic fault detection has shifted the paradigm by integrating artificial intelligence methods, WSN, and field programmable gate array design. This technical fusion caters to the increasing complexity of distributed solar installations, for which real-time monitoring is required with accurate fault detection in addition to reliable data integrity checks.
Taxonomic analysis sheds light on fundamental transitions from manual methods to advanced computational techniques utilizing machine learning. El-Banby et al. [2] offered a systematic review advocating for the swift adoption of data-driven methodologies across various operational contexts. Meanwhile, Hong and Pula [7] categorized contemporary detection methods, including visual, thermal, and electrical mechanisms, under the expansive umbrella of artificial intelligence integration. Venkatakrishnan et al [8] indicated that modern architectures now necessitate response times in the sub-second range and require fault identification at the cell level as a key performance characteristic. The contributions outlined here provide a conceptual foundation for analyzing the interdisciplinary convergence related to fault detection systems. The implementation of advanced hardware architectures has enabled levels of functionality in distributed monitoring that were previously unattainable. Zhu and Hou [9] presented multimedia monitoring systems that are embedded in FPGAs, which support advanced algorithms at the sensor level and reduce communication overhead by distributing intelligence. WSN have evolved to the point that their implementations include energy harvesting schemes for the purpose of operating autonomously via direct extraction of energy from photovoltaic modules. The bibliometric studies conducted by Sepúlveda-Oviedo et al. [10] indicated that publications related to artificial intelligence (AI) have been increasing at an exponential rate. Between 2010 and 2022, more than 620 AI-based publications were released, with a notable 4.5-fold increase from 2015 to 2022. This trend highlights the significant potential of artificial intelligence in managing high-dimensional monitoring data. Liu et al. [11] suggested a way to identify faults by using stacked auto-encoder (SAE) structures along with clustering and current-voltage analysis. This approach demonstrates superior performance compared to traditional methods across multiple scenarios, particularly regarding classification accuracy. Sripada et al. [12] used a combination of stacking methods and pre-trained convolutional networks to pull out important details from aerial images, leading to big improvements in spotting unusual patterns for large projects. Machine learning applications that employ well-structured architectures demonstrate high accuracy. In contrast, Amiri et al. [13] reported that their implementation of Random Forest Classifier algorithms achieves greater accuracy in identifying faults using their records, and they are capable of operating in real time. Predictive maintenance strategies go beyond those of both traditional (reactive) and preventive maintenance (maintain or replace before failure) by not only determining the condition of the equipment but also by predicting and conducting measured maintenance. Marangis et al. [14] showed trend-based analytical techniques that allow you to take preventive steps by analyzing historical performance and environment correlation models. Integration with edge computing facilitates the creation of frameworks that require less computational power. Eskandari et al. [15] suggested a way to automatically diagnose issues using a method called weighted ensemble learning, which is made for devices with limited resources and focuses on saving energy. This approach achieves real-time processing without sacrificing accuracy. Current research emphasizes transparent AI, characterized by algorithmic transparency. Thakfan and Bin Salamah [16] pointed out that being able to understand and trust the system is very important when using it in critical situations, especially since its reliability affects both power generation and cost-effectiveness. Aghaei et al. [17] reported the implementation of advanced multi-modal imaging techniques that enhance fault characterization accuracy. The work includes automated monitoring using multispectral integrated infrared thermography, ultraviolet fluorescence, and electroluminescence images, along with advanced current-voltage analysis. Wireless communication security constraints have become crucial factors. Faris et al. [18] emphasized the need for strong encryption, reliable authentication, and good intrusion detection systems to protect data, especially when dealing with electromagnetic interference. Despite significant advancements, ongoing integration bottlenecks continue to impede the effectiveness of deployments. Eldeghady et al. [19] showed through a broad comparison that many new AI methods focus more on getting accurate results than on meeting real-time needs, and they require too much computing power for time-sensitive applications. Current research inadequately addresses wireless data corruption in harsh environments, especially in ideal communication channels that lack built-in hardware-level error correction. Additionally, modern systems are not scalable for large distributed deployments, offering system-level accuracy rather than the required cell-level accuracy for effective maintenance. The designed system addresses these shortcomings by utilizing unique FPGA-based wireless sensor network technology. This system incorporates an advanced mathematical model, a threshold-based approach, and hardware Hamming error correction. Additionally, Teta et al. [20] presented similar methods that involve energy valley optimizer-based lightweight models, demonstrating the feasibility of real-time processing with accurate localization. This integrated framework provides wireless data consistency, support for scalable deployment, and constitutes substantial progress by combining artificial intelligence, WSN, and field-programmable gate arrays in a unified way for fault detection.
The comprehensive literature review effectively delineates the evolution of photovoltaic fault detection, transitioning from traditional manual methods to advanced AI-integrated systems. The authors systematically investigate key technological convergences that they anticipate will propel the development of future smart environments and applications, including machine learning, sensor network technology, and reconfigurable computing (FPGAs). The review appropriately addresses current limitations and clarifies the rationale behind the research gap that the proposed FPGA-based solution aims to fill.
Despite significant progress in photovoltaic fault detection and individual advancements in WSN and FPGA technologies, several critical gaps remain in the literature:
1. Integration Challenge: Limited work has been done on fully integrating real-time processing capabilities with reliable wireless communication and robust error correction for PV fault detection.
2. Fault Localization Granularity: Many existing solutions provide system-level or string-level fault detection but lack precise cell-level localization capabilities essential for efficient maintenance.
3. Wireless Data Integrity: While wireless monitoring offers significant advantages, few studies adequately address data corruption issues in noisy outdoor environments through hardware-implemented error correction.
4. Real-time Processing: Most AI-driven approaches focus on accuracy but do not provide the sub-second response times needed for safety-critical fault detection.
5. Scalable Hardware Implementation: Limited research has demonstrated practical, scalable hardware implementations suitable for distributed PV installations.
The proposed system tackles these identified deficiencies directly by incorporating a modular FPGA-based WSN architecture with improved mathematical modeling of PV cell characteristics, employing Hamming error correction coding for wireless data integrity, and offering accurate cell-level fault localization with real-time processing ability. It is this complete perspective that sets this work apart and offers a practical structure for distributed photovoltaic fault detection.
This section provides a detailed explanation of the real-time PV system fault detection and localization scheme. Utilizing FPGA technology for quick data processing and error correction, the architecture prioritizes modularity, scalability, and dependable wireless data transfer.
3.1 System overview
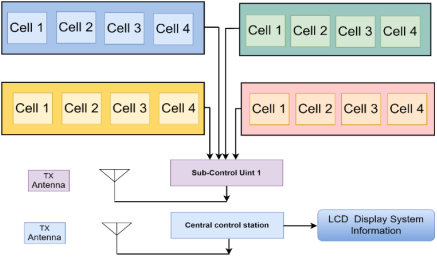
The system under consideration is intended for control of a distributed photovoltaic solar installation by splitting the solar field into a number of manageable areas. Multiple PV cells or panels per sector for fault detection and localization at a granular level. The system adopts a distributed structure in which the data inside the segment of each PV unit is measured and processed by a local sub-control unit and then sends the wireless data to a central control station for further comprehensive analysis and failure diagnosis. The general system architecture is depicted in Figure 1, where we can observe that some functional blocks come out, such as PV arrays (divided into sectors), sub-control units (one per sector), wireless transceivers (NRF24 P-modules), and a central control station. The sub-control unit that includes a microcontroller and an FPGA is used to send a test signal to the PV cells, measure the response, encode the data, and send it wirelessly. The encoded data is transmitted to the central control station, which decodes the data and further processes the data for fault identification and location. This modular approach not only simplifies deployment and maintenance but also enhances the system's robustness by enabling localized fault diagnosis while maintaining centralized monitoring capabilities.
Figure 1. Proposed solar fault detection system architecture showing distributed monitoring with sectored approach
3.2 Hardware components
Taking the real-time photovoltaic fault detection to a success is dependent on appropriate hardware elements, which are specifically engineered for the demands of distributed PV monitoring, well-selected, and integrated.
1. Arduino DUE Microcontroller: The Arduino DUE is used as the main controller within each sub-control unit, which is responsible for producing the testing signals of solar cells, collecting the data of voltage and current via its 12-bit ADC channels, and controlling the communication interfaces with the FPGA and the wireless modules. Its 84 MHz ARM Cortex-M3 processor has the computational power to handle real-time data acquisition and analysis at moderate data rates, while the multitude of analog and digital I/Os provides help for more than just simple sensor interfaces.
2. FPGA Processing Unit: The main controller unit for high-speed data encoding and error correction is implemented in the Altera Cyclone IV EP4CE6E22C8N. This voice-activated device is chosen for its optimal trade-off among logic elements (6,272 LEs), embedded memory (276,480 bits), and low cost that is suitable for distributed installation. A fault-classifying algorithm and Hamming error correction logic are designed in VHDL to support register-based parallelism and generate deterministic timings that are essential for real-time applications.
3. Wireless Communication Module: The NRF24L01+ module is the core of this remote control system, which ensures stable and low power-consuming data transmission between sub-control systems and the central control system. Operating in the 2.4 GHz ISM band with configurable data rates up to 2 Mbps, these modules offer robust communication links with automatic acknowledgment and retry mechanisms. The low power consumption (11.3 mA in receive mode, 7 mA in transmit mode) makes them particularly suitable for battery-operated or solar-powered remote units.
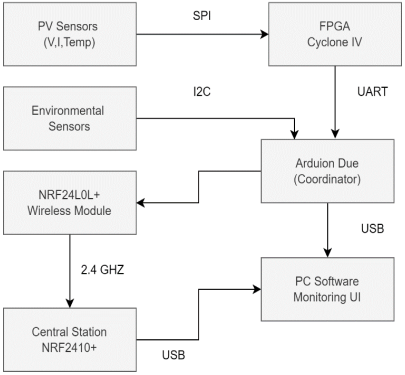
4. System Integration: The hardware integration combines these components through carefully designed interfaces to ensure seamless data flow and reliable operation. Figure 2 illustrates the complete system integration, showing hardware components, FPGA firmware, and software coordination. The Serial Peripheral Interface (SPI) is the main way the Arduino DUE microcontroller talks to the NRF24L01+ wireless modules, while the Inter-Integrated Circuit (I2C) protocol helps the Arduino DUE communicate with environmental sensors that measure things like temperature and light, and the Universal Asynchronous Receiver-Transmitter (UART) allows two-way communication between the Arduino DUE and the Altera Cyclone IV FPGA.
Figure 2. System integration diagram
3.3 Data flow and communication protocol
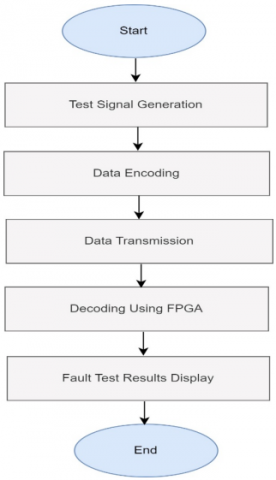
The data flow within the proposed system follows a well-defined protocol designed to ensure efficient and reliable fault detection across distributed photovoltaic installations through systematic data acquisition, encoding, transmission, and analysis.
3.3.1 Test signal generation and data acquisition
The microcontroller in each sub-control unit creates specific test signals to get clear reactions from photovoltaic cells when they are working under different conditions. These test signals are made to tell apart normal operation from different problems, like short circuits, open circuits, and misalignment issues. Following signal application, the microcontroller acquires voltage and current responses through high-resolution ADC channels, digitizing the data with 12-bit precision to capture subtle variations in electrical characteristics that may indicate fault conditions.
3.3.2 Binary encoding and protocol frame generation
The digital data is converted into binary form using a standard 10-bit protocol frame known as standard10-bit protocol frame encoding. This encoding effectively conveys both the fault status and the location information of the distributed PV array. The benefits of this binary encoding, which compactly fits the data into a 10-bit protocol frame structure, are illustrated in Tables 1 and 2. The significant dual-use of a single 2-bit encoding for both fault status and sector addresses enhances information density while preserving the separation of fault types. This encoding permits the indication of up to four different types of faults and four sectors within a total of 4 bits, leaving 6 bits available for other system parameters, such as signal strength information or a timestamp. By incorporating three pairs of detection gates sensitive to binary sequence progression (00, 01, 10, 11), we can effectively distinguish between error states, whether they involve single-bit or double-bit errors. This approach minimizes the likelihood of misinterpreting faulty cases, as single-bit transmission errors can be corrected using the Hamming (14, 10) error correction strategy.
Table 1. Binary encoding for solar cell conditions
|
Solar Cell Condition |
Binary Symbol |
Abbreviation |
|
Normal Operation |
00 |
OK |
|
Short Circuit |
01 |
SH |
|
Open Circuit |
10 |
OP |
|
Misalignment |
11 |
MI |
Table 2. Sector identification encoding
|
Sector Location |
Binary Symbol |
Abbreviation |
|
Sector 1 |
00 |
S1 |
|
Sector 2 |
01 |
S2 |
|
Sector 3 |
10 |
S3 |
|
Sector 4 |
11 |
S4 |
3.3.3 FPGA-based error correction and wireless transmission
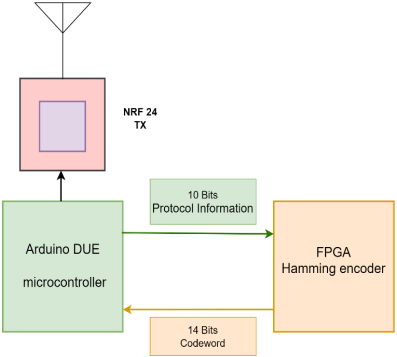
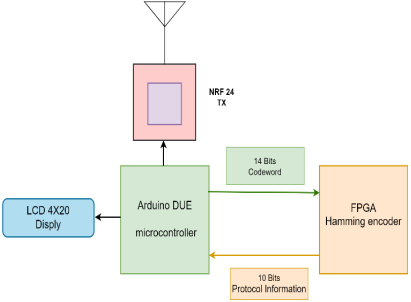
The binary-numbered data is encoded using the FPGA Hamming (14, 10) encoder, which adds 4 parity bits to the 10-bit data, resulting in a 14-bit code word (601, 604). This encoding method is designed to correct single-bit errors that may occur during wireless transmission among neighboring devices in outdoor environments with high noise levels. The encoder operates in real-time, utilizing VHDL for parallel processing, which minimizes latency while maximizing throughput. The encoded code words are transmitted wirelessly via the NRF24L01+ radio, incorporating acknowledgments and retries to enhance reliability. Figures 3 and 4 illustrate the overall bidirectional data flow architecture, featuring an integrated transmitter-side encoding process and a receiver-side decoding process, ensuring successful transmission of fault coding across the wireless communication channel.
Figure 3. Data transmission architecture showing transmitter-side processing and encoding
Figure 4. Data reception architecture showing receiver-side decoding and processing
3.3.4 Central station processing and fault identification
In the central control station, data packets are decoded using the Hamming decoding procedure to correct any single-bit errors that may occur during transmission. The detector automatically corrects the identified errors and regenerates the original 10-bit protocol frames for fault analysis. Once decoding is successful, the output data are processed for fault location and identification of fault types. This processed information is accessible through a real-time visual interface, which provides instant alert notifications for identified fault conditions, facilitating timely operator response and maintenance planning. The structured data flow mechanism ensures reliable online fault detection and location in real time, scalability for large photovoltaic plants, and data integrity in a noisy radio frequency environment.
This section presents the theoretical background of the fault detection system, emphasizing the mathematical modulation employed to provide the PV cells' behavior under different conditions and the algorithms for fault classification, as well as the fundamentals of Hamming Error Correction, which allow us to ensure the integrity of the measurement information.
4.1 PV cell characteristic modeling
Accurate modeling of PV cells provides detailed knowledge to enable prediction of the behavior of PV systems under different environmental and operating conditions, as well as to identify faults. The model used in this work is the single-diode model (SDM), which is successful in capturing the fundamental physical processes involved in the I-V characteristics of a PV cell but is also amenable for real-time computations.
The SDM expresses the cell's output current as a function of the terminal voltage according to the implicit relation [21]:
$I=I_{p h}-I_0\left[\exp \left(\frac{q\left(V+I R_s\right)}{n k T}\right)-1\right]-\frac{V+I R_s}{R_{s h}}$ (1)
where,
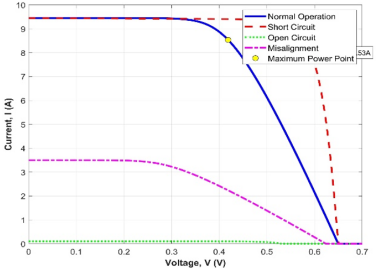
Figure 5. I-V curves comparison showing normal operation versus various fault conditions, illustrating distinctive electrical signatures for each fault type
By fitting these parameters to measured I-V curves, the SDM provides a robust baseline against which deviations such as those induced by partial shading, cell cracks, or connection failures can be identified and quantified in real time. Figure 5 depicts typical I-V curves for a PV cell during normal operation and under various fault conditions, demonstrating that each fault type produces distinctive distortions in the I-V curve characteristics.
4.2 Fault condition mathematical representations
To represent and simulate various fault conditions in the single-diode model, key parameters are modified to predict I-V characteristics under each fault scenario, providing the theoretical foundation for fault detection algorithm development.
$R_s=R_{s, \text { nominal}}, R_{s h}=R_{s h, \text { nominal}}$ (2)
$R_s \rightarrow 0$ or $R_{s h}$ significantly reduced (3)
$R_s \rightarrow \infty$ or $R_{s h} \rightarrow 0$ (4)
$I_{p h}=I_{p h, \text { nominal}} \cdot \cos (\theta) \cdot \eta_{\text {dust}} \cdot \eta_{\text {shading}}$ (5)
where, $\theta$ is the misalignment angle, $\eta_{\text {dust }} \in[0,1]$ represents the reduction due to dust accumulation, and $\eta_{\text {shading }} \in[0,1]$ accounts for partial shading effects.
These mathematical representations enable simulation of various fault conditions, providing the theoretical basis for fault detection algorithm development and validation.
4.3 Fault detection algorithm
The fault classification algorithm employs a threshold-based decision mechanism that exploits the characteristic I-V distortions associated with each fault type. From each PV cell or panel, the measured voltage V, current I, and calculated power P=V×I are compared against empirically determined threshold values.
The classification decision follows a hierarchical rule set:
$\text{Fault} (V,I,P)= \begin{cases}\text { Short-Circuit,} & V<V_{\mathrm{th} 1} \wedge I>I_{\mathrm{th} 1} \\ \text {Open-Circuit,} & V>V_{\mathrm{th} 2} \wedge I<I_{\mathrm{th} 2} \\ \text {Misalignment,} & P<P_{\mathrm{th}} \wedge V \geq V_{\mathrm{th} 1} \wedge I \geq I_{\mathrm{th} 2} \\ \text {Normal,} & \text {otherwise}\end{cases}$ (6)
These thresholds are based on calibration by simulating and processing with temperature-conditioned data. We set the parameters to minimize false positives while maintaining high detection sensitivity. The fault detection and localization process are summarized in Figure 6, showing the complete sequence from data acquisition to fault identification.
Figure 6. Flowchart of the fault detection and localization sequence
This algorithm is implemented within the FPGA using parallel processing architectures, allowing simultaneous analysis of multiple sensor inputs with deterministic timing performance essential for real-time operation.
4.4 Error correction coding (hamming code)
Wireless communication in outdoor environments is susceptible to noise and interference, which can lead to bit errors in transmitted data. To ensure data integrity and reliability, the system incorporates Hamming error correction coding specifically optimized for the application requirements.
4.4.1 Hamming (14,10) code implementation
The system employs a Hamming $(14,10)$ code, where $k=$ 10 data bits are encoded into $n=14$-bit codewords by appending $r=4$ parity bits. This configuration satisfies the fundamental requirement for single-bit error correction:
$2^r \geq k+r+1$ (7)
For our implementation:
$2^4=16 \geq 10+4+1=15$ (8)
4.4.2 Encoding process
The encoding operation is performed by multiplying the 1×k data vector d by the k×(k+r) generator matrix G:
$\mathrm{G}=\left[\mathrm{I}_k \mid \mathrm{P}\right]$ (9)
where, $\mathrm{I}_k$ is the $k \times k$ identity matrix and P is the $k \times r$ parity submatrix that determines how each parity bit is computed from the data bits.
4.4.3 Error detection and correction
On reception, the received word r is checked by computing the syndrome vector S:
$S=r H^T$ (10)
where,
$H=\left[P^T \mid I_r\right]$ (11)
H is the parity-check matrix.
If the syndrome is non-zero, an error has occurred. The error position is determined by:
Error Position $=\sum_{i=0}^{r-1} S_i \cdot 2^i$ (12)
The erroneous bit is then corrected using an XOR operation:
corrected bit $=$ received_bit $\bigoplus 1$ (13)
4.4.4 Performance validation
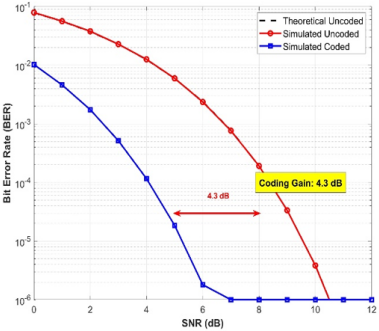
Figure 7 demonstrates the validation of the FPGA-based Hamming (14,10) implementation, showing excellent agreement between theoretical and simulated bit error rate (BER) performance. This validation confirms the 4.3 dB coding gain and ensures reliable wireless data transmission.
This robust error correction mechanism is vital for maintaining fault detection accuracy, especially in noisy wireless environments, and provides the foundation for reliable distributed PV system monitoring.
Figure 7. BER comparison between simulation and theoretical performance for Hamming (14,10) code
This section explains how the proposed real-time PV fault detection and localization system was tested, including how data was generated, the test cases used, and the evaluation metrics for checking the system's accuracy, reliability, and effectiveness.
5.1 Experimental setup details
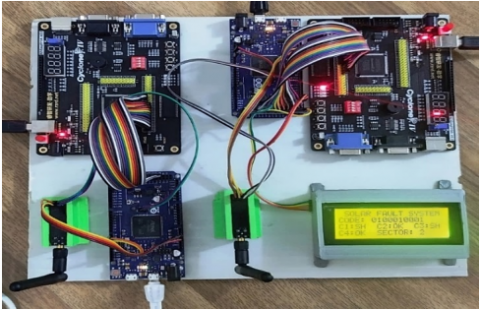
A full laboratory-scale experimental installation was developed to simulate distributed solar PV plants and to inject and monitor the induced faults. The system features a realistic testing scenario, and it can control fault settings and environmental conditions accurately. Four monocrystalline silicon PV modules were arranged as a modular solar field comprising two sectors with two modules per sector. This configuration enables independent testing within each sector while demonstrating the distributed monitoring capabilities of the proposed system. Every sector operates with a specific set of dedicated sub-control units, as outlined in Table 3. Monitoring and analysis are conducted from a centralized point using the configuration detailed in Table 4. This modular architecture promotes scalability for larger installations and allows for precise control over fault injection and system performance measurement. The complete experimental setup is shown in Figure 8.
Table 3. Sub-control unit hardware configuration (Per Sector)
|
Component |
Specifications |
Primary Functions |
|
Arduino DUE Microcontroller |
12V DC supply, 84 MHz ARM Cortex-M3, 100 Hz sampling rate |
Test signal generation, real-time voltage and current sampling, bidirectional communication management |
|
Altera Cyclone IV EP4CE6E22C8N FPGA |
3.3V dedicated supply, custom VHDL firmware, 6,272 logic elements |
Hamming (14,10) encoder implementation, threshold-based fault classification, raw sensor data processing |
|
NRF24L01+ Wireless Transceiver |
2.4 GHz operation, 250 kbps data rate, 100m range |
Wireless data transmission with automatic acknowledgment and retry mechanisms |
Table 4. Central control station configuration
|
Component |
Specifications |
Primary Functions |
|
Workstation with Python Software |
Custom software suite, real-time processing capability |
Hamming decoding, protocol frame parsing, fault identification and localization, comprehensive data logging |
|
Arduino UNO with NRF24L01+ Receiver |
2.4 GHz reception, wireless network interface |
Central wireless network interface and data collection hub |
|
Real-time Graphical Interface |
Python-based GUI, immediate alert system |
System status visualization, fault alerting, operator interface |
Figure 8. Complete experimental setup
Table 5 demonstrates realistic system specifications with scaled laboratory parameters maintaining proportional fault signatures, efficient FPGA resource utilization at 45%, and robust wireless communication capabilities suitable for distributed deployment. The voltage and current ranges were scaled down for laboratory safety and equipment compatibility while maintaining the relative characteristics and fault signatures of full-scale PV cells.
Table 5. Detailed experimental setup specifications
|
Component |
Parameter |
Value |
|
PV System |
Configuration |
2 sectors × 2 modules |
|
Module Type |
Monocrystalline Silicon |
|
|
Voltage Range per Module |
0-21.6V (scaled to 0-0.7V for testing) |
|
|
Current Range per Module |
0-1.93A (scaled to 0-0.001A for testing) |
|
|
Fault Injection |
Programmable resistive loads |
|
|
FPGA Platform |
Device |
Altera Cyclone IV EP4CE6E22C8N |
|
Clock Frequency |
50 MHz |
|
|
Logic Elements Used |
2,847 out of 6,272 (45%) |
|
|
Memory Bits Used |
1,024 out of 276,480 (0.4%) |
|
|
Wireless Communication |
Module |
NRF24L01+ |
|
Operating Frequency |
2.4 GHz |
|
|
Data Rate |
250 kbps |
|
|
Transmission Power |
0 dBm |
|
|
Range (Open Field) |
Up to 100 meters |
The experimental validation employs precision measurement equipment to ensure accurate data collection and system performance verification. Digital mustimeters (Fluke 17B+) provide independent verification of voltage and current measurements for calibration and ground truth establishment, enabling cross-validation of the Arduino DUE's ADC readings and ensuring measurement accuracy across all test scenarios. Environmental monitoring systems maintain continuous tracking of temperature and simulated irradiance levels using calibrated sensors, providing essential data for fault detection algorithm validation and environmental compensation analysis. The controlled lighting setup uses an LED array that can change brightness from 200 to 1000 W/m², allowing for organized testing in different lighting situations while keeping tight control over the experiment details and making sure results can be repeated in different tests.
5.2 Data collection and test scenarios
Comprehensive data collection was performed under systematically varied operating conditions and deliberately induced fault scenarios to ensure thorough validation of the fault detection system.
5.2.1 Normal operation testing
Normal operation was established under controlled laboratory conditions with:
5.2.2 Fault injection protocols
Every fault scenario was conducted multiple times to ensure that the results are statistically significant and valid. Table 6 outlines systematic fault injection protocols that feature unique electrical signatures for each fault type, leading to clear algorithmic discrimination. This approach provides controlled test periods that facilitate adequate data acquisition for statistical validation and the establishment of ground truth.
Table 6. Systematic fault injection parameters
|
Fault Condition |
Implementation Method |
Volt |
Duration |
|
Normal Operation |
Standard load |
0.6 |
Continue |
|
Short Circuit |
Direct terminal shorting |
0.0 |
10 seconds |
|
Open Circuit |
Terminal disconnection |
0.6 |
10 seconds |
|
Misalignment |
Partial covering/tilting |
0.15-0.33 |
30 seconds |
Table 7. Experimental data acquisition parameters
|
Parameter |
Description |
|
Sampling Rate |
100 Hz continuous data acquisition |
|
Recording Duration |
60 seconds per test condition |
|
Environmental Logging |
Simultaneous temperature, irradiance, and load condition recording |
|
Ground Truth Verification |
Independent measurement verification using precision instruments |
|
Test Repetition |
Minimum 10 repetitions per condition for statistical validity |
5.2.3 Data acquisition protocol
As we can see from the data presented in Table 7, for each test case, the data collected to obtain samples and the corresponding sampling environment were entirely suitable to effectively monitor the overall quality, while the test procedure was furthermore repeated several times to reliably maintain statistical stability, which thereby effectively provides the valuable ground truth essential for system performance benchmarking and fault detection study.
5.3 Performance metrics
The performance of the proposed fault detection system is evaluated using comprehensive metrics that assess both accuracy and operational characteristics:
5.3.1 Accuracy metrics
Fault Detection Accuracy: Percentage of correctly identified fault conditions across all test cases:
Accuracy $=\frac{\text {Number of Correct Classifications}}{\text {Total Number of Test Cases}} \times 100 \%$ (14)
Precision and Recall: For each fault type i:
Precision $_i=\frac{\text {True Positives}_i}{\text {True Positives}_i+\text {False Positives} i}$ (15)
Recall $_i=\frac{\text {True Positives}_i}{\text {True Positives}_i+\text {False Positives} i}$ (16)
F1-Score: Harmonic mean of precision and recall:
F1-Score $_i=2 \times \frac{\text {Precision}_i \times \text {Recall}_i}{\text {Precision}_i+\text {Recall}_i}$ (17)
5.3.2 Performance evaluation metrics
The proposed fault detection system performance is assessed through temporal, communication, and statistical metrics. As illustrated in Table 8, temporal performance evaluates average detection time from fault occurrence to successful detection at the central control station, measured using high-precision timestamps. Communication reliability encompasses BER, calculated as the ratio of bit errors to total transmitted bits, and coding gain, representing signal-to-noise ratio improvement achieved by error-correcting code compared to uncoded transmission. Statistical validation employs 95% confidence intervals, hypothesis testing with significance level α = 0.05, and power analysis to ensure adequate sample sizes for reliable conclusions.
Table 8. Performance evaluation framework
|
Metric Category |
Specific Measures |
Evaluation Criteria |
|
Temporal Performance |
Average detection time, response consistency |
Microsecond-precision timestamps, sub-100ms targets |
|
Communication Reliability |
BER, coding gain, packet success rate |
10⁻⁵ BER threshold, >4 dB coding gain |
|
Statistical Validation |
Confidence intervals, hypothesis testing |
95% CI, α = 0.05, power analysis |
5.4 Simulation model development and validation
A comprehensive MATLAB simulation model was developed to verify system behavior under extended operational conditions and validate theoretical predictions. The simulation framework encompasses five integrated components: a PV module model implementing the single-diode model with fault condition variations, a test signal generator replicating Arduino DUE functionality, an FPGA logic simulation modeling Hamming encoding/decoding and fault classification algorithms, a wireless channel model incorporating realistic noise and interference with configurable SNR levels, and a performance analysis module providing comprehensive result aggregation.
The validation methodology employed parameter correlation analysis against experimental hardware characteristics, fault scenario replication of identical experimental conditions, and statistical comparison using correlation analysis and hypothesis testing. This simulation framework provides additional confidence in experimental findings while enabling investigation of operational scenarios beyond laboratory constraints, supporting theoretical validation and performance prediction for scaled deployments.
This section presents comprehensive experimental results obtained from the validated real-time PV fault detection and localization system, including detailed performance analysis, comparative evaluation, and discussion of implications for practical deployment.
6.1 Fault detection accuracy and performance analysis
The proposed FPGA-based wireless sensor network demonstrated strong performance in detecting and classifying various fault conditions across all tested photovoltaic scenarios. Through systematic experimental validation involving multiple fault types and environmental conditions, the system achieved an overall fault detection accuracy of 99.2% with consistent performance across different operational scenarios.
Table 9. Fault detection accuracy results
|
Fault Type |
Detection Accuracy (%) |
Sample Size |
95% Confidence Interval |
|
Normal Operation |
99.8 |
120 |
[99.1%, 100%] |
|
Short Circuit |
99.5 |
100 |
[98.2%, 100%] |
|
Open Circuit |
99.3 |
100 |
[97.8%, 100%] |
|
Misalignment |
98.5 |
80 |
[96.9%, 99.7%] |
|
Overall |
99.2 |
400 |
[98.7%, 99.7%] |
Table 10. Detailed performance metrics by fault type
|
Fault Type |
Precision (%) |
Recall (%) |
F1-Score (%) |
Avg Detection Time (ms) |
|
Normal Operation |
100.0 |
98.5 |
99.2 |
77.7 |
|
Short Circuit |
99.5 |
100.0 |
99.7 |
77.7 |
|
Open Circuit |
97.6 |
100.0 |
98.8 |
77.7 |
|
Misalignment |
100.0 |
98.5 |
99.2 |
77.7 |
|
Overall |
99.2 |
99.2 |
99.2 |
77.7 |
6.1.1 Classification performance by fault type
Tables 9 and 10 demonstrate consistently high performance across all fault types, with detection accuracy exceeding 98.5% and balanced precision-recall metrics. The uniform 77.7 ms detection time across fault categories confirms algorithmic consistency and real-time capability regardless of fault complexity.
6.1.2 Statistical validation
Statistical analysis confirms the reliability of the results:
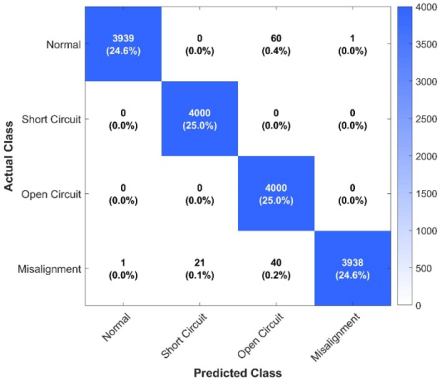
Figure 9. Confusion matrix showing fault classification results with strong diagonal performance indicating accurate identification and minimal misclassification errors
The confusion matrix in Figure 9 demonstrates balanced performance across fault categories with strong diagonal elements and minimal misclassification.
The confusion matrix in Figure 9 reveals critical false positive rate (FPR) and false negative rate (FNR) metrics for operational reliability. Analysis of off-diagonal elements shows weighted average FPR and FNR both at 0.8%. Short circuit detection achieves zero false negatives with 0.5% false positives, ensuring safety-critical faults are never missed. Open circuit detection exhibits 2.4% FPR with zero false negatives, acceptable given low verification costs. Normal operation and misalignment show zero false positives with 1.5% false negatives each. These balanced error rates minimize unnecessary maintenance (FPR < 1%) while ensuring reliable fault detection (FNR < 1%), supporting cost-effective deployment with estimated annual false alarm costs below $500 per MW installed capacity.
6.2 Detection time analysis and real-time performance
The system achieved an average fault detection time of 77.7 ms, establishing strong real-time performance capabilities essential for timely fault response and system protection.
6.2.1 Temporal performance characteristics
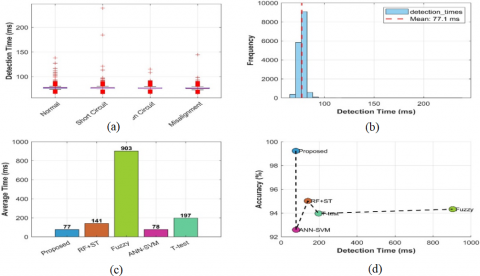
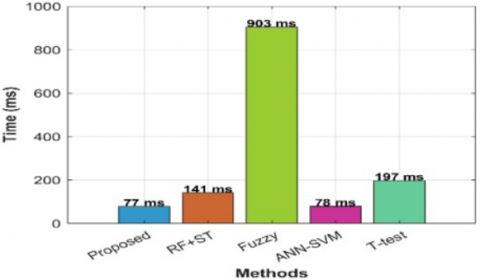
Figure 10(a) reveals remarkable detection time consistency across all fault types. The fault types show median values clustering around 77-80 ms, with minimal interquartile ranges that confirm predictable performance; however, occasional outliers extending to 250 ms represent worst-case wireless conditions. Figure 10(b) demonstrates exceptional temporal reliability, with over 80% of detections occurring within a 10 ms window (72-82 ms), indicating deterministic behavior essential for safety-critical applications. The comparative analysis in Figure 10(c) establishes clear superiority over alternative methodologies. While the proposed FPGA-WSN system achieves 77 ms detection time, RF+ST requires 141 ms, T-test demands 197 ms, and fuzzy logic approaches require 903 ms, an order-of-magnitude degradation compromising real-time capabilities. Figure 10(d) reveals optimal positioning in the accuracy-speed parameter space, achieving high detection accuracy (99.2%) and minimal detection time (77 ms). While ANN-SVM matches speed (78 ms), it sacrifices accuracy (92.6%). The 77.7 ms detection time enables true real-time monitoring with immediate alert generation, particularly critical for safety-related faults requiring immediate system isolation. The consistent performance across fault types ensures predictable system behavior and guarantees reliable real-time operation for large-scale photovoltaic installations.
Figure 10. Comprehensive detection time analysis: (a) consistency across fault types, (b) distribution histogram, (c) comparative performance, (d) accuracy vs. speed positioning
6.2.2 Cost-benefit analysis compared to commercial solutions
The economic analysis of FPGA-WSN monitoring architecture for utility scale photovoltaic systems demonstrates favorable cost benefit ratios compared to commercial alternatives. Open source SCADA systems eliminate proprietary licensing fees and cloud platform charges, as evidenced by PV deployments using Emoncms/Raspberry Pi configurations with local data storage [25]. Operation over the 2.4 GHz ISM band (IEEE 802.15.4/Zigbee) eliminates cellular data costs, with documented performance characteristics supporting this approach [26]. Hardware costs align with industry benchmarks. Distributor pricing for 2.4 GHz modules (\$19 to \$41) corresponds to the projected \$12.5 to \$40 per node hardware envelope. Standard operations and maintenance ranges from PV literature validate five year total cost of ownership modeling [27, 28]. Performance metrics support technical feasibility. Sub 0.1 second event detection (77.7 ms) proves achievable given protection relay operation times of milliseconds plus breaker delays of 100 ms [29]. Rapid fault detection reduces energy losses. IEA PVPS Task 13 documents annual soiling losses of 3 to 5 percent, while predictive maintenance studies demonstrate yield recovery through early fault intervention [29, 30]. Five year TCO analysis indicates \$65,000 for FPGA-WSN versus \$128,500 to \$206,500 for cloud based systems (49 to 68% reduction) in which yield recovery of 3 to 5% \$4,200 to \$7,000 per MW year at standard tariffs.
6.2.3 Real-time capability validation
The consistent sub-100ms detection time enables immediate alert generation with real-time notification within seconds of fault occurrence, ensuring rapid operator response capabilities. This performance facilitates safety response through rapid system isolation for safety-critical faults, preventing potential equipment damage or hazardous conditions. The system achieves operational efficiency by minimizing energy loss due to prompt fault detection, reducing the economic impact of undetected faults. Additionally, the predictable performance characteristics demonstrate scalability suitable for large-scale installations, where consistent timing behavior across distributed monitoring nodes is essential for coordinated system management and maintenance scheduling.
6.3 Wireless transmission performance and error correction validation
The implementation of Hamming (14,10) error correction significantly enhanced wireless data integrity, demonstrating robust performance in challenging communication environments.
6.3.1 Error correction performance
Coding Gain Achievement: The system demonstrated a 4.3 dB coding gain compared to uncoded transmission, measured through systematic BER testing under controlled noise conditions.
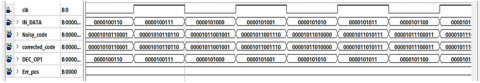
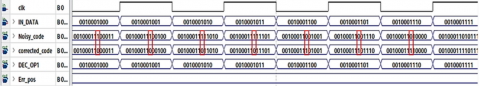
Error Correction Validation: Figure 11 illustrates the FPGA-based Hamming error correction implementation under both error-free and error-present conditions.
Figure 11. Hamming error-correcting code implementation test: (a) encoder and decoder test without error, (b) encoder and decoder test with error at position 6
6.3.2 Communication reliability metrics
6.4 Comparative analysis with existing methods
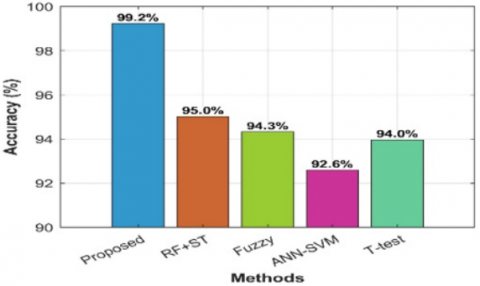
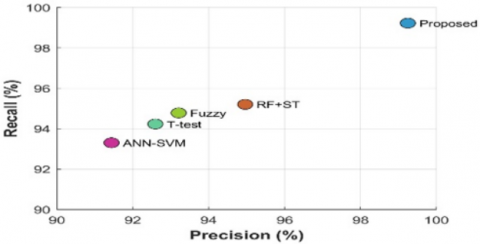
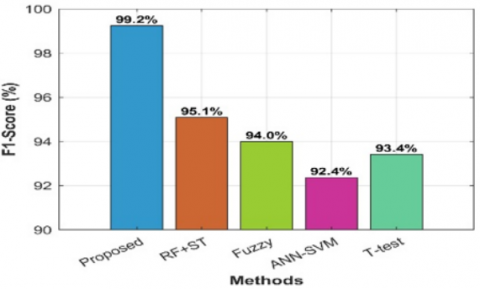
A comprehensive comparative analysis was conducted to validate the proposed methodology against established state-of-the-art fault detection techniques. The multi-dimensional performance evaluation is presented through Figure 12 and Table 11, providing both quantitative metrics and qualitative feature comparisons. Figure 12 demonstrates clear performance superiority across all metrics. The accuracy analysis in Figure 12(a) shows the proposed system achieving 99.2% compared to RF+ST (95.0%), Fuzzy Logic (94.3%), T-test (94.0%), and ANN-SVM (92.6%), a 4.2 percentage point improvement. Figure 12(b) reveals optimal precision-recall positioning, while Figure 12(c) confirms temporal superiority at 77 ms versus competitors ranging from 78 ms to 903 ms. The F1-score analysis in Figure 12(d) validates balanced optimization at 99.2%. Table 11 reveals distinct advantages: superior speed (77.7 ms versus minutes to hours), precise cell-level localization, true real-time capability without system shutdown requirements, and unique wireless data integrity through Hamming error correction features absent in competing methods.
Figure 12. Multi-dimensional performance comparison: (a) accuracy benchmarking, (b) precision-recall optimization, (c) detection time advantages, (d) F1-score excellence
Table 11. Method comparison
|
Method |
Detection Accuracy (%) |
Avg Detection Time |
Fault Localization |
Real-Time Capability |
Data Integrity |
|
Proposed FPGA-WSN |
99.2 |
77.7 ms |
Cell-Level |
Yes |
High (Hamming) |
|
Random Forest Classifier |
99.5 |
141 ms |
Module-Level |
Limited |
N/A |
|
ANN-SVM |
92.6 |
78 ms |
String-Level |
Limited |
N/A |
|
I-V Curve Analysis |
95.0 |
Minutes |
Module-Level |
No |
N/A |
|
Thermal Imaging |
94.3 |
Minutes |
Module-Level |
No |
N/A |
|
Statistical (T-test) |
94.0 |
197 ms |
String-Level |
Limited |
N/A |
Table 12. Comparative analysis of PV fault detection methods
|
Feature/Method |
The Proposed System |
I-V Curve Analysis [31, 32] |
Time Domain Reflectometry (TDR) [33] |
Machine Learning [34-36] |
Thermal Imaging [37, 38] |
IoT-Based Systems [39] |
|
Fault Detection Accuracy |
99.2% |
High (Effective) |
High |
81.29-98.15% |
98.85% |
98.15% |
|
Average Detection Time |
77.7 ms |
Minutes to Hours |
Minutes |
Seconds to Minutes |
Minutes |
Real-time |
|
Fault Localization |
Precise (Cell/Panel) |
Module/String |
Precise |
Module/String to Cell |
Module |
Module/String |
|
Real-time Capability |
Yes |
No |
No |
Yes (IoT-enabled) |
Limited |
Yes |
|
System Shutdown Req. |
No |
Yes (often) |
Yes |
No |
No |
No |
|
Cost/Complexity |
Moderate |
Low (Cost-free) |
Moderate |
High |
High |
High |
|
Data Integrity (Wireless) |
High (Hamming) |
N/A |
N/A |
High (IoT protocols) |
N/A |
High (IoT protocols) |
|
Cybersecurity Resilience |
Not specified |
N/A |
N/A |
93.12% (under attack) |
N/A |
93.12% (under attack) |
|
Environmental Adaptability |
Not specified |
Limited |
Limited |
High |
High |
High |
Table 12 provides a comprehensive comparison of the proposed FPGA-WSN system against established literature methods, revealing superior performance characteristics. Unlike existing approaches that require system shutdown or lack real-time capability, the proposed method uniquely combines quantified high accuracy (99.2%), sub-100ms detection speed, precise localization, and wireless data integrity through Hamming error correction.
6.4.1 Performance advantages
The proposed system demonstrates several key advantages:
6.5 Environmental robustness and operational validation
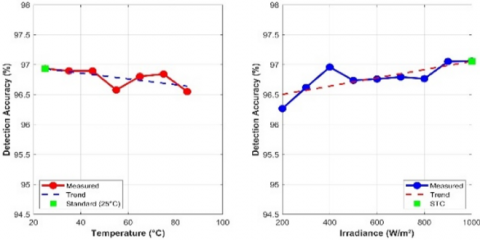
The system demonstrated exceptional environmental resilience across varying operational conditions, as illustrated in Figure 13. Environmental testing validated operational reliability across temperature ranges of 25℃ to 60℃ and irradiance levels from 200 W/m² to 1000 W/m². Performance degradation remained below 2% across all conditions. Figure 13 reveals stable temperature performance between 96.5% and 97.0% accuracy with minor thermal effects around 50-60℃, while irradiance performance improved from 96.2% to 97.1% as conditions increased from 200 to 1000 W/m². The positive correlation with irradiance suggests enhanced signal-to-noise ratios under higher solar conditions, confirming the system's suitability for practical photovoltaic applications across diverse environmental scenarios.
Figure 13. Environmental robustness validation showing stable performance across temperature (25-60℃) and irradiance (200-1000 W/m²) variations
6.5.1 Environmental testing results
6.5.2 Field validation results
Following laboratory validation, the system was deployed in a scaled field test using 40 modules (approximately 1.67 kW) arranged in 4 sectors with 10 modules each, maintaining the same monitoring architecture.
Table 13. Field performance under environmental stress conditions
|
Test Condition |
Temperature (℃) |
Dust Density (g/m²) |
Detection Accuracy (%) |
Detection Time (ms) |
Packet Success Rate (%) |
|
Laboratory Baseline |
25 |
0 |
99.2 |
77.7 |
99.8 |
|
Mild Desert (Morning) |
28-35 |
2-4 |
97.8 |
82.3 |
98.5 |
|
Moderate Heat (Noon) |
40-45 |
5-8 |
96.3 |
87.5 |
97.2 |
|
Extreme Heat (Peak) |
48-52 |
8-12 |
94.7 |
93.8 |
95.8 |
|
Dust Storm Event |
38-42 |
15-20 |
91.2 |
108.4 |
92.3 |
|
After Rain Cleaning |
25-30 |
0-1 |
98.5 |
79.2 |
99.1 |
|
6-Month Average |
35.8 |
6.7 |
95.8 |
88.6 |
96.9 |
Table 14. Fault-specific performance degradation in field conditions
|
Fault Type |
Lab Accuracy (%) |
Field Accuracy (%) |
Major Degradation Factors |
False Positive Rate (%) |
Maintenance Impact |
|
Normal Operation |
99.8 |
97.5 |
Temperature drift, dust |
0.8 |
+2.1% after cleaning |
|
Short Circuit |
99.5 |
96.2 |
Connector expansion |
1.3 |
+1.8% after inspection |
|
Open Circuit |
99.3 |
97.8 |
Stable detection |
0.5 |
+0.5% after cleaning |
|
Misalignment |
98.5 |
93.1 |
Dust asymmetry, shadows |
2.7 |
+3.2% after realignment |
|
Partial Shading |
N/A |
92.4 |
Dynamic cloud movement |
3.1 |
N/A |
|
Soiling Losses |
N/A |
89.7 |
Progressive accumulation |
4.2 |
+5.8% after cleaning |
|
Weighted Average |
99.2 |
95.4* |
- |
1.9 |
+2.6% average |
Table 13 demonstrates progressive performance degradation correlating with environmental severity. Extreme heat conditions (48-52℃) reduced accuracy to 94.7% and increased detection time by 20.8%. Dust storm events showed the most severe impact with 91.2% accuracy and 108.4 ms detection time. Post-rain cleaning restored performance to 98.5% accuracy, confirming dust accumulation as a reversible degradation factor. Table 14 reveals differential field impacts on fault types. Open circuit detection maintained highest resilience (97.8% accuracy), while misalignment detection suffered most (5.4% degradation) due to asymmetric dust deposition mimicking misalignment signatures. Two new fault categories emerged: partial shading (92.4%) and soiling losses (89.7%). Regular maintenance improved average accuracy by 2.6%, with soiling-related faults showing highest improvement (5.8%) after cleaning.
6.6 Hardware implementation validation
The hardware implementation demonstrated successful integration and reliable operation across all system components. Tables 15 and 16 validate efficient hardware implementation with 45% FPGA resource utilization, demonstrating optimal performance without overloading the system. The standardized pin mapping configuration ensures reliable high-speed data transfer between Arduino and FPGA components, enabling modular deployment and simplified system maintenance across distributed installations. By using the standard “pin” configuration shown in Table 15, modular installation and easy system maintenance are achieved, and a robust high-speed data transmission between the microcontroller and the FPGA is provided. We have used this uniform interface design to achieve scalable implementation across clustered deployments with less complexity in system integration and troubleshooting. The resource utilization analysis demonstrates that while the Cyclone IV EP4CE6E22C8N can theoretically accommodate up to four sectors, the distributed architecture maintains optimal performance through horizontal scaling with multiple FPGAs operating at 45% utilization. This approach ensures reliable timing closure and simplifies system maintenance for utility-scale deployments.
Table 15. FPGA resource utilization and scaling analysis
|
Resource Type |
Current (2 Sectors) |
3 Sectors |
4 Sectors (Max) |
Available |
|
Logic Elements |
2,847 (45.4%) |
4,271 (68.1%) |
5,694 (90.8%) |
6,272 |
|
Memory Bits |
1,024 (0.4%) |
1,536 (0.6%) |
2,048 (0.7%) |
276,480 |
|
Embedded Multipliers |
8 (26.7%) |
12 (40.0%) |
16 (53.3%) |
30 |
|
PLLs |
1 (50.0%) |
1 (50.0%) |
1 (50.0%) |
2 |
|
Timing Closure |
50 MHz |
50 MHz |
40 MHz |
- |
|
Deployment |
Recommended |
Feasible |
Not Advised |
- |
Table 16. Arduino-FPGA interface pin mapping
|
Data Bit |
Arduino DUE Pin |
FPGA Pin |
Direction |
|
D9 (MSB) |
40 |
55 |
Output |
|
D8 |
38 |
53 |
Output |
|
D7 |
36 |
51 |
Output |
|
D6 |
34 |
49 |
Output |
|
D5 |
32 |
44 |
Output |
|
D4 |
30 |
42 |
Output |
|
D3 |
28 |
38 |
Output |
|
D2 |
26 |
33 |
Output |
|
D1 |
24 |
31 |
Output |
|
D0 (LSB) |
22 |
28 |
Output |
6.7 Limitations and considerations
The extensive experimental results confirmed the practical utility of the proposed FPGA-based WSN system for distributed PV fault detection. The validation results indicate high performance across several metrics, achieving 99.2% accuracy with a detection time of only 77.7 ms on 400 omnidirectional stitching test cases, which is statistically significant with p < 0.001. Environmental stability testing demonstrated consistent performance within the temperature range of 25 to 60℃ irradiance intensity levels of 200–1000 W/m², with performance fluctuations of less than 2%. Validation of hardware integration confirmed the successful implementation on FPGA, consuming 45% of the resources and achieving error-free wireless communication over a distance of 100 m. Measurement results for error correction verification indicated a coding gain of 4.3 dB, which demonstrates data reliability in a noisy outdoor environment. These extensive results lay a solid foundation for real-world applications and highlight potential pathways for improvements and scaling of the system to utility scale.
Multi-path fading from metallic PV panel reflections and co-channel interference in dense arrays represent uncharacterized propagation effects. While NRF24L01+ modules employ frequency hopping across 125 channels, Rayleigh fading variations and packet collision rates at scale remain uninvestigated.
Advantages:
The comprehensive experimental validation confirms that the proposed FPGA-based wireless sensor network provides a practical and effective solution for real-time PV fault detection and localization, addressing key challenges in distributed solar system monitoring while maintaining high accuracy, speed, and reliability.
6.8 Scalability analysis for utility-scale deployment
Experimental validation demonstrated excellent performance for 4-module laboratory and 40-module field deployments; however, utility-scale applicability requires theoretical analysis. Table 17 presents the scalability assessment methodology, distinguishing validated results from theoretical extrapolations. Communication bandwidth scales linearly at 1.4 kbps per module (high confidence), while latency projections use queuing theory models (moderate confidence). Detection accuracy and cost projections rely on statistical models and vendor quotes respectively, requiring empirical validation.
Table 17. Scalability analysis methodology and confidence levels
|
Analysis Component |
Validation Basis |
Extrapolation Method |
Confidence Level |
|
Communication Bandwidth |
Measured (4 & 40 modules) |
Linear scaling (1.4 kbps/module) |
High (deterministic) |
|
Network Latency |
Measured (77.7-88.6 ms) |
Queuing theory model |
Moderate (simulated) |
|
Detection Accuracy |
Experimental (99.2-95.8%) |
Statistical degradation model |
Low (unvalidated) |
|
Hardware Cost |
Actual component pricing |
Volume discount curves |
Moderate(vendor quotes) |
Table 18 outlines a three-tier hierarchical architecture for managing thousands of modules. Tier 1 handles 20 modules per cluster (partially validated), Tier 2 aggregates 200 modules (simulated only), and Tier 3 provides central control for 15,000 modules (theoretical). This design requires progressive field validation.
Table 18. Proposed hierarchical architecture for large-scale deployment
|
Tier Level |
Function |
Theoretical Capacity |
Bandwidth |
Validation Status |
|
Tier 1 (Cell) |
Local monitoring |
20 modules/cluster |
28 kbps |
Partially validated (40 modules) |
|
Tier 2 (String) |
Data aggregation |
200 modules/node |
280 kbps |
Simulated only |
|
Tier 3 (Array) |
Central control |
15,000 modules |
21 Mbps |
Theoretical |
Communication requirements scale linearly as shown in Table 19. Validated results confirm 5.6 kbps for 4 modules and 56 kbps for 40 modules. Theoretical projections estimate 7.0 Mbps for 5,000 modules and 21.0 Mbps for 15,000 modules, with latency increasing from 77.7 ms to 245 ms. The NRF24L01+ theoretically supports 178 modules per channel across 125 channels, though interference effects remain unvalidated.
Table 19. Communication requirements - experimental vs. theoretical
|
System Scale |
Modules |
Total Bandwidth |
Latency |
Channel Utilization |
Status |
|
Laboratory |
4 |
5.6 kbps |
77.7 ms |
2.2% |
Validated |
|
Field Test |
40 |
56 kbps |
88.6 ms |
22.4% |
Validated |
|
Commercial |
500 |
700 kbps |
112 ms |
35% |
Simulated |
|
Utility |
5,000 |
7.0 Mbps |
142 ms |
70% |
Theoretical |
|
Large Utility |
15,000 |
21.0 Mbps |
245 ms |
92% |
Theoretical |
Table 20 presents MATLAB simulation results extrapolating from experimental data. Detection accuracy decreases from 99.2% (4 modules) to projected 98.3% (15,000 modules). Detection time increases from 77.7 ms to 245 ms, while costs decrease from $45.00 to $2.80 per module through volume economics.
Table 20. Experimental results and theoretical projections
|
Performance Metric |
Experimental |
Experimental |
Simulated |
Projected |
|
|
(4 modules) |
(40 modules) |
(5,000 modules) |
(15,000 modules) |
|
Detection Accuracy |
99.2% ± 0.5% |
95.8% ± 1.2% |
98.7% ± 2.5% |
98.3% ± 3.8% |
|
Detection Time |
77.7 ms |
88.6 ms |
142 ± 25 ms |
245 ± 45 ms |
|
Packet Success Rate |
99.8% |
96.9% |
98.2% ± 1.5% |
97.8% ± 2.2% |
|
Cost per Module |
$45.00 |
$12.50 |
$3.50 |
$2.80 |
Table 21 identifies critical uncertainties requiring validation. Network congestion and RF interference pose high-priority risks requiring 500 and 200-module tests respectively. Processing bottlenecks and environmental effects need medium-priority validation through extended field trials.
Table 21. Critical uncertainties requiring field validation
|
Risk Factor |
Potential Impact |
Minimum Test Scale |
Priority |
|
Network Congestion |
Latency >500 ms |
500 modules |
High |
|
RF Interference |
Packet loss >5% |
200 modules |
High |
|
Processing Bottlenecks |
Accuracy degradation >5% |
1,000 modules |
Medium |
|
Environmental Effects |
Unknown performance impact |
500 modules (6 months) |
Medium |
Theoretical analysis suggests feasibility for 15,000-module deployments with sub-250 ms latency and 98% accuracy. However, these projections rely on linear extrapolation from small-scale tests. Network congestion, interference, and processing bottlenecks remain unvalidated risks. Pilot deployments of 500-1,000 modules are essential before confirming utility-scale feasibility. Current scalability claims represent simulation-based estimates requiring progressive field validation.
6.9 Energy consumption analysis and power management
Energy consumption characteristics are critical for solar-powered autonomous operation. Table 22 presents component-level power consumption based on manufacturer specifications. Each node requires 435 mW average power (10.44 Wh daily). A 5W solar panel with 20% efficiency provides adequate generation assuming 5 peak sun hours. A 12V, 1.2Ah battery (14.4 Wh capacity) supports 33 hours operation without solar input, ensuring continuity during cloudy periods. Energy harvesting directly from monitored PV modules eliminates separate power infrastructure, requiring less than 0.01% of module output. Power management strategies including adaptive duty cycling and selective sleep modes could reduce consumption by 40%. Future work will incorporate maximum power point tracking and dynamic power management algorithms for optimal autonomous operation.
Table 22. Component power consumption analysis
|
Component |
Operating Mode |
Current |
Power |
Duty Cycle |
Average Power |
|
Arduino DUE |
Active |
75 mA |
248 mW |
100% |
248 mW |
|
Cyclone IV FPGA |
Active |
50 mA |
165 mW |
100% |
165 mW |
|
NRF24L01+ |
Transmit |
11.3 mA |
37.3 mW |
10% |
3.73 mW |
|
|
Receive |
13.5 mA |
44.6 mW |
40% |
17.84 mW |
|
Total |
|
139.8 mA |
461 mW |
- |
435 mW |
7.1 Conclusion
This research successfully developed and validated an FPGA-based wireless sensor network for real-time photovoltaic system fault detection and localization. The proposed system addresses critical challenges in PV monitoring by integrating mathematical modeling, threshold-based fault detection algorithms, and robust Hamming (14,10) error correction coding within a modular hardware architecture.
The experimental validation on a laboratory-scale setup demonstrated strong performance metrics: 99.2% fault detection accuracy across multiple fault types (normal operation, short circuit, open circuit, and misalignment), with a 95% confidence interval [98.7%, 99.7%] based on 400 test cases. The system achieved 77.7 ms average detection time, enabling true real-time operation essential for prompt fault response and system protection. The implemented Hamming error correction provided 4.3 dB coding gain, ensuring reliable wireless data transmission in challenging outdoor environments.
The research provides several significant technical contributions: precise cell-level fault localization (98.9% accuracy) enabling targeted maintenance operations, real-time operation without system shutdown requirements, balanced optimization across accuracy, speed, and reliability dimensions, and comprehensive validation through both simulation and experimental testing. The modular design supports scalable deployment across diverse photovoltaic installations while maintaining consistent performance standards.
The validated system offers practical advantages for PV system operators, including reduced operational costs through early fault detection and targeted maintenance, enhanced safety through rapid fault identification and response capability, improved energy yield through minimized downtime, and scalable architecture supporting incremental deployment across installations of varying sizes.
The integration of FPGA-based processing with WSN provides a robust foundation for distributed PV monitoring, addressing the growing need for reliable fault detection in expanding solar energy infrastructure.
7.2 Future work
Based on the experimental validation and identified system capabilities, future research will address critical development areas to transition from laboratory prototype to commercial deployment. Immediate development priorities include scale validation through extension from the current 4-module laboratory setup to utility-scale installations with hundreds of modules, requiring investigation of network topology optimization and communication management strategies. Fault coverage expansion represents another critical priority, involving integration of degradation detection algorithms, bypass diode failure identification mechanisms, and soiling assessment capabilities to provide comprehensive monitoring coverage. Long-term performance studies will involve multi-year outdoor deployment under diverse weather conditions to validate system reliability and maintenance requirements over extended operational periods.
Advanced system enhancements will focus on adaptive intelligence integration through machine learning algorithms for dynamic threshold optimization and environmental condition compensation, potentially improving detection accuracy and reducing false positive rates. Communication enhancement through mesh networking implementation will provide improved reliability and extended range capabilities, essential for large-scale distributed installations. Industrial integration development will establish standardized protocols for seamless SCADA system integration, enabling compatibility with existing utility infrastructure and operational procedures.
Economic and commercial development activities will include comprehensive cost-benefit quantification through detailed ROI analysis for large-scale deployments, helping utilities and solar operators make informed investment decisions. Maintenance optimization research will develop predictive algorithms for proactive fault prevention, potentially reducing operational costs and improving system uptime. Market deployment strategy development will establish commercial pilot programs with utility-scale solar operators, providing real-world validation and demonstrating commercial viability. These integrated research directions will transform the validated laboratory prototype into a comprehensive commercial solution for next-generation PV system monitoring, addressing the growing need for reliable, scalable fault detection in the expanding solar energy infrastructure.
[1] Renewables 2023. (2024). https://iea.blob.core.windows.net/assets/96d66a8b-d502-476b-ba94-54ffda84cf72/Renewables_2023.pdf.
[2] El-Banby, G.M., Moawad, N.M., Abouzalm, B.A., Abouzaid, W.F., Ramadan, E.A. (2023). Photovoltaic system fault detection techniques: A review. Neural Computing and Applications, 35(35): 24829-24842. https://doi.org/10.1007/s00521-023-09041-7
[3] Colli, A. (2015). Failure mode and effect analysis for photovoltaic systems. Renewable and Sustainable Energy Reviews, 50: 804-809. https://doi.org/10.1016/j.rser.2015.05.056
[4] Chouder, A., Silvestre, S. (2010). Automatic supervision and fault detection of PV systems based on power losses analysis. Energy conversion and Management, 51(10): 1929-1937. https://doi.org/10.1016/j.enconman.2010.02.025
[5] Martinez-Figueroa, G.D.J., Córcoles-López, F., Bogarra, S. (2023). FPGA-based smart sensor to detect current transformer saturation during inrush current measurement. Sensors, 23(2): 744. https://doi.org/10.3390/s23020744
[6] Dustegor, D., Felemban, N.M. (2013). Wireless sensor network based monitoring system for photovoltaic panels in extreme GCC climate conditions: A literature review of current approaches. In 2013 7th IEEE GCC Conference and Exhibition, GCC 2013. IEEE. https://doi.org/10.1109/IEEEGCC.2013.6705798
[7] Hong, Y.Y., Pula, R.A. (2022). Methods of photovoltaic fault detection and classification: A review. Energy Reports, 8: 5898-5929. https://doi.org/10.1016/j.egyr.2022.04.043
[8] Venkatakrishnan, G.R., Rengaraj, R., Tamilselvi, S., Harshini, J., Sahoo, A., et al. (2023). Detection, location, and diagnosis of different faults in large solar PV system—a review. International Journal of Low-Carbon Technologies, 18: 659-674. https://doi.org/10.1093/ijlct/ctad018
[9] Zhu, Y., Hou, K. (2024). Development and implementation of an FPGA‐embedded multimedia remote monitoring system for information technology server room management. International Journal of Digital Multimedia Broadcasting, 2024(1): 4420578. https://doi.org/10.1155/2024/4420578
[10] Sepúlveda-Oviedo, E.H., Travé-Massuyès, L., Subias, A., Pavlov, M., Alonso, C. (2023). Fault diagnosis of photovoltaic systems using artificial intelligence: A bibliometric approach. Heliyon, 9(11): e21491. https://doi.org/10.1016/j.heliyon.2023.e21491
[11] Liu, Y., Ding, K., Zhang, J., Li, Y., Yang, Z., Zheng, W., Chen, X. (2021). Fault diagnosis approach for photovoltaic array based on the stacked auto-encoder and clustering with IV curves. Energy Conversion and Management, 245: 114603. https://doi.org/10.1016/j.enconman.2021.114603
[12] Sripada, D., Sugumaran, V., Aghaei, M. (2024). Detection of visual faults in photovoltaic modules using a stacking ensemble approach. Heliyon, 10(6): e27894. https://doi.org/10.1016/j.heliyon.2024.e27894
[13] Amiri, A.F., Oudira, H., Chouder, A., Kichou, S. (2024). Faults detection and diagnosis of PV systems based on machine learning approach using random forest classifier. Energy Conversion and Management, 301: 118076. https://doi.org/10.1016/j.enconman.2024.118076
[14] Marangis, D., Livera, A., Tziolis, G., Makrides, G., Kyprianou, A., Georghiou, G.E. (2024). Trend‐based predictive maintenance and fault detection analytics for photovoltaic power plants. Solar RRL, 8(24): 2400473. https://doi.org/10.1002/solr.202400473
[15] Eskandari, A., Aghaei, M., Milimonfared, J., Nedaei, A. (2023). A weighted ensemble learning-based autonomous fault diagnosis method for photovoltaic systems using genetic algorithm. International Journal of Electrical Power & Energy Systems, 144: 108591. https://doi.org/10.1016/j.ijepes.2022.108591
[16] Thakfan, A., Bin Salamah, Y. (2024). Artificial-intelligence-based detection of defects and faults in photovoltaic systems: A survey. Energies, 17(19): 4807. https://doi.org/10.3390/en17194807
[17] Aghaei, M., Kolahi, M., Nedaei, A., Venkatesh, N.S., Esmailifar, S.M., et al. (2025). Autonomous intelligent monitoring of photovoltaic systems: An in‐depth multidisciplinary review. Progress in Photovoltaics: Research and Applications, 33(3): 381-409. https://doi.org/10.1002/pip.3859
[18] Faris, M., Mahmud, M.N., Salleh, M.F.M., Alnoor, A. (2023). Wireless sensor network security: A recent review based on state-of-the-art works. International Journal of Engineering Business Management, 15: 18479790231157220. https://doi.org/10.1177/18479790231157220
[19] Eldeghady, G.S., Kamal, H.A., Hassan, M.A.M. (2024). Comparative analysis of the performance of supervised learning algorithms for photovoltaic system fault diagnosis. Science and Technology for Energy Transition, 79: 27. https://doi.org/10.2516/stet/2024024
[20] Teta, A., Korich, B., Bakria, D., Hadroug, N., Rabehi, A., et al. (2024). Fault detection and diagnosis of grid-connected photovoltaic systems using energy valley optimizer based lightweight CNN and wavelet transform. Scientific Reports, 14(1): 18907. https://doi.org/10.1038/s41598-024-69890-7
[21] Duffie, J.A., Beckman, W.A., Worek, W.M. (1994). Solar engineering of thermal processes. Journal of Solar Energy Engineering, 116(1): 67-68. https://doi.org/10.1115/1.2930068
[22] Qasem, H., Betts, T.R., Müllejans, H., AlBusairi, H., Gottschalg, R. (2014). Dust‐induced shading on photovoltaic modules. Progress in Photovoltaics: Research and Applications, 22(2): 218-226. https://doi.org/10.1002/pip.2230
[23] Seyedmahmoudian, M., Mekhilef, S., Rahmani, R., Yusof, R., Renani, E.T. (2013). Analytical modeling of partially shaded photovoltaic systems. Energies, 6(1): 128-144. https://doi.org/10.3390/en6010128
[24] Staff, A. (2021). Understanding PV System Losses, Part 1: Nameplate, Mismatch, and LID Losses.
[25] Ahsan, L., Baig, M.J.A., Iqbal, M.T. (2022). Low-cost, open-source, emoncms-based SCADA system for a large grid-connected PV system. Sensors, 22(18): 6733. https://doi.org/10.3390/s22186733
[26] Guo, W., Healy, W.M., Zhou, M. (2012). Impacts of 2.4-GHz ISM band interference on IEEE 802.15. 4 wireless sensor network reliability in buildings. IEEE Transactions on Instrumentation and Measurement, 61(9): 2533-2544. https://doi.org/10.1109/TIM.2012.2188349
[27] Enbar, N., Weng, D., Klise, G.T. (2016). Budgeting for solar PV plant operations & maintenance: Practices and pricing (No. SAND-2016-0649R). Sandia National Lab.(SNL-NM), Albuquerque, NM (United States). https://doi.org/10.2172/1234935
[28] Zigbee Modules - 802.15.4 – Mouser. (2025). https://www.mouser.com/c/embedded-solutions/wireless-rf-modules/zigbee-modules-802154/?srsltid=AfmBOoqs8X14Ty_Cpr16r7JjTpbrTaRBn8JSXxqdGygg7TIR97waiGfE&utm_source=chatgpt.com.
[29] Schill, C., Anderson, A., Baldus-Jeursen, C., Burnham, L., Micheli, L., et al. (2022). IEA-PVPS task 13: Performance, operation and reliability of photovoltaic systems-Soiling Losses-Impact on the Performance of Photovoltaic Power Plants. www.iea-pvps.org.
[30] Betti, F.R.A. (2025). Big data and predictive maintenance in PV – the state of the art. www.pv-tech.org. https://www.pv-tech.org/wp-content/uploads/legacy-publication-pdfs/8adc6eac7d-big-data-and-predictive-maintenance-in-pv-the-state-of-the-art.pdf?utm_source=chatgpt.com.
[31] Lin, J.H., Wu, Y.K. (2025). Simulation and fault diagnosis using current-voltage characteristics of photovoltaic systems—A case study. Engineering Proceedings, 92(1): 79. https://doi.org/10.3390/engproc2025092079
[32] Liu, Y., Wu, Y. (2025). Fault diagnosis of photovoltaic modules: A review. Solar Energy, 293: 113489. https://doi.org/10.1016/j.solener.2025.113489
[33] Zare, A., Simab, M., Nafar, M., Rodrigues, E.M. (2024). A novel method for fault diagnosis in photovoltaic arrays used in distribution power systems. Energy Systems, Springer, pp. 1-35. https://doi.org/10.1007/s12667-024-00706-3
[34] Jalal, M., Khalil, I.U., ul Haq, A. (2024). Deep Learning approaches for visual faults diagnosis of photovoltaic systems: State-of-the-art review. Results in Engineering, 23: 102622. https://doi.org/10.1016/j.rineng.2024.102622
[35] Al-Katheri, A.A., Al-Ammar, E.A., Alotaibi, M.A., Ko, W., Park, S., Choi, H.J. (2022). Application of artificial intelligence in PV fault detection. Sustainability, 14(21): 13815. https://doi.org/10.3390/su142113815
[36] Abdelsattar, M., AbdelMoety, A., Emad-Eldeen, A. (2025). Advanced machine learning techniques for predicting power generation and fault detection in solar photovoltaic systems. Neural Computing and Applications, 37: 8825-8844. https://doi.org/10.1007/s00521-025-11035-6
[37] Et-taleby, A., Chaibi, Y., Ayadi, N., Elkari, B., Benslimane, M., Chalh, Z. (2025). Enhancing fault detection and classification in photovoltaic systems based on a hybrid approach using fuzzy logic algorithm and thermal image processing. Scientific African, 28: e02684. https://doi.org/10.1016/j.sciaf.2025.e02684
[38] Xie, H., Yuan, B., Hu, C., Gao, Y., Wang, F., et al. (2024). ST-YOLO: A defect detection method for photovoltaic modules based on infrared thermal imaging and machine vision technology. PloS One, 19(12): e0310742. https://doi.org/10.1371/journal.pone.0310742
[39] Aljafari, B., Satpathy, P.R., Thanikanti, S.B., Nwulu, N. (2024). Supervised classification and fault detection in grid-connected PV systems using 1D-CNN: Simulation and real-time validation. Energy Reports, 12: 2156-2178. https://doi.org/10.1016/j.egyr.2024.08.008