Taguchi Optimization of Wear Rate for Hypoeutectic Al-Si Alloy Through Al2O3 and SiC Addition

Zeyad D. Kadhim![]() | Mohammed Abdulraoof Abdulrazzaq
| Mohammed Abdulraoof Abdulrazzaq![]() | Mohammed J. Kadhim*
| Mohammed J. Kadhim*![]()
© 2025 The authors. This article is published by IIETA and is licensed under the CC BY 4.0 license (http://creativecommons.org/licenses/by/4.0/).
OPEN ACCESS
Aluminum silicon alloy (Al-9% Si) was fabricated by using a metal mold casting. The alloy was reinforced with two types of ceramic materials, 5% Al2O3 (alumina) and 5% SiC (silicon carbide). A wear test was performed with pin on disc wear device. Three parameters were used; applied load, time, and type of material. The microstructures were examined by using an optical microscope. It was found that the additional ceramic particle materials increased the wear resistance and hardness values. However, the effect of adding SiC particles to the alloy on wear resistance and hardness was higher than the addition of Al2O3 particles to the same alloy. An experimental plan via Taguchi’s technique has been utilized for conducting an L9 orthogonal array. Analysis of variance (ANOVA) has been utilized to find optimal wear rate under the impact’s parameters of applied load, time, and type of material. Wear resistance of dry sliding has been analyzed according to the rule of “smaller the best.” The final study of the impact parameters showed the loading being applied has the maximum impact on the rate of wear resistance compared to time and followed by the type of material.
aluminium silicon alloy, ceramic materials, metal mold casting, stir casting, Taguchi’s technique, orthogonal array, wear rate
Silicon carbide (SiC) and aluminum oxide (Al₂O₃) are hard ceramic materials commonly used as reinforcements in aluminum matrix composites (AMCs) to enhance hardness, strength, and wear resistance. When these particles are uniformly distributed within the aluminum matrix, they contribute to dispersion strengthening. Hard particles embedded in a soft matrix improve high-temperature strength by pinning grain boundaries and restricting dislocation movement.
Among materials, silicon carbide (SiC) ranks just behind diamond and boron nitride in terms of abrasion resistance. It is about 50% harder than tungsten carbide, making it highly suitable for wear-resistant applications, such as in seal faces and pump bearings that operate under high pressure and demanding conditions. Sic is also known for being lightweight and for its outstanding resistance to thermal shock.
Silicon-aluminum alloys are considered among the most important materials in the family of aluminum-based composites. They are suitable for a wide range of standard and high-performance applications. These materials are especially important in both structural components and automotive parts, particularly in items. Such as roof brackets, engine blocks, pistons, powertrain components, battery housings, wheels, door handles, space frames and more. additionally, Al-Si alloy castings used in Aerospace applications due to higher fatigue resistance and corrosion resistance.
Al–Si alloys have gained significant interest for their excellent casting and machining properties [1]. Common casting alloys, Al-Si alloys have improved mechanical properties at various temperatures, a high degree of wear resistance, a low coefficient of thermal expansion, and superior corrosion resistance [2]. The wear has been complex process, where real contact area that is between the two solid surfaces put to comparation with apparent area related to contact has been invariably extremely small, limited to points which are related to contacts between the surface characteristics. Furthermore, loads that are applied to surfaces are going to be subjected to transfer via such points related to contact, and localized forces are extremely large. Furthermore, the materials’ intrinsic surface characteristics, load, surface finish, speed, temperature, and properties related to opposing surfaces are of high importance to determine wear rate [3, 4]. Surface wear and considerable loss from an aluminum-silicon alloy occur when the material is loaded and then exposed to sliding motion [5].
The existence of silicon in the aluminum matrix reduces the wear rate, and the increase in silicon content in the Al-Si alloy results in increased strength and wear resistance at the expense of machinability. Silicon gives sufficient properties to the casting alloy. The casting alloys fundamentally utilize silicon in the form of the cast in significant parts, such as engine blocks, pistons, rocker arms, cylinder liners, brake drums, compressors of the air conditioner, and so on [6].
The silicon exists as uniformly distributed fine particles in the structure. However, when primary silicon is present as coarse polyhedral particles, the hardness will rise as the proportion of silicon particles increases, but the strength characteristics will decrease as the silicon concentration increases [7, 8].
Al-Si alloy mechanical characteristics depend more on the silicon particles’ shape and distribution. Silicon is considered good in metallic alloys due to its properties of increasing the melt fluidity, decreasing the melting temperature and decreasing the shrinkage throughout the solidification. It is quite costly as a raw material [9]. Aluminum–silicon alloys can be classified into hypoeutectic, eutectic and hypereutectic types. This classification depends on silicon content. So, the aluminum–silicon alloys which contain 11–13% Si are called eutectic alloys, while alloys containing less than 11% Si are termed hypoeutectic and alloys with more than 13% Si are called hypereutectic alloys [10, 11].
Adding reinforcement particles such as WC, TiB, Al2O3, or SiC to the aluminum alloy matrix will make an improvement of hardness, strength, and wear characteristics with a little cost [12].
Stir casting is an excellent operation for fabricating aluminum alloy contain a reinforcement phase due to the good adhesion between alloy matrix and reinforcing particle, easy manufacturing, low cost, and high production rates [13].
Moreover, adding reinforcement particles by stir casting will incorporate the ceramic particulate into the Al liquid and permit the solidification of melt casting through vortex mixing for preparing ceramic particles dispersed in the Al matrix [14]. Additive reinforcement particles enhanced the matrix alloy’s characteristics, including its high specific strength, and sufficient wear resistance compared with unreinforced types of alloys [15].
Vencl et al. [16] studied the tribological and mechanical properties of treated with heat aluminum alloy A356. Also, the microstructure has been examined. The composites of this alloy contain ceramic particles (Al2O3, SiC) and graphite particles. Particulate composites consist of A356 aluminum alloy as a matrix and alumina, graphite and SiC particles. The compo casting procedure was used to create these composites. Both the composites and the matrix alloy subjected the T6 thermal treatment procedure. The microstructure of the matrix of the composite was found to be impacted by heat treatment.
It was found that the wear resistance and coefficient of friction of composite were better when using silicon carbide particulate than alumina particulate, while adding graphite particles enhanced tribological characteristics further.
The strength of aluminum matrix composite increases with the addition of Al2O3, B4C and SiC particles. these additives improved the wear resistance and increased the ratio of weight to strength [17].
Aluminum alloy (Al-8% Si) was reinforced with different percentage of alumina (Al2O3) by using stir casting at 750℃. The microstructure of the fabricated metal matrix composites has been examined, and hardness values and wear rate for the composite specimens have been reported. The results showed that, with the increment in the addition of alumina, the hardness value of composites increases while the wear rate value decreases [18].
The tribological performance of Al-7.5% SiCp metal matrix composite has been studied and Optimization of tribological testing parameters by using the Taguchi method coupled with grey relation analysis. The best parameter impacting the tribological behavior is found to be $T$ (time), with a 99% confidence level. Other significant parameters with a 95% confidence level include $L$ (applied load) and $S$ (slide speed) [19].
Stojanovic et al. [20] used Taguchi design to investigate the tribological properties of aluminum composites based on A356. Composite materials were fabricated by compocasting. The tribological behavior for Aluminum alloy (A356) and Aluminum composite with 10% SiC have been studied for three different sliding speeds and loads. ANOVA analysis explained that the wear rate for composite material with load 10 N and sliding speed 0.25 m/s is the least.
In this research work, Al-9%Si alloy has been fabricated. This alloy was reinforced by the addition of two types of ceramic particles with the same percentage of addition. The wear rate and hardness have been calculated for the alloy and metal matrix composites. Besides that, Taguchi’s technique was used to determine the optimal level of control parameters affecting the wear performance. This research deals with the following parameters (applied load, time and type of materials) Most pervious researches deals with the effect of Si content of Al-Si alloy on wear rate or composites with different percentage of the same particles ceramics and its effect on mechanical properties like hardness, wear characteristics, etc.) without using Taguchi method or maybe with this technique. The objective of this study is to use the Taguchi method to identify the most influential factor in achieving the optimal wear rate of hypoeutectic aluminum-silicon alloys through the addition of alumina (Al₂O₃) and silicon carbide (SiC) particles.
The novelty of this research consisted of the following:
1- A hypoeutectic (Al-9%Si) alloy has been used.
2- Two types of ceramics materials with the same percentage have been used.
3- Using Taguchi method with these conditions.
2.1 Alloy samples preparation
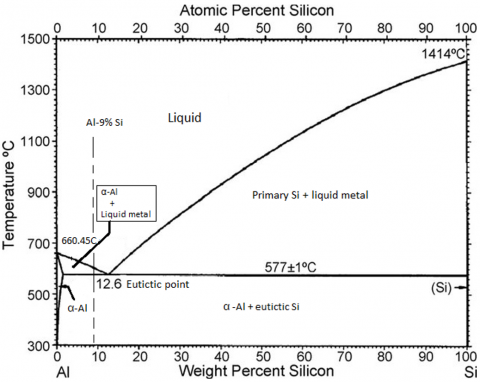
The hypoeutectic aluminium-9%silicon alloy sample was prepared using a metal mold with a chemical structure listed in Table 1. Figure 1 shows Al-Si binary phase diagram and the position of the alloy within the system. The sample preparation processes were performed using a crucible made of clay and graphite to melt the aluminum wires. The crucible was heated in a gas furnace. Then, iron and copper were added to the molten aluminum and thoroughly combined.
Table 1. Chemical composition of prepared Al-9%Si alloy (wt.%)
|
Elements |
Fe |
Si |
Mn |
Cu |
Cr |
Mg |
|
% |
0.400 |
9 |
0.0491 |
3.72 |
0.0422 |
0.561 |
|
Elements |
Ni |
Zn |
Ti |
Pb |
Al |
|
|
% |
0.064 |
0.0631 |
0.041 |
0.007 |
Bal |
|
Figure 1. Al-Si binary phase diagram [21]
The pure silicon (purity of 98.5%) was added to the molten aluminum until it was completely dissolved. Magnesium (Mg) was added to the molten metal and mixed. Then the hydrogen degassing was done by injecting argon gas through a 304 stainless steel tube inside the overheated melt to get bubbling because the Al-alloys severely tend to adsorb the hydrogen gas.
The flow rate was (2.5 L/min) with the existence of flux for five minutes. After a period, slag remover aqueous aluminium chloride is added into molten aluminium at a concentration of 1 g/%. After quite a brief time of mixing, the slag will be removed. Then the molten mix was poured into the pre-heated steel mold at 300℃ to avoid fast solidification, which is why the pours will not be formed. This process obtained a casting rod with a 15 mm diameter and 200 mm length. The casting rod was left inside the electrical furnace at 500℃ to cool in the furnace air for homogeneous grain.
A hypoeutectic modified (Al-9%Si) alloy, which was obtained from the above casting operation, was used substrate matrix. In an electric furnace, this alloy was melted at 680℃, and a measured amount of Al2O3 powder at a concentration of 5% with 25 µm grain size was heated at 300℃ for 25 min. Then, I added it to the melt. That was used as the reinforcement. Knowing that alumina powder was wrapped in aluminium foil, the melt was stirred for some time at different speeds creating a vortex to dispersion of alumina particles in the molten. Also, the hydrogen degassing was done by injecting argon gas through a 304 stainless steel tube inside the melt. The melt was poured into a carbon steel mold after being monitored and controlled by a K-type thermocouple covered with Hastelloy.
The dimensions of the rods of the resulting castings are 200mm in length with a diameter of 15 mm. The same stages of casting were carried out, and SiC particles with a 13 µm grain size were added at a concentration of 5%. However, through the microstructure observation, The Al matrix contains a uniform distribution of ceramic particles.
2.2 Wearing test
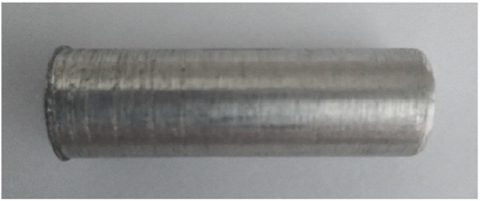
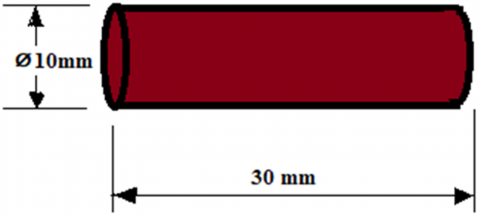
A pin-on-a-disc instrument has traditionally been used to evaluate Wear rate. The samples were cut into pieces with a length of 30 mm and a diameter of 10 mm, as shown in Figure 2. A surface roughness Tester (TR200) was used to measure the surface roughness of the sample.
Figure 2. Wear specimen
The surface roughness average Ra of the materials was 3 ± 0.05 µm. Three loads of 5, 10, and 15 N have been used with a rotating disc of 490 r.p.m at 5,10, and 15 min. The disc of AISI 1045 steel with hardness Hv = 312 kg/mm² and Ra is equal to 0.15±0.05 µm. Each test sample was removed after each interval and cleaned in solvents and weighed to determine the mass loss by using a sensitive digital sensor scale (0.0001 g).
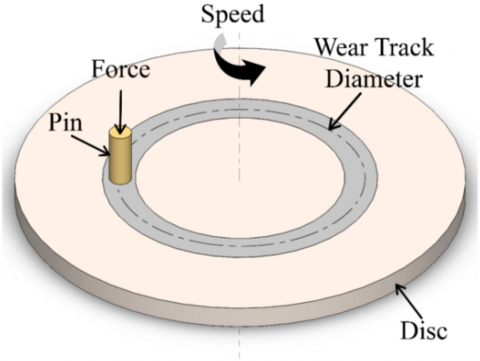
Initial cleaning with distilled water and mild detergent, the solvent cleaning using acetone, and if needed, the oxide removal using diluted nitric acid. Finally, rinse with distilled water and dry with air. The tests were carried out according to the G-99 standard. Figure 3 shows the Schematic illustration of wear test.
Figure 3. Schematic illustration of wear test
The following relation was employed to determine the specimens’ wear rates:
Wear rate $(\mathrm{w} \cdot \mathrm{r})=\Delta \mathrm{W} / \mathrm{DNT} \rho$ (1)
where, ΔW= W₀ – W₁
ΔW: mass loss after each test
W₀: primary weight for the specimen (g)
W₁: final weight for specimen after wear test (g)
N= speed of steel disc, rpm
T= time of sliding, min
D: circle diameter, 14 cm
$\rho$: density of pin material
2.3 Hardness test
Vickers hardness values were measured by using 412A/413A INNOVA TEST Micro hardness device. The Vickers hardness values have been evaluated by using a 1 kg weight for 15 seconds.
2.4 Microstructure examinations
For metallographic examination, the samples' surfaces were ground with 200, 400, 600, and 1000 SiC emery papers. Sample polishing was carried out by using alumina slurry (grain size of 50 µm) and diamond paste (grain size of 1 µm). At last, cleaning was done with water and alcohol for the polished samples and then dried.
Samples etching was carried out by using Keller solution (1 ml HF+1.5 ml HCl+2.5 ml HNO3+95% water), covered with the solution for 15 seconds. Samples were then examined and photographed at a magnification of X200 by using an optical microscope from Meiji Techno Co., Ltd., Japan.
2.5 Taguchi’s technique
Analysis of variance (ANOVA), a statistical tool used to analyze the data, is used in the Taguchi method. A standardized form of the design of experiments (DOE), the Taguchi methodology uses a methodical approach to experiment design and analysis in order to improve the quality characteristic.
By employing a minimal number of experiments, the Taguchi approach aims to enhance comprehension of the individual and combined effects of various design variables.
The present variation is ascertained by the Taguchi method using the signal-to-noise (S/N) ratio. Based on the type of qualities, there are a number of S/N ratios that can be used, such as "lower is better" (LB), "nominal is best" (NB), and "higher is better" (HB) [22].
Orthogonal array techniques have been followed throughout the studies. The total of the wear variables has been utilized as a criterion for choosing the orthogonal array. Therefore, the array’s degrees of freedom must be more than or equal to that value.
Table 2. Control factors and levels
|
Factors |
Control Factor |
Level 1 |
Level 2 |
Level 3 |
|
A |
Load (N) |
5 |
10 |
15 |
|
B |
Time (sec) |
5 |
10 |
15 |
|
C |
Type of material |
1 alloy without additive |
2 alloy with additive Al2O3 |
3 alloy with additive SiC |
The wearing variables, which have been selected for Taguchi’s technique work, were (A) the applied load, (B) the time, and (C) the additive material type (Type 1 alloy without additive, Type 2 alloy with additive Al2O3, and Type 3 alloy with additive SiC) (Table 2). The experiment includes nine tests. The parameter values have been assigned to each row and column of the L9 orthogonal array. The applied load is listed in the first column, time in seconds, and alloy type in the third column.
Degree Of Freedom (DOF)= no. of levels -1 (2)
Thus, each factor has (DOF) equal to: 2.
A three-level L9 3⁴ orthogonal array with nine experimental runs was used for this investigation (Table 3).
The total degree of freedom is determined as follows [23]:
Total DOF $=$ Number of experiments -1 (3)
where, Total DOF = 9 – 1 = 8.
All tests were conducted on a per-orthogonal-array basis, using row-level settings for every array element. The SNR (signal-to-noise ratio or S/N) is a quantitative representation of experimental findings. After getting the results, it shows the wear rate, with smaller being the best. The S/N ratio use in order to give results of wear rate "the smaller the better" characteristic has been used, and the relation for measuring S/N ratio of Taguchi characteristic is given by [23-25]:
$(S / N)=-10 \times \log 1 / n\left(\Sigma Y i^2\right)$ (4)
where, n is the number of repetitions in each trial, yi is the outcome of the i-th experiment for each trial, and S/N is the signal-to-noise ratio. The S/N analysis determines the S/N ratio for each level of influencing parameters.
Statistical analysis of a factor (parameters) is employed to determine the statistical significance of its parameters. So, it can be predicted that the optimal combination of parameters.
Table 3. L9 orthogonal array
|
Experiment No. |
Load (N) |
Time (sec) |
Type of Material |
|
1 |
5 |
5 |
1 |
|
2 |
5 |
10 |
2 |
|
3 |
5 |
15 |
3 |
|
4 |
10 |
5 |
2 |
|
5 |
10 |
10 |
3 |
|
6 |
10 |
15 |
1 |
|
7 |
15 |
5 |
3 |
|
8 |
15 |
10 |
1 |
|
9 |
15 |
15 |
2 |
3.1 Addition of Al2O3 and SiC particles on hypeoeutectic Al-9%Si alloy micro-structure
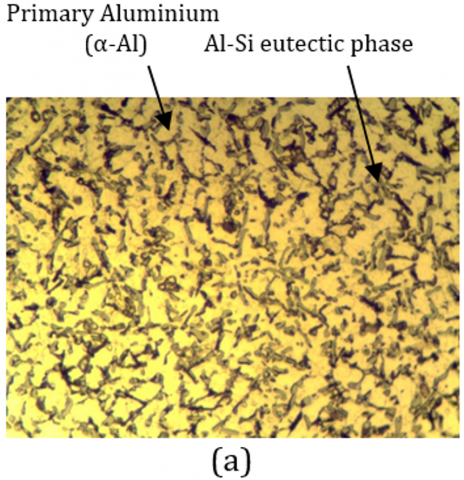
Figure 4 remarks the hypoeutectic aluminum- 9% silicon alloy microstructure before and after adding Al2O3 and SiC particles. However, it shows the microstructure of this alloy at room temperature. The microstructure contains a fine (α-Al) phase grains besides to a coarser eutectic morphology because of the higher concentration for Si in this material. furthermore, primary α-Al phase in this alloy was precipitated from liquid in the Liquid + α-Al two-phase field at about 600℃ during cooling. While, the α-Al + Si eutectic structure forms below 577℃ from solidification of the remaining liquid as shown in Figure 1. So, cooling path of Al–9% Si alloy can be shown as below:
Liquid $\rightarrow$ Liquid $+\alpha-\mathrm{Al} \rightarrow \alpha-\mathrm{Al}+$ Eutectic Si
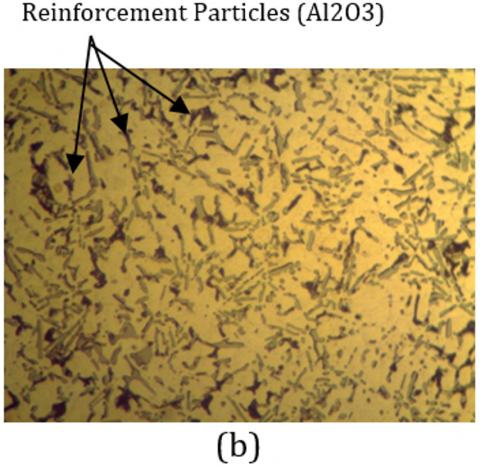
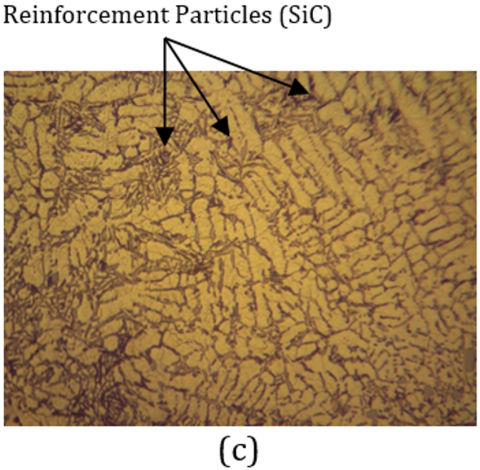
Figure 4(a) shows the aluminum-silicon micro-structure consisting of alpha aluminum and Si eutectic rod after adding Al2O3 and SiC. The results of the experiment, depicted in Figures 4(b) and 4(c), reveal that the microstructure is getting more homogeneous and refined.
It was noted that the addition of SiC and Al2O3 particles to the alloy resulted in a refinement of grain size because the ceramic particles increased the nucleation rate and provided a certain number of nucleation sites, which facilitated grain refinement and inhibited the growth of Al grains, producing fine recrystallized grains.
The grain size that is obtained after the solidification process is known to be determined by the conflict between nucleation and growth rates. (i) Ceramic particles can reduce the activation energy required for Al nucleation, which is one of the reasons for the alloy's grain refinement. (ii) Grain refinement at the solid-liquid interface relies on achieving equilibrium between latent heat extraction and production. Solute partitioning at the solid/liquid interface and diffusion in the molten pool restrict the rate of latent heat generation.
The metalloids C and Si would lower the liquidus temperature, making the supercooled liquid more stable. The technique produced fine grains due to its rapid solidification at a high cooling speed. (iii) The micro-sized ceramic particles that were maintained in the matrix's molten pool, however, also promoted heterogeneous nucleation during the solidification process by acting as a core for further refined grains.
(iv) Grain growth may be slowed by the second phase's dispersion.
In Al-alloys, smaller ceramic particles generally lead to improved mechanical properties. The overall performance of the composite is greatly influenced by the size and distribution of these particles. Smaller particles, especially when well-distributed, act as obstacles to dislocation movement within the aluminum matrix, leading to higher strength and hardness. Also, fine particles can enhance the alloy's resistance to wear by acting as a barrier against abrasive wear mechanisms.
The casting defects, such as gas and shrinkage porosities, were not remarked during the microscopic analysis.
Figure 4. Hypoeutectic Al- 9% Si alloy microstructure before and after adding Al2O3 and SiC particles a) Microstructure of Al- 9% Si alloy, (b) Microstructure of Al- 9% Si alloy with addition of 5% Al2O3 particles (metal matrix composite); c) Microstructure of Al- 9% Si alloy with addition of 5% SiC particles (metal matrix composite).
3.2 XRD analysis
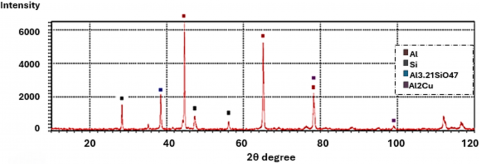
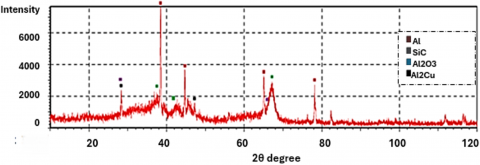
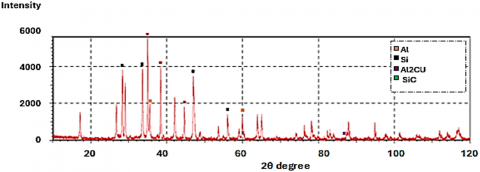
It had been observed from the X-RD that the major peaks were aluminum and silicon. In contrast, the minor peaks were for Al2Cu and Al3.21 Si0.47 after adding Al2O3 and SiC to the alloy, as shown in Figure 5. Tables 4-6 show intensities of the exist phases and diffraction angles of Al-Si alloys before and after adding Al2O3 and SiC.
Figure 5. X-RD analysis of Al-Si alloy before and after adding Al2O3 and SiC a) Al-9% Si, b) after addition Al2O3, c) after addition SiC
Table 4. Diffraction angle and intensities (I) of Al-Si alloys before additive
|
Alloy |
Phase |
2Theta |
I/I1 |
|
Al9%Si |
Al |
44.66,65.12,78.23 |
100,91,40,3 |
|
Al-9%Si |
Si |
28.45,47.32,56.13 |
22,11,7 |
|
Al-9%Si |
Al3.21 Si0.47 |
38.47 |
30 |
|
Al-9%Si |
Al2Cu |
78.21,98.97 |
40,3 |
Table 5. Diffraction angle and intensities (I) of Al-Si alloys after adding Al2O3
|
Alloy |
Phase |
2Theta |
I/I1 |
|
Al9%Si |
Al |
38.45,65.06,44.68,78.18 |
100,45,44,36 |
|
Al-9%Si |
Si |
28.35,47.47 |
22,4 |
|
Al-9%Si |
Al2Cu |
28.35,66.24 |
22,9 |
|
Al-9%Si |
Al2O3 |
67.02,42.20,37.62 |
22,7,8 |
Table 6. Diffraction angle and intensities (I) of Al-Si alloys after adding SiC
|
Alloy |
Phase |
2Theta |
I/I1 |
|
Al9%Si |
Al |
35.01,38.42,44.67 |
100,77,34 |
|
Al-9%Si |
Si |
33.66,28.36,47.46,56.07 |
70,64,10,31 |
|
Al-9%Si |
Al2Cu |
87.39 |
5 |
|
Al-9%Si |
SiC |
35.54,60.33 |
32,6 |
3.3 Result of hardness for Al-9%Si alloy and composites
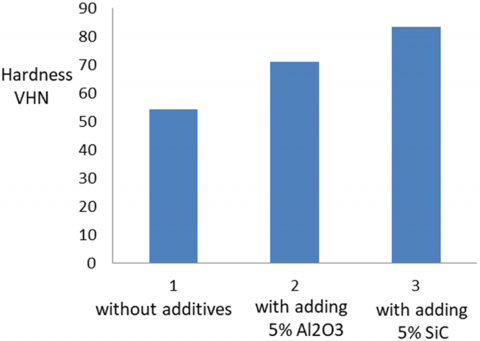
The addition of Al2O3 and SiC to the Al-9%Si alloy enhanced its hardness, as demonstrated in Table 7. The hardness of the alloy reinforced with 5% alumina was recorded at 71.2 HV, representing an increase of 31.1% compared to the unreinforced alloy. In contrast, the alloy reinforced with 5% silicon carbide exhibited a hardness of 83.5 HV, which corresponds to a 53.7% increase in hardness relative to the unreinforced alloy. With their very high hardness, these particles will serve as barriers against alloy distortion. It’s worth noting that the particles will operate as barriers for dislocation migration and that the stronger silicon carbide particles have a stronger impact on improving hardness than their softer alumina counterparts.
Furthermore, the microstructure contains fine dislocations which are randomly distributed immediately adjacent to the reinforcing SiC and Al2O3 particles.
It can be seen from hardness values (Table 7 and Figure 6) that alloys with SiC additive is harder than alloys with Al2O3 particles. The high increament of hardness values for the resulting composite is due to the homogeneous dispersal of silicon carbide particles in the matrix alloy.
Table 7. Vickers hardness number for materials before and after adding Al2O3 and SiC
|
Alloy Al-9%Si |
Without Additives |
With Adding 5% Al2O3 |
With Adding 5% SiC |
|
Vickers hardness No. |
54.3 |
71.2 |
83.5 |
Figure 6. Variation of hardness values with type of materials
The initial hardening behaviour can be attributed to the mechanisms listed below:
(1) Stress transfer occurs between the hard, brittle carbide particle (SiC) reinforcing phase and the plastically deforming metal matrix of an aluminum alloy.
(2) High dislocation density is due to the presence of reinforcement particles.
(3) The inclusion of ceramic particles within the matrix of the plastically deforming aluminum alloy results in hardening given restricted plastic flow and triaxiality. Nevertheless, a back stress (σb) develops. due to the elastically deforming particles' resistance to the alloy matrix's plastic flow.
(4) Because the soft matrix and hard particles in the composite have different thermal expansion coefficients (CTE), residual stresses are produced in the matrix and plastic strains arise close to the particles.
So hardening or strengthening, results from all these mechanisms:
(1) Increment in the dislocation density that are pre-exists in the microstructure of the composite.
(2) Dislocations multiply during cyclic plastic stress.
(3) Dislocations' reciprocal interactions.
(4) An interaction of the mobile dislocations with the reinforcing particulates (SiC) coupled with an initial interaction of the dislocations with other second-phase constituents in the microstructure.
3.4 Results of wear test
The obtained experimental result values have been computed and analyzed using the commercial software MINITAB 17. The designed experiment and the statistical analysis of wear rate values and the computed SNR using Eq. (3) in the specific response have been given in Table 8.
Table 8. Orthogonal array (L9) of Taguchi for the wear test
|
Exp. No |
Load (N) |
Time (sec) |
Alloy |
Wear Rate * 10-8 (cmᵌ/cm) |
Predicted Wear Rate |
SN |
|
1 |
5 |
5 |
1 |
2.32 |
2.29556 |
-7.30976 |
|
2 |
5 |
10 |
2 |
2.27 |
2.27889 |
-7.12052 |
|
3 |
5 |
15 |
3 |
2.44 |
2.45556 |
-7.74780 |
|
4 |
10 |
5 |
2 |
2.41 |
2.42556 |
-7.64034 |
|
5 |
10 |
10 |
3 |
2.45 |
2.42556 |
-7.78332 |
|
6 |
10 |
15 |
1 |
2.93 |
2.93889 |
-9.33735 |
|
7 |
15 |
5 |
3 |
2.50 |
2.50889 |
-7.95880 |
|
8 |
15 |
10 |
1 |
2.83 |
2.84556 |
-9.03573 |
|
9 |
15 |
15 |
2 |
3.03 |
3.00556 |
-9.62885 |
3.5 Effect of load, time, and alloy type on the wear rate
Wear characteristics of hypoeutectic Al-9% Si alloys without any additives and with adding 5% Al2O3 and 5% SiC particles, have been studied using a pin-on-disc type wear testing apparatus at room temperature. The influence of applied load, sliding time and material type on wear rate have been investigated. It has been found that wear rate is strongly dependent on, applied load and sliding time.
It can be seen from Table 8 that the effect of load, time and type of material (alloy and composites) on wear rate values.
The load considerably impacts the wear rate. Wear waste was obtained in fine particles at low load values, and a protective oxide layer formed, reducing the contacting area between the samples and the disc. This is because severe wear only happens at very high loads. Hence, the wear rate drops dramatically at low load values. In such a load, when wear waste is found as large metal particles, the oxide layer will break out, thereby increasing the wear rate as the contact area between burrs increases. Therefore, burrs would emerge and detach from the surface.
Load directly influences the plastic deformation occurring in the burr tips and the area near the surface. Therefore, the dislocation movement will increase, and the plastic deformation will increase with the load increase. Dislocations will accumulate, and the formation of little holes will occur. Therefore, thin metal layers are eliminated in the direction of the slip, forming the wear waste. In the case of increasing loads, the silicon particles would detach, and the broken silicon would spheroids due to the high temperature between the two slipping surfaces. Since wear resistance is associated with hardness, adding SiC and Al2O3 will decrease the wear rate as the added material’s hardness increases.
3.6 Results of the statistical analysis of the experiments
By reducing the experimental time and expense for the optimization of the design parameters, the Taguchi technique offers a simple, methodical, and controlled approach in contrast to traditional designs [26]. Two essential instruments are used in the Taguchi experimental plan: (i) the signal to noise ratio (S/N). (ii) Orthogonal array.
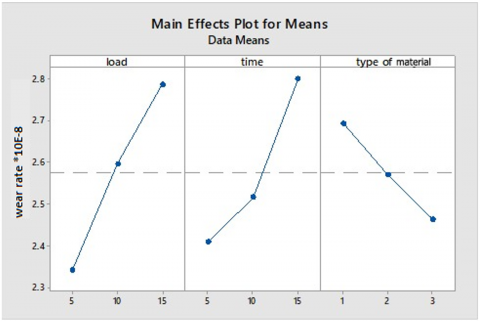
Figure 7. Main effects plot for wear rate
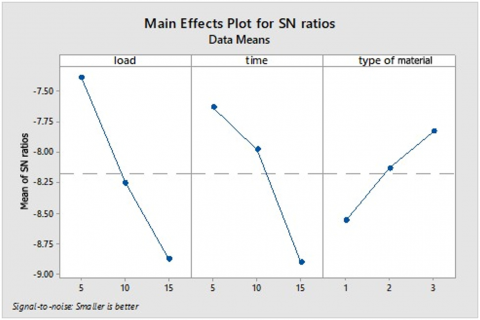
Figure 8. Main effects plot for S/N ratios
The results of the research study and the computed values have been obtained according to the experiment plan and analyzed using MINITAB 17 commercial software. The software designs the experiment plan and the statistical analysis of the experimental data. The impacts of the controlled parameters used in this study on the wear rate have been graphically illustrated in Figures 7 and 8. The optimal conditions resulting in the lowest wear rate have also been presented using the SNR analysis. These graphs clearly show that the first load level and the third time level are optimal alloy-type points (A1B1C3).
The Taguchi method succeeded in predicting the optimum parameters for reaching the best properties.
3.7 Wear rate variance analysis
This analysis is helpful for the detection of comparative contributions of the final parameter in the response of the wear rate. Tables 9 and 10 show the variance analysis, P-value, and F-values. Individual parameter efficiency was also listed based on the characteristics response of the arithmetic values of SNR and mean wear rate.
Table 9. Variance analysis for the mean
|
Source |
DF |
Seq SS |
Adj SS |
Adj MS |
F |
P |
|
A |
2 |
00.296822 |
00.296822 |
00.148411 |
107.72 |
00.009 |
|
B |
2 |
00.243756 |
00.243756 |
00.121878 |
88.46 |
00.011 |
|
C |
2 |
00.079489 |
00.079489 |
00.039744 |
28.85 |
00.034 |
|
Residual Error |
2 |
00.002756 |
00.002756 |
00.001378 |
|
|
|
Total |
8 |
00.622822 |
|
|
|
|
Table 10. Analysis of variance for SN ratios
|
Source |
Seq SS |
DF |
Adj SS |
Adj MS |
P |
F |
|
A |
3.32231 |
2 |
3.32231 |
1.66115 |
0.006 |
164.22 |
|
B |
2.58206 |
2 |
2.58206 |
1.29103 |
0.008 |
127.63 |
|
C |
0.8100 |
2 |
0.81008 |
0.4050 |
0.024 |
40.04 |
|
Residual Error |
0.02023 |
2 |
0.02023 |
0.01012 |
|
|
|
Total |
6.73468 |
8 |
|
|
|
|
The p-value in Table 9 shows the efficiency of each parameter in influencing the related response characteristics in a particular range. ANOVA results explained that selected process variables are highly significant variables influencing wear behavior of the composite. Table 9 and Table 10 show that A is the most significant parameter of the minimal wear rate, and B represents the next-most important parameter for the minimal wear rate.
3.8 Multiple linear regression models
17 MINITAB Multiple linear regression formula has been created with the help of a statistical program. By fitting a linear equation to observed data, the resulting model elucidates the nature of the connection between the predictor / independent parameter and the responsive parameter. The wear rate regression equation is:
Rate of wear *10E-8 = 2.353 + 0.05367 load - 0.04167 time - 0.2117 type of material - 0.001267 load*load + 0.003400 time*time + 0.02500 type of material*type of material + 0.001333 load*time + 0.001333 load*type of material (5)
3.9 Confirmation experiments
Verification tests have been carried out to detect the values of the optical parameters from experimental analyses, as listed in Tables 11 and 12. The regression equations and the comparison findings’ values were calculated and examined experimentally to create the mathematical model.
Using experimental data, an ANOVA has been performed to determine the statistically relevant process factors.
The aim of ANOVA is to determine the effect of particular parameters on the output response factor. ANOVA results in Table 9 showed the effect of each parameter on wear rate. The F-test has been performed to indicate which process factors have a highly significant impact on wear behavior. Larger F-value remarks that changing the process factor makes a significant change in the wear behavior characteristics. The F- values in Table 9 indicated that for minimum wear rate, applied load is the most significant factor with 107.72 followed by time with 88.46, and type of alloy with 28.85. The applied load has a bigger impact on wear rate of the hypoeutectic Al-9%Si alloy. It might indicate in Figure 8 that the optimal parameter combinations related to minimum wear rate at applied load 5N, time 5 min, and type of material (3).
Table 11. Response table for mean
|
Level |
Load |
Time |
Material |
|
1 |
2.343 |
2.410 |
2.693 |
|
2 |
2.597 |
2.517 |
2.570 |
|
3 |
2.787 |
2.800 |
2.463 |
| Delta | 0.443 | 0.390 | 0.230 |
| Rank | 1 | 2 | 3 |
Table 12. Response for SNRS (smaller is better)
|
Level |
Load |
Time |
Material |
|
1 |
-7.393 |
-7.636 |
-8.561 |
|
2 |
-8.254 |
-7.980 |
-8.130 |
|
3 |
-8.874 |
-8.905 |
-7.830 |
| Delta | 1.482 | 1.268 | 0.731 |
| Rank | 1 | 2 | 3 |
The mean of the S/N ratio is explained in Tables 13 and 14, and the control parameters are graded at each level according to the delta value. It is obvious from this table that rank one is given to the factor with highest delta value and rank two is given to the main factor with second highest value of delta and so on. Thus, in this instance, the imposed load is assigned rank one since it has the biggest delta value. While rank two is given to the factor sliding time, and rank three is given to the factor type of material. From the delta-based rank analysis it can be seen that applied load is the most significant factor for wear performance of material The main effects plot for S/N ratio for wear rate is shown in Figure 8.
Table 13. Experimental results of the wear rate verification
|
Level |
Load |
Time |
Material |
|
1 |
5 |
10 |
1 |
|
2 |
5 |
5 |
2 |
|
3 |
10 |
15 |
3 |
Table 14. Verification data and its regression model comparisons
|
Experiment No. |
Wear Rate * 10-8 (cmᵌ/cm) |
Regression Model Eq. (3) Wear Rate* 10-8 |
%Error |
|
1 |
2.50 |
2.39 |
4.4 |
|
2 |
2.13 |
2.18 |
2.3 |
|
3 |
2.78 |
2.73 |
1.7 |
The increase in hardness resulting from the addition of alumina and silicon carbide to aluminum-silicon alloys has a significant positive impact on both industrial and research applications. In industrial applications, the benefits can be summarized as follows:
1. Enhanced Wear and Friction Resistance:
These reinforced alloys are ideal for components exposed to continuous friction. Examples include brake linings, cylinders, and bearings, where improved hardness extends service life and reduces manufacturing costs.
2. Greater Load-Bearing Capacity:
Higher hardness allows the material to better withstand mechanical forces and stresses, making it suitable for structural components in the aerospace industry.
3. Improved Thermal Stability:
The addition of alumina and silicon carbide enhances the alloy's resistance to high temperatures, making it well-suited for applications requiring thermal endurance, such as engine components.
4. Lightweight Design without Compromising Strength:
Alloys reinforced with these ceramic particles are widely used in industries that prioritize weight reduction, such as aerospace and automotive sectors, while maintaining structural integrity and durability.
In research, these alloys serve as ideal models for studying the effects of ceramic particle reinforcement on the mechanical and thermal properties of materials. Additionally, they provide a foundation for the development of new advanced materials with enhanced performance characteristics.
In this investigation, wear tests were performed for the hypoeutectic Al-9%SiC alloy and the composite materials which consist of Al-9%Si alloy with addition of alumina and silicon carbide particles at the same percentage. A metal mold casting process has been used to create the aluminium-9% silicon alloy. Which it was reinforced by the additives using stir casting technique. The percentage of reinforcement particles was 5% alumina and 5% silicon carbide. Wear test performed under different levels of applied load, sliding time and type of material using Taguchi optimization approach. The analysis of variance was also carried out to know the most significant factor which affects the wear performance of materials (alloy and composites). The experimental research reached to the following conclusions. (i) Success of Taguchi optimization approach method in examined the Wear performances of materials (alloy and composites) by using software MINITAB 17. It has been determined the optimal level of control parameters and the significant control parameters affecting the wear performance by this approach. (ii) It was found that the applied load is the most significant factor affecting the wear rate with (F) value 107.72 followed by time with 88.46 and type of material with 28.85. (iii) Microstructure examination showed a regular and homogeneous dispersion of alumina and silicon carbide reinforcement particles into the matrix alloy. (v) Increment in Vickers’s hardness values, it was recorded the hardness of reinforcement alloy with 5% Al2O3 addition became 71.2 Hv, that means the increment of hardness was by 31.1% as compared to the unreinforced alloy. while the hardness for 5% SiC addition matrix composite was 83.5 HV and the increment of hardness was by 53.7% as compared with Al-9%Si alloy.
Wear resistance is related to hardness. Introducing Al2O3 and SiC decreases the wear rate due to the hardness of the added materials and the correlation between wear resistance and the surface hardness of the alloys and materials. Experiments have been done to check the results. Comparing the results with the calculated values shows that the composite’s dry sliding wear is off by between 4.4% and 1.7%.
This work is supported by Mustansiriyah University (www.uomustansiriyah.edu.iq), College of Engineering, Department of Materials Engineering, Baghdad- Iraq.
[1] Alidokht, S.A., Abdollah-Zadeh, A., Soleymani, S., Saeid, T., Assadi, H. (2012). Evaluation of microstructure and wear behavior of friction stir processed cast aluminum alloy. Materials Characterization, 63: 90-97. https://doi.org/10.1016/j.matchar.2011.11.007
[2] Rajaram, G., Kumaran, S., Rao, T.S. (2010). High temperature tensile and wear behaviour of aluminum silicon alloy. Materials Science and Engineering: A, 528(1): 247-253. https://doi.org/10.1016/j.msea.2010.09.020
[3] Rao, R.V., Raju, N.V.S. (2013). Determination of wear characteristics of Aluminum based silicon carbide refractory bricks reinforced with red mud extracts for torpedo type of ladle refractory lining. International Journal of Engineering Science Invention, 2(5): 42-48.
[4] Abdulla, F.A., Hamid, K.L., Ogaili, A.A.F., Abdulrazzaq, M.A. (2020). Experimental study of wear rate behavior for composite materials under hygrothermal effect. IOP Conference Series: Materials Science and Engineering, 928(2): 022009. https://doi.org/10.1088/1757-899X/928/2/022009
[5] Dodiya, V.K., Parmar, J.P. (2016). A study of various wear mechanism and its reduction method. IJIRST–International Journal for Innovative Research in Science & Technology, 2: 242-248.
[6] Rao, P.V., Devib, A.S., Kumar, K.G. (2012). Influence of melt treatments on dry sliding wear behavior of hypereutectic Al-15Si-4Cu cast alloys. Jordan Journal of Mechanical & Industrial Engineering, 6(1): 55-61.
[7] Ozioko, F.U. (2012). Synthesis and study on effect of parameters on dry sliding wear characteristics of Al-Si alloys. Leonardo Electronic Journal of Practices and Technologies, 11(20): 39-48.
[8] Çetin, M. (2019). Abrasive wear behaviour of cast Al–Si–Mn alloys. Proceedings of the Institution of Mechanical Engineers, Part E: Journal of Process Mechanical Engineering, 233(4): 908-918. https://doi.org/10.1177/0954408918818735
[9] Kang, N., Coddet, P., Liao, H., Baur, T., Coddet, C. (2016). Wear behavior and microstructure of hypereutectic Al-Si alloys prepared by selective laser melting. Applied Surface Science, 378: 142-149. https://doi.org/10.1016/j.apsusc.2016.03.221
[10] Bogdanoff, T., Seifeddine, S., Dahle, A.K. (2016). The effect of Si content on microstructure and mechanical properties of Al-Si alloy. La Metallurgia Italiana, 108(6): 65-69.
[11] Hatch J.E. (1984). Aluminum properties and physical metallurgy. American Society for Metals, Metal Park, Ohio, p. 2. https://www.scirp.org/reference/referencespapers?referenceid=31157.
[12] Majhi, J., Sahoo, S.K., Patnaik, S.C., Sarangi, B., Sachan, N.K. (2018). Effect of alumina on grain refinement of Al-Si hypereutectic alloys. IOP Conference Series: Materials Science and Engineering, 338(1): 012048. https://doi.org/10.1088/1757-899X/338/1/012048
[13] Ray, S. (1993). Synthesis of cast metal matrix particulate composites. Journal of Materials Science, 28(20): 5397-5413. https://doi.org/10.1007/BF00367809
[14] Jayashree, P.K., Shankar, M.G., Kini, A., Sharma, S.S., Shetty, R. (2013). Review on effect of silicon carbide (SiC) on stir cast aluminium metal matrix composites. International Journal of Current Engineering and Technology, 3(3): 1061-1071.
[15] Poovazhagan, L., Kalaichelvan, K., Rajadurai, A., Senthilvelan, V. (2013). Characterization of hybrid silicon carbide and boron carbide nanoparticles-reinforced aluminum alloy composites. Procedia Engineering, 64: 681-689. https://doi.org/10.1016/j.proeng.2013.09.143
[16] Vencl, A., Bobic, I., Arostegui, S., Bobic, B., Marinković, A., Babić, M. (2010). Structural, mechanical and tribological properties of A356 aluminium alloy reinforced with Al2O3, SiC and SiC+ graphite particles. Journal of Alloys and Compounds, 506(2): 631-639. https://doi.org/10.1016/j.jallcom.2010.07.028
[17] Raja, R., Jannet, S., Reji, S., Paul, C.G. (2020). Analysis of mechanical and wear properties of Al2O3+ SiC+ B4C/AA5083 hybrid metal matrix composite done by stir casting route. Materials Today: Proceedings, 26: 1626-1630. https://doi.org/10.1016/j.matpr.2020.02.340
[18] Wasly, H.S. (2016). Synthesis and characterization of Al-Si alloy composites reinforced with Al2O3 particles by stir casting. International Research Journal of Engineering and Technology (IRJET), 3(11): 1350-1355.
[19] Ghosh, S., Sahoo, P., Sutradhar, G. (2013). Tribological performance optimization of Al-7.5% SiCp composites using the Taguchi method and grey relational analysis. Journal of Composites, 2013(1): 274527. https://doi.org/10.1155/2013/274527
[20] Stojanovic, B., Tomović, R., Gajević, S., Petrović, J., Miladinović, S. (2022). Tribological behavior of aluminum composites using Taguchi design and ANN. Advanced Engineering Letters, 1(1): 28-34. https://doi.org/10.46793/adeletters.2022.1.1.5
[21] Okamoto, H., Massalski, T.B. (1990). Binary alloy phase diagrams. In ASM Handbook. International, Materials Park, OH, USA, 12: 3528-3531. https://doi.org/10.31399/asm.hb.v03.a0006247
[22] Shailesh, P., Sundarrajan, S., Komaraiah, M. (2014). Optimization of process parameters of Al-Si alloy by centrifugal casting technique using Taguchi design of experiments. Procedia Materials Science, 6: 812-820. https://doi.org/10.1016/j.mspro.2014.07.098
[23] Taguchi, G., Konishi, S. (1987). Taguchi methods: orthogonal arrays and linear graphs; tools for quality engineering. Dearborn, MI: American Supplier Institute, pp. 35-38.
[24] Ranjit, R.K. (2010). A Primer on the Taguchi Method. Society of Manufacturing Engineers.
[25] Taguchi, G. (1993). Taguchi on Robust Technology Development: Bringing Quality Engineering Upstream. ASME Press, New York. https://doi.org/10.1115/1.800288
[26] Montgomery, D.C. (2001). Design and Analysis of Experiments. John Wiley & Sons, New York.