Mohanad Hilal Alruyshid*![]() | Omar Farouq Lutfy
| Omar Farouq Lutfy![]() | Dalal Abdulmohsin Hammood
| Dalal Abdulmohsin Hammood![]()
© 2025 The authors. This article is published by IIETA and is licensed under the CC BY 4.0 license (http://creativecommons.org/licenses/by/4.0/).
OPEN ACCESS
The increasing desire for people to own personal cars, combined with their reluctance to use public transportation, has led to traffic jams and delays in emergency vehicle arrivals. Traffic lights in densely populated cities pose a significant challenge because they rely on fixed or variable timings, yet are not particularly effective. As a result, they can worsen congestion or cause traffic jams instead of alleviating it. For example, a city like Baghdad faces severe traffic congestion, requiring intervention from traffic police. Additionally, there is no specific system in place for emergency vehicle passage, and public transportation remains ineffective, as people are hesitant to use buses due to longer congestion times and the difficulty in navigating, which is exacerbated by their larger size compared to private small cars. Unlike previous YOLO-based systems, our system integrates emergency vehicle and public transport buses prioritization. It adjusts timing based on vehicle type, number, and estimated speed, showing a 31.11% improvement in flow efficiency and reducing queue delays by 21.64% compared to fixed-time signal systems. The improved algorithm can recognize all four vehicle classes (fire trucks, ambulances, public transport buses, and cars) with an accuracy of 85-99%, depending on vehicle density and complex lighting conditions.
control systems, automation, deep learning, computer vision, YOLO, traffic congestion, emergency vehicle prioritization
The intelligent transportation system represents one of the modern tools for organising and improving traffic by relying on advanced technology and artificial intelligence [1]. In this regard, traffic congestion is one of the most troubling issues for residents due to its direct impact on people's lives, daily routines, and community quality of life [2], including travel delays and increased criminal and traffic accidents [3]. It also affects human mental and physical health by increasing carbon dioxide emissions [4-6]. In this context, one of the primary causes of traffic congestion in Baghdad is the use of ineffective traffic signal control methods, leading to longer waiting periods. Moreover, weaknesses in the road network, its age, and the substantial rise in personal vehicle ownership have caused the roads to fail in accommodating this growing number of cars. Additionally, public reluctance to use buses significantly contributes to traffic congestion [7, 8]. This challenge compels traffic officers to intervene on the streets to manually alleviate jams. In this regard, current traffic signal control systems do not account for emergencies, such as ambulances or fire trucks, and therefore, the congestion control methods currently in use result in substantial human and financial losses [9, 10]. In particular, the current traffic signal control methods in Baghdad rely on fixed or variable timings, as well as wireless sensor-based techniques. However, in a city like Baghdad, frequent and sudden congestion at nearly all intersections causes traffic delays. Accordingly, this issue underscores the need for a system that can identify different congestion levels. These systems also do not adjust signal timings in real time, leading to inefficiencies in reducing waiting periods and causing delays. Moreover, during rush hours, nearly all intersection streets suffer from congestion, emphasising the need for a system capable of differentiating between various congestion levels. The conventional approach of traffic police to alleviate congestion is similar to the method proposed in this system, with some necessary enhancements. There are two traffic police officers at each of the four roads at each intersection: one positioned at the beginning of the intersection to assess vehicle count, and another at the end of the congestion to measure its length and prevent it from spreading to the next intersection.
The proposed model in this paper will detect variations in congestion levels during peak times by assessing vehicle counts, speeds, and congestion lengths across all intersection streets using YOLOv10.
Specifically, the YOLOs aim to improve the speed and accuracy of real-time detection by accurately predicting object classes and locations, thanks to their effective balance between computational cost and detection performance. This technology is essential for many practical applications, including autonomous driving, automated navigation, object tracking, and traffic signal control [11, 12]. Based on this data, the system dynamically adjusts green and red signal durations in real time.
This study addresses the following research questions:
(1) Can real-time vehicle classification using YOLOv10 improve the responsiveness of traffic signals, particularly to emergency vehicles such as ambulances and firetrucks?
(2) What performance improvements—in terms of vehicle throughput and queue delay—can be achieved by deploying the proposed system in real-world traffic environments such as Baghdad?
The paper is organised as follows: Section 2 reviews relevant recent works. Section 3 presents the proposed model. Section 4 discusses the results, and lastly, Section 5 concludes with future research directions.
Early approaches to adaptive traffic signal control used fuzzy logic combined with Wireless Sensor Networks (WSNs) to adjust signal timings at four-way intersections [13] automatically. These systems utilised WSNs to collect traffic data, including congestion density and lane-specific waiting times, which served as inputs for a fuzzy logic controller. This enabled an intelligent algorithm to allocate green light phases to lanes with the highest priority, thereby optimising traffic flow and reducing delays [14].
In another method, traffic signals with variable timings driven by deep learning were used to predict congestion using techniques such as LSTM and RNN, then adjusting green light durations based on these predictions [15].
Other studies implemented an adaptive traffic light system based on a neural network trained through reinforcement learning [16], with sensors installed on roads to detect passing vehicles. This system calculated queue lengths and delay times, using this data along with the current traffic signal stage as inputs to determine the optimal timing for signal adjustments [17]. Reinforcement learning has also been employed for traffic light control, where key elements include state, action, and reward. A CNN-based deep Q-network (DQN) processes traffic state information to derive state and action values. A consensus algorithm updates these across distributed agents via a decentralised topology, enabling agents to learn from neighbours’ experiences without sharing raw data [18].
Moreno-Malo et al. [19] examined the challenge of managing traffic efficiently in increasingly complex urban environments. They proposed an agent-based traffic light control system where each intersection has an agent that dynamically manages the light phases based on real-time traffic conditions. These agents, trained with DQN, make effective decisions. The simulation results using SUMO demonstrated that this approach reduces wait times and improves transit times compared to fixed-timing methods. Azad-Manjiri et al. [20] noted that urban traffic control is a complex multi-agent problem where traditional methods often fall short. Reinforcement learning, especially when integrated with deep learning and multi-agent strategies like MADDPG, shows promise in addressing these issues through autonomous, data-driven decision-making. Recent advances also incorporate Graph Attention Networks (GATs) to understand complex intersection relationships better.
In addition, recent studies utilised live CCTV footage to calculate traffic density in real-time using YOLO by detecting the number of cars at signals and adjusting green light durations accordingly to improve accuracy [21]. Alternatively, an imaginary line was used to count passing vehicles with YOLO, and green light timings were adjusted based on this count at each intersection [22]. Additionally, YOLO was used to track cars through intersections until they exit, measure exit times, and compare these durations across roads so that the controller can make informed decisions [23]. Moreover, Karoon et al. [24] developed a vision-based adaptive traffic light system to address urban congestion caused by poor traffic management. They used intersection videos and compared two vehicle detection methods: background subtraction using Mixture of Gaussians and YOLOv3. In practice, YOLOv3 proved more accurate, leading to its adoption in conjunction with the DeepSORT algorithm for vehicle tracking and counting.
The proposed model relies on computer vision using YOLO and addresses the following problems:
(1) Traffic jams: The issue on Baghdad's streets during rush hour is that nearly all roads become congested, with congestion levels varying from street to street. Our model can distinguish different congestion densities by analysing vehicle counts and speeds.
(2) Real-time response: The model can adjust signal timings in real time based on YOLOv10 outputs and simple equations.
(3) Emergency vehicles: For the first time, our model can detect emergency vehicles (ambulances or fire trucks) and adjust green signals accordingly to facilitate their passage.
(4) Public transport buses: The model can promote public transport use by detecting buses. If buses are present, it increases the green signal duration to reduce traffic congestion.
3.1 Training
Before implementing the model, a new dataset was created for the proposed model due to the lack of a valid dataset to implement the research problem. The proposed model needs a dataset consisting of four car categories: cars, ambulances, fire trucks, and public transport buses.
Most of the images were collected from the streets of Baghdad city, and most of the cars’ photos were chosen from the front because the system requires the recognition of objects from the front.
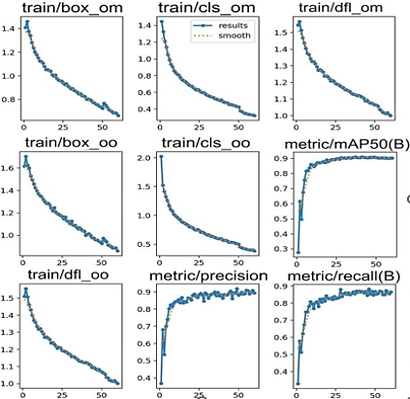
The model was trained using YOLOv10x with a dataset of approximately 9,000 images labelled using Roboflow. The selected epochs were 100, and the images’ size was 640. A custom dataset was used in this study, consisting of four main vehicle categories: ambulance (1,814), bus (1,802), car (4,079), and firetruck (1,282). The dataset was split into training, validation, and test sets with a ratio of 70%, 20%, and 10%, respectively, following standard deep learning practices. All annotations were conducted by a single expert annotator with domain knowledge to ensure consistency. The results were excellent and very encouraging, as can be observed in Figure 1, in which the plots show that the training progresses well, with steady improvements in both the loss metrics (declining) and the performance metrics (increasing). The decreasing loss values suggest that the model is learning effectively, while the improvements in metrics like Recall, MAP, and Precision indicate better object detection performance. The figure contains multiple plots showing the model's performance during training based on various metrics. A detailed explanation of each plot is given below:
(1) Train/box_om: Progressive improvement in bounding box coordinate prediction accuracy.
(2) Train/cls_om: Decreasing classification loss, indicating better object recognition.
(3) Train/dfl_om: Steady enhancement in location prediction through distribution focal loss.
(4) Metrics/recall(B): Increasing recall, showing improved true object detection capability.
(5) Train/cls_oo: Rapid early-stage classification improvement (alternative method).
(6) Train/box_oo: Consistent bounding box accuracy improvement (alternative calculation).
(7) Train/dfl_oo: Continuous distribution focal loss reduction, showing training progress.
(8) Metrics/mAP50(B): Rising mAP@50 score, demonstrating better detection precision.
(9) Metrics/precision(B): Improved positive predictive value, reducing false positives.
Figure 1. Training and evaluation metrics for object detection models
Although the dataset used in this study comprises approximately 9,000 images, the high quality and diversity of the data, combined with the use of transfer learning from the pretrained YOLOv10 weights, allowed for effective model fine-tuning. To this end, prior works [25, 26] demonstrated that deep learning models can perform well even with smaller datasets, provided that the data is representative and well-annotated.
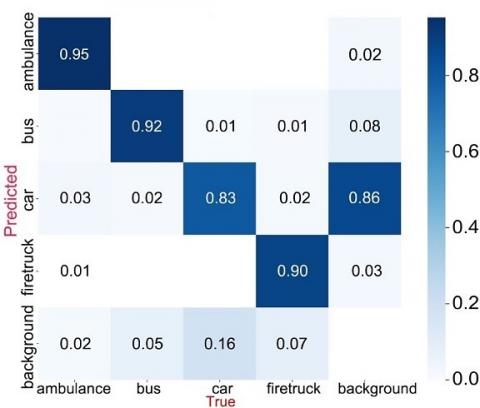
Figure 2 shows that the model demonstrates strong overall performance, particularly in classifying emergency vehicles and buses. However, there is room for improvement in distinguishing regular cars and handling different backgrounds. The results indicate the model's potential for practical applications while considering its current limitations and working on improving them.
Figure 2. Image of the normalized confusion matrix of the trained model
This analysis offers valuable insights for future model iterations and identifies specific areas where targeted improvements could yield substantial performance gains. The model's strong performance in emergency vehicle recognition suggests particular promise for applications in traffic safety and emergency response systems. More precisely, the model achieved remarkable success in classifying ambulances, with a recognition accuracy of 95%, making it the most successfully classified category. This was followed by fire trucks at 90% and buses at 92%. This outstanding performance in classifying emergency vehicles and buses indicates the model's ability to recognise cars with distinct features. However, despite the excellent performance in some categories, the model faced challenges in classifying regular cars, with a detection accuracy of 83%. There were also difficulties in distinguishing between vehicles and background, with 16% of cars being misclassified as background. This issue indicates that the model needs improvement in distinguishing regular cars from the background.
3.2 Implementation
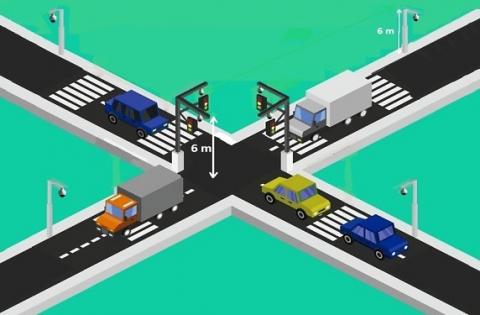
To implement the system, eight cameras are required, with two assigned to each lane. The first camera in each lane counts the number of vehicles, while the second camera calculates their speed and detects emergency vehicles or public transport buses. The model assumes that the counted vehicles pass in a straight lane and exit the intersection.
The first camera is positioned at the beginning of the intersection, ideally at a height of 6 meters to ensure accurate detection of vehicles, which aligns with these recommendations [27]. A second camera is installed at a standardized distance from the first camera on each street to ensure complete traffic queue coverage. For consistent cross-street comparison, all secondary cameras maintain uniform spacing from their primary counterparts, enabling systematic and objective measurement of queue lengths and traffic congestion levels. Thus, the second camera aids in assessing congestion density. If the speed is zero or close to zero, this indicates that congestion extends further, and vice versa, as shown in Figure 3.
Figure 3. The external appearance of the system
When the system is started, it does the following:
(1) The first camera positioned at the start of each of the four streets of the intersection captures a single frame of the street to count the number of vehicles. The more cars there are, the longer the green signal time will be, and vice versa.
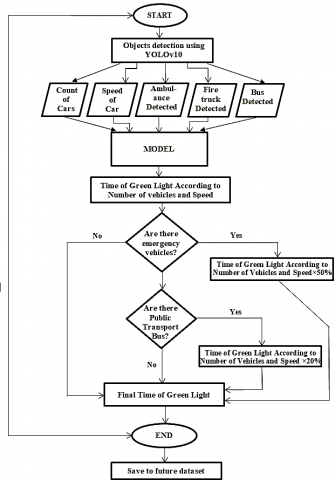
(2) Simultaneously, the second camera is activated, and the system draws an imaginary line to calculate the speed of the first vehicle crossing the line to decrease the processing time and to display the results in real time. Additionally, using the second camera, the model detects whether there are emergency vehicles (such as fire trucks or ambulances) or public transport buses. If there is an emergency vehicle, the green signal duration is increased by 50%, and it will be increased by 20% when there are public transport buses, as shown in the proposed developed algorithm in Figure 4.
Figure 4. The proposed developed algorithm
The proposed model detects the number of cars and whether there are emergency vehicles or buses using the trained model, and then estimates vehicle speed using the following simple mathematical Eq. (1):
$v=\frac{d p * M p}{\Delta t}$ (1)
where, v is vehicle speed in meters per second (m/s). dp is pixel displacement between two frames. Mp is meter-per-pixel ratio (e.g., 4.5 / 100). Δt is time interval between frames (seconds). Eq. (2) is used to convert to kilometers per hour (km/h):
$v_{K m / h}=v \times 3.6$ (2)
The speed adjustment factor to account for vehicle velocity in traffic signal timing is calculated using Eq. (3):
Speed Factor $=\max \left(0.5, \min \left(1.5, \frac{1}{v / 60}\right)\right)$ (3)
where, v is vehicle speed in km/h.
The factor is bounded within [0.5,1.5] to avoid extreme timing changes. The max and min functions are used to ensure that the speed value stays within the range [0.5,1.5]. If the speed detected is high, the speed will be less than 1, which reduces the green signal time. On the other hand, if the speed is low, the speed will be greater than 1, which increases the green signal time.
The green light time is dynamically adjusted using traffic and vehicle data, using Eq. (4):
$T_{\text {green }}=T_{\text {base }} \times C_f \times S_f \times E_f$ (4)
where, Tgreen is final green light time (seconds). Tbase is base green time (30 seconds). Cf is congestion factor (0.8 for <10 vehicles, 1.0 for 10-14, 1.2 for ≥15). Sf is speed factor. Ef is emergency factor (1.5 if ambulance/firetruck, 1.2 if bus, 1.0 otherwise).
For cycle time normalization, if the total green light durations exceed the fixed cycle time, Eq. (5) is used.
$T_i^{\prime}=\left(\frac{T_i}{\sum_{j=1}^n T_j}\right) * T_{\text {cycle }}$ (5)
where, Ti is initial green light time for street I. Tcycle is total cycle time (e.g., 120 seconds). $T_i^{\prime}$ is normalized green light time for street i. ΣTj is the sum of all initial green light times.
The red light duration is calculated using Eq. (6):
$T_{\text {red }}=T_{\text {cycle }}-T_{\text {green }}$ (6)
The model showed very encouraging results due to its simplicity. According to the proposed algorithm, the model was evaluated in two ways:
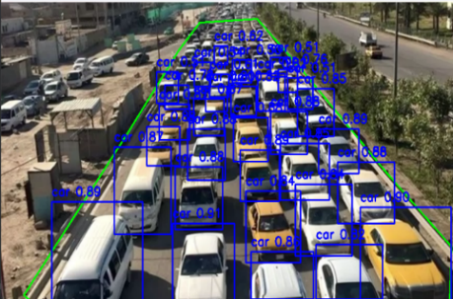
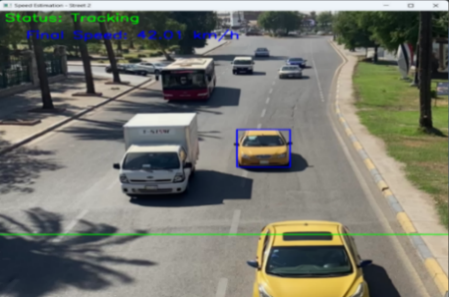
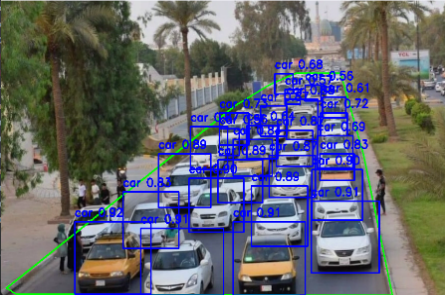
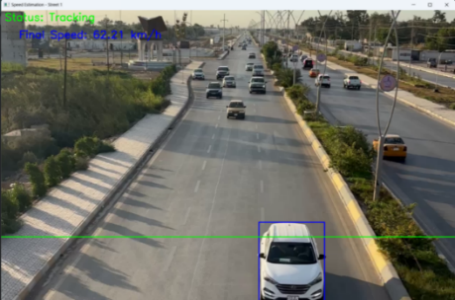
(1) By analyzing eight real videos taken from Baghdad intersections. Four of these videos were recorded for the first camera to count the number of cars. In contrast, the other four videos were recorded for the second camera to assess the speed of cars and detect emergency vehicles and buses. The videos featuring emergency vehicles and public transport buses were specifically chosen to observe how the model responded to them. The model adjusts the green light time in real-time by calculating the number of vehicles, determining the speed of the first vehicle passing through the imaginary line, detecting the presence of emergency vehicles and buses (where it detected a bus on the first street and an ambulance on the third street), and then calculating the green light timing at high speed.
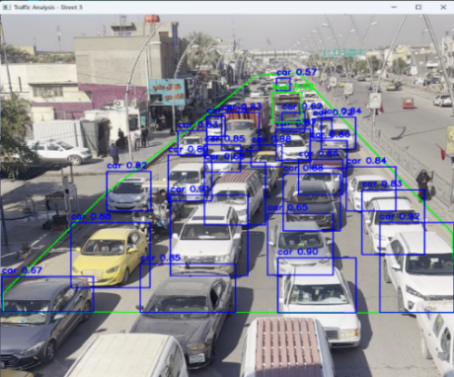
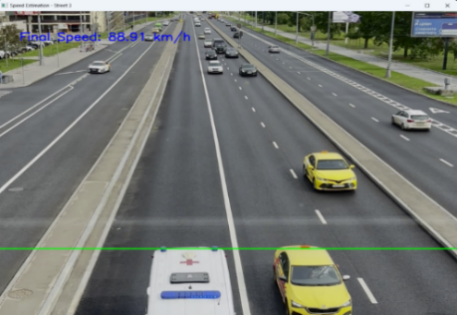
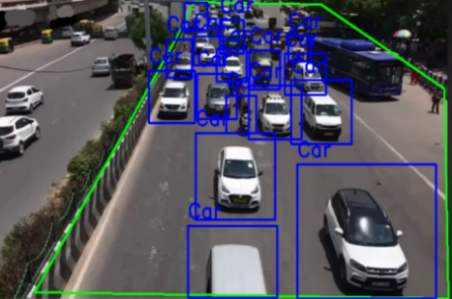
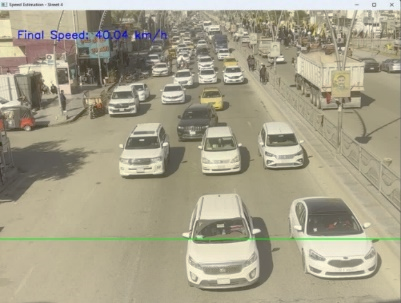
Firstly, the model displays the detected vehicles through the front camera videos and presents the calculated speeds through the second camera videos, as shown in Figure 5.
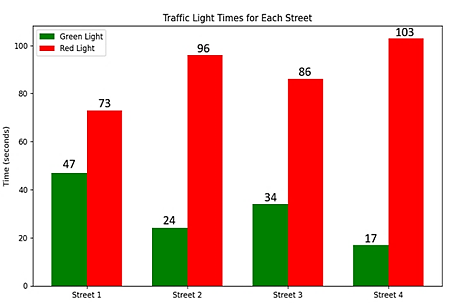
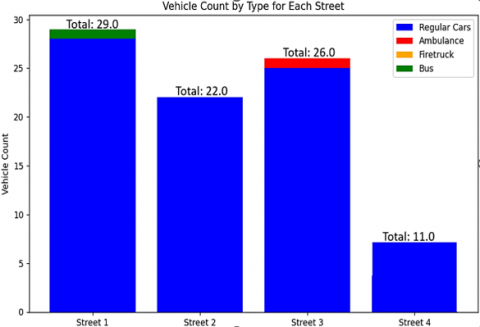
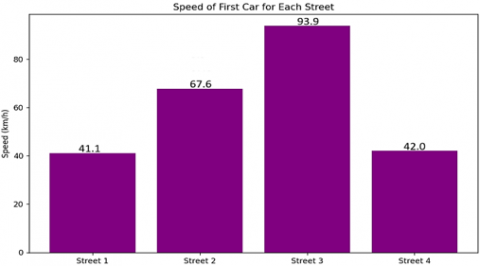
Secondly, the model calculates the number of vehicles and their speeds and detects emergency vehicles and public transport buses. Specifically, the model displays the results in three graphs, as shown in Figure 6.
(a)
(b)
(c)
(d)
(e)
(f)
(g)
(h)
Figure 5. (a) The vehicles detected on the first street; (b) The speed of the first car passing through the imaginary line drawn for the first street; (c) The vehicles detected on the second street; (d) The speed of the first car passing through the imaginary line drawn for the second street; (e) The vehicles detected on the third street; (f) The speed of the first car passing through the imaginary line drawn for the third street; (g) The vehicles detected on the fourth street; and (h) The speed of the first car passing through the imaginary line drawn for the fourth street
(a)
(b)
(c)
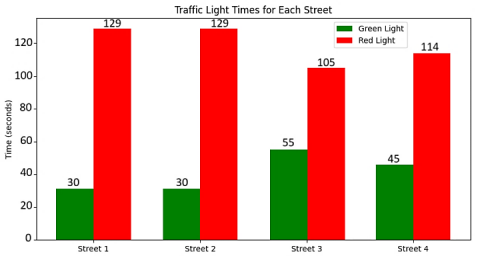
Figure 6. (a) The green and red light times for each street based on the number of cars, speed, emergency vehicles, and public transport buses; (b) The count and type of vehicles for each street; and (c) The speed of the first car passing through the imaginary line drawn for each street
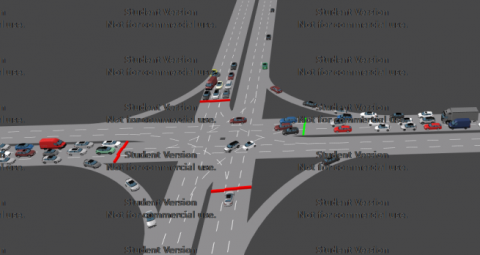
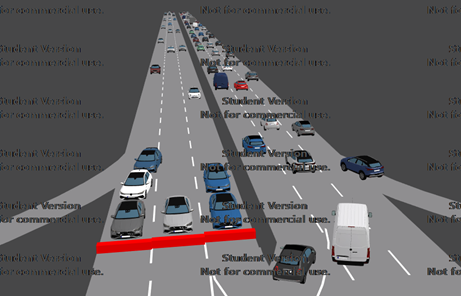
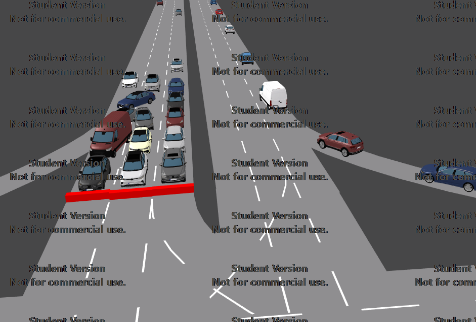
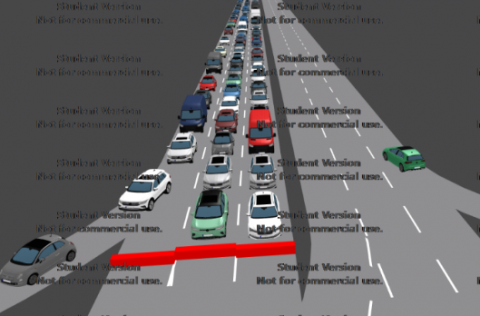
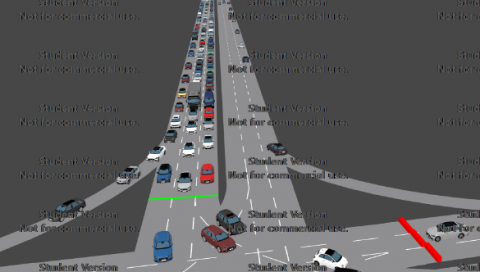
(2) By simulating using PTV VISSIM, which is an urban traffic simulation software developed by the PTV GROUP, a German company, we analysed the performance of traffic networks. We evaluate the impact of changes in traffic control systems. In particular, a four-street intersection was designed with varying traffic densities, without emergency vehicles and public transport buses, as shown in Figure 7.
Figure 7. Four-street intersection with varying traffic density
The traffic lights were set to a fixed duration of 40 seconds for each street. The VISSIM counted the number of vehicles passing through the intersection and the average queue delay (congestion time). This fixed-time system allowed for 410 vehicles to pass through per hour. We captured videos of the same intersection streets to count the number and speed of vehicles on each street, and this data was entered into our system to calculate green light timings, as depicted in Figure 8. The green light timings were then adjusted in VISSIM according to those calculated by our system, where the green light times calculated by our system, based on the number of cars and their speed, are as follows: 30 seconds, 30 seconds, 55 seconds, and 45 seconds, as shown in Figure 9. Our model allows 625 vehicles to pass through the intersection, an average of 215 more vehicles than the system with fixed times.
(a)
(b)
(c)
(d)
Figure 8. (a) The first street with low traffic density; (b) The first street with medium traffic density; (c) The third street with high traffic density; and (d) The first street with high traffic density
Eight simulation trials were conducted to assess the performance of the proposed intelligent traffic signal control system in comparison to the traditional fixed-time signal system. Each trial was designed with varying traffic load distributions across four streets to ensure an equitable and representative evaluation of system behavior under different traffic conditions. Particularly, the evaluation focused on three key performance indicators: the total number of passing vehicles, queue delay time, and green/red light durations.
Figure 9. Time of green and red signals generated by our system in the first trial
The proposed intelligent control system demonstrated a clear improvement in traffic throughput. More specifically, a greater number of vehicles were able to pass through the intersections during the eight trials compared to the fixed-time system, indicating more efficient traffic management and dynamic signal responsiveness. In addition, a paired sample t-test was conducted using the vehicle counts from both systems across all trials, and the resulting p-value was less than 0.05, confirming the statistical significance of the observed improvement, as shown in Table 1.
The intelligent system significantly reduced queue delay times across all eight trials. By adapting the green light duration based on real-time vehicle density and road conditions, the system minimized vehicle waiting times and improved traffic flow consistency.
The statistical analysis using a paired t-test for queue delay values across all trials yielded p-values below 0.05, indicating that the reductions are statistically significant. The reduction in delay times is further illustrated in Table 2.
The proposed system dynamically adjusted green and red signal durations in response to real-time traffic demands, optimizing flow distribution across all intersection approaches. In contrast to the fixed-time system's rigid, uniform phases, the intelligent control system adapts signal timing continuously. Quantitative results demonstrating this adaptive behavior across all experimental trials are presented in Table 3.
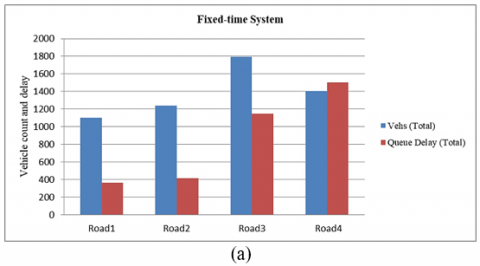
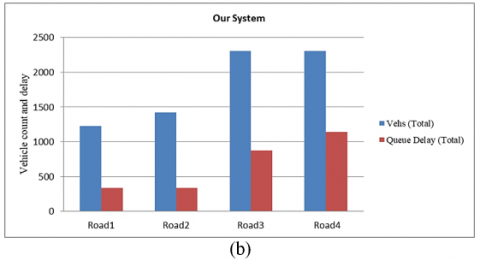
Consequently, the vehicle flow rate through the intersection increased by 31.11%, as demonstrated in Eq. (7) and Figure 10(a).
$ Vehicle \, Flow \, Rate =\frac{7261-5538}{5538} * 100 \%=31.11 \%$ (7)
Table 1. Comparison between our developed system and the fixed-time system in terms of total vehicle flow
|
Roads |
Fixed-time System - Total Vehicles (8 Trials, Varied Load) |
Our System – Total Vehicles (8 Trials, Varied Load) |
P-Value |
Rate of Increase |
|
Road1 |
1101 |
1228 |
0.00065 |
31.11% |
|
Road2 |
1238 |
1422 |
||
|
Road3 |
1794 |
2316 |
||
|
Road4 |
1405 |
2305 |
Table 2. Comparison between our developed system and the fixed-time system in terms of the total queue delay
|
Roads |
Total Delay in Fixed-Time System (s) |
Total Delay in Our System (s) |
P-Value |
Rate of Decrease |
|
Road1 |
362.940542 |
336.365218 |
0.00035 |
-21.64% |
|
Road2 |
416.938497 |
336.774633 |
||
|
Road3 |
1,144.821047 |
871.207351 |
||
|
Road4 |
1,502.558414 |
1,141.1529 |
Table 3. The green signal durations for all four street approaches during each trial
|
Trial/Time |
Green Signal/Str1 (s) |
Green Signal/Str2 (s) |
Green Signal/Str3 (s) |
Green Signal/Str4 (s) |
|
Trial 1 |
30 |
30 |
55 |
45 |
|
Trial 2 |
29 |
29 |
52 |
50 |
|
Trial 3 |
28 |
32 |
50 |
50 |
|
Trial 4 |
28 |
28 |
44 |
60 |
|
Trial 5 |
54 |
28 |
28 |
50 |
|
Trial 6 |
30 |
30 |
70 |
30 |
|
Trial 7 |
30 |
30 |
32 |
68 |
|
Trial 8 |
30 |
70 |
30 |
30 |
While our system achieves a 31.11% increase in vehicle throughput and a 21.64% reduction in queue delay, it is not without limitations. Evaluation using the normalized confusion matrix showed that emergency vehicle detection performed well, with a true positive rate of 96% for ambulances and 90% for firetrucks. However, occasional misdetections still occurred, particularly in cases of occlusion or overlapping vehicles in densely packed urban scenes. Furthermore, in intersections with complex geometries or under low-light conditions, the model’s confidence scores tended to decrease.
The queue delay decreased by 21.64%, as demonstrated in Eq. (8) and Figure 10(b).
$Queue \, Delay=\frac{2,685.5-3,427.25}{3,427.25} * 100 \%=-26.64 \%$ (8)
In this regard, false detection of ambulances may lead to unnecessary green phases, which has been addressed using a class confidence threshold of at least 0.75, based on empirical tuning. Accordingly, a constraint was introduced requiring emergency vehicles and buses to appear in at least 4 out of 5 consecutive frames to be confirmed as valid objects. Moreover, the detection of emergency vehicles and buses was delegated to the second camera, which is typically positioned in a less congested area than the first camera, increasing the likelihood of successful identification.
To demonstrate the superiority of the proposed system, a comparison with other systems using different techniques is presented in Table 4.
In response to identified limitations and to strengthen the system's practical applicability, we have added a comprehensive Table 5 outlining known failure modes, such as camera occlusion, performance degradation under low-light conditions, and class confusion in mixed traffic environments. Mitigation strategies are proposed for each challenge. Table 6 shows the system components that require maintenance, and Table 7 shows the estimated cost of the proposed system.
Figure 10. (a) The total vehicle count (blue) and the total queue delay (red) for the fixed-time control system; (b) The total vehicle count (blue) and the total queue delay (red) for our developed system
Table 4. Comparing our system with modern systems used in traffic signal control
|
Name of Research |
Vehice Flow Rate |
Queue Delay |
Emergency Vehicle Detection |
Buses Detection |
|
Our paper |
31.11% |
21.6% |
Yes |
Yes |
|
A deep learning-based model for traffic signal control using the YOLO algorithm [28] |
+27% |
50% |
No |
No |
|
Intelligent transportation system for traffic congestion based on Dempster–Shafer evidence theory and fuzzy logic control [29] |
- |
11.6% & 24.1% |
No |
No |
|
A deep reinforcement learning network for traffic light cycle control [30] |
- |
20% |
No |
No |
|
Deep Q learning with LSTM for traffic light control [31] |
- |
23% |
No |
No |
Table 5. Documented failure modes and corresponding mitigation strategies
|
Failure Mode |
Description |
Proposed Mitigation Strategy |
|
Night-time Degradation |
Reduced detection accuracy due to low light |
Use infrared-capable cameras; apply low-light image enhancement techniques |
|
Class Confusion |
Misclassification among similar vehicle types |
Improve dataset diversity; apply ensemble classification (1) Temporal filtering (4/5 consecutive-frame consensus), (2) A secondary camera in low-congestion lanes, and (3) A strict confidence threshold (≥0.75) to reduce false positives and prevent unnecessary signal changes. |
|
Weather Conditions |
Rain or dust obscures the camera view |
Install weatherproof cameras with self-cleaning covers; fusion with radar |
|
Single Intersection Training |
Model trained on limited geometry |
Augment training data from multiple intersections with varied layouts |
Table 6. Components requiring scheduled maintenance
|
Component |
Maintenance Frequency |
Maintenance Activities |
Purpose |
|
CCTV Cameras |
Monthly |
Lens cleaning, angle adjustment, firmware update |
Ensure clear visibility and optimal detection accuracy |
|
Edge AI Processing Unit |
Quarterly |
System diagnostics, software updates, cooling system check |
Maintain real-time processing performance and prevent overheating |
|
YOLOv10 Model Deployment |
Bi-annually |
Model retraining if accuracy drops, re-validation on updated datasets |
Sustain high detection/classification accuracy in changing traffic patterns |
|
Traffic Light Controller Interface |
Annually |
Hardware inspection, communication test with ai unit |
Guarantee reliable signal switching and synchronization |
|
Network Infrastructure (Router/Switch) |
Quarterly |
Latency testing, firmware update, port checks |
Ensure stable data transmission between components |
|
Weatherproof Enclosures |
Bi-annually |
Seal inspection, waterproofing tests |
Protect hardware components from environmental damage |
|
Logging and Monitoring Tools |
Continuous (with monthly review) |
log inspection, anomaly detection, data backup |
Detect early failures and ensure traceability of system performance |
Table 7. Cost estimation for the proposed intelligent traffic control system
|
Component |
Quantity |
Unit Cost (USD) |
Total Cost (USD) |
Notes |
|
High-Resolution CCTV Cameras |
8 |
75 |
600 |
Covers 4 angles of the intersection |
|
Smart Traffic Signal Controller |
1 |
160 |
160 |
Includes programmable controller and AI integration |
|
Installation and Wiring |
– |
– |
400 |
Cabling and physical setup of all equipment |
|
Power & Network Setup (UPS + Connectivity) |
– |
– |
400 |
Ensures continuous operation |
|
Training and Pilot Operation |
– |
– |
500 |
Traffic personnel training and 1-week test run |
This study introduced an AI-based intelligent traffic light system that leverages YOLOv10 for real-time vehicle classification and traffic density estimation. The proposed system integrates vehicle count, vehicle type, and speed information to allocate green light durations dynamically. Experiments on traffic videos from Baghdad demonstrated notable improvements in traffic flow, including increased vehicle throughput and reduced queue delays compared to fixed-time control. These results highlight the system’s potential to reduce congestion, lower fuel consumption and carbon emissions, facilitate the timely passage of emergency vehicles, and promote the use of public transportation.
While the system showed high performance under favorable conditions, its effectiveness may be reduced in challenging lighting environments or at intersections with atypical geometries. Initial mitigation measures have already been implemented to address these challenges; however, further refinements and extensive testing are required to ensure reliable performance for large-scale deployment.
Future work will focus on testing in cities beyond Baghdad, with varied intersection geometries and lighting conditions; expanding the system to a cooperative multi-intersection system for coordinated signal timing by the first quarter of 2026 to assess transferability; and enhancing robustness with infrared cameras.
[1] Saadi, A., Abghour, N., Chiba, Z., Moussaid, K., Ali, S. (2025). A survey of reinforcement and deep reinforcement learning for coordination in intelligent traffic light control. Journal of Big Data, 12(1): 84. https://doi.org/10.1186/s40537-025-01104-x
[2] Zulkifli, C.N.A.B., Ponrahono, Z. (2018). The effect of traffic congestion on quality of community life. In 4th International Conference on Rebuilding Place (ICRP 2019), Universiti Sains Malaysia, pp. 759-766. https://doi.org/10.15405/epms.2019.12.77
[3] Abadi, A., Rajabioun, T., Ioannou, P.A. (2014). Traffic flow prediction for road transportation networks with limited traffic data. IEEE Transactions on Intelligent Transportation Systems, 16(2): 653-662. https://doi.org/10.1109/TITS.2014.2337238
[4] Li, W.W. (2020). Air pollution, air quality, vehicle emissions, and environmental regulations. In Traffic-Related Air Pollution. Elsevier, pp. 23-49. https://doi.org/10.1016/B978-0-12-818122-5.00002-8
[5] Schrank, D., Eisele, B., Lomax, T., Bak, J. (2015). 2015 Urban mobility scorecard. Texas A&M Transportation Institute and INRIX, Inc. https://rosap.ntl.bts.gov/view/dot/61407/dot_61407_DS1.pdf.
[6] McConnell, R., Islam, T., Shankardass, K., Jerrett, M., Lurmann, F., Gilliland, F., Gauderman, J., Avol, E., Künzli, N., Yao, L., Peters, J., Berhane, K. (2010). Childhood incident asthma and traffic-related air pollution at home and school. Environmental Health Perspectives, 118(7): 1021-1026. https://doi.org/10.1289/ehp.0901232
[7] Anderson, M.L. (2014). Subways, strikes, and slowdowns: The impacts of public transit on traffic congestion. American Economic Review, 104(9): 2763-2796. https://doi.org/10.1257/aer.104.9.2763
[8] Abdulwahab, A., Tayh, S., Ismael, N. (2017). Application of sustainable transport tools in central area–Baghdad city. International Journal of Science and Research, 7(11): 47-54.
[9] Gao, F., Wang, M.Z. (2010). Route choice behavior model with guidance information. Journal of Transportation Systems Engineering and Information Technology, 10(6): 64-69. https://doi.org/10.1016/s1570-6672(09)60072-6
[10] Sweet, M. (2011). Does traffic congestion slow the economy? Journal of Planning Literature, 26(4): 391-404. https://doi.org/10.1177/0885412211409754
[11] Redmon, J., Divvala, S., Girshick, R., Farhadi, A. (2016). You only look once: Unified, real-time object detection. In 2016 IEEE Conference on Computer Vision and Pattern Recognition, Las Vegas, NV, USA, pp. 779-788. https://doi.org/10.1109/CVPR.2016.91
[12] Wang, C.Y., Bochkovskiy, A., Liao, H.Y.M. (2023). YOLOv7: Trainable bag-of-freebies sets new state-of-the-art for real-time object detectors. In 2013 IEEE/CVF Conference on Computer Vision and Pattern Recognition, Vancouver, BC, Canada, pp. 7464-7475. https://doi.org/10.1109/CVPR52729.2023.00721
[13] Li, M., Wang, J., Du, B., Shen, J., Wu, Q. (2025). FuzzyLight: A robust two-stage fuzzy approach for traffic signal control works in real cities. arXiv preprint arXiv:2501.15820. https://doi.org/10.48550/ARXIV.2501.15820
[14] Hawi, R., Okeyo, G., Kimwele, M. (2017). Smart traffic light control using fuzzy logic and wireless sensor network. In 2017 Computing Conference, London, UK, pp. 450-460. https://doi.org/10.1109/SAI.2017.8252137
[15] Khasawneh, M.A., Awasthi, A. (2020). Intelligent traffic light control. In Proceedings of the 2nd African International Conference on Industrial Engineering and Operations Management (IEOM), Harare, Zimbabwe, pp. 754-766. https://www.ieomsociety.org/harare2020/papers/224.pdf.
[16] Michailidis, P., Michailidis, I., Lazaridis, C.R., Kosmatopoulos, E. (2025). Traffic signal control via reinforcement learning: A review on applications and innovations. Infrastructures, 10(5): 114. https://doi.org/10.3390/INFRASTRUCTURES10050114
[17] Natafgi, M.B., Osman, M., Haidar, A.S., Hamandi, L. (2018). Smart traffic light system using machine learning. In 2018 IEEE International Multidisciplinary Conference on Engineering Technology (IMCET), Beirut, Lebanon, pp. 1-6. https://doi.org/10.1109/IMCET.2018.8603041
[18] Liu, B., Ding, Z. (2022). A distributed deep reinforcement learning method for traffic light control. Neurocomputing, 490: 390-399. https://doi.org/10.1016/j.neucom.2021.11.106
[19] Moreno-Malo, J., Posadas-Yagüe, J.L., Cano, J.C., Calafate, C.T., Conejero, J.A., Poza-Lujan, J.L. (2024). Improving traffic light systems using Deep Q-networks. Expert Systems with Applications, 252(Part B): 124178. https://doi.org/10.1016/j.eswa.2024.124178
[20] Azad-Manjiri, M., Afsharchi, M., Abdoos, M. (2025). DDPGAT: Integrating MADDPG and GAT for optimized urban traffic light control. IET Intelligent Transport Systems, 19(1): e70000. https://doi.org/10.1049/itr2.70000
[21] Prathap, B.R., Kumar, K P., Chowdary, C.R., Hussain, J. (2022). AI-based YOLO V4 intelligent traffic light control system. Journal of Automation, Mobile Robotics and Intelligent Systems, 16(4): 53-61. https://doi.org/10.14313/JAMRIS/4-2022/33
[22] Sharma, M., Bansal, A., Kashyap, V., Goyal, P., Sheikh, T.H. (2021). Intelligent traffic light control system based on traffic environment using deep learning. IOP Conference Series: Materials Science and Engineering, 1022: 012122. https://doi.org/10.1088/1757-899X/1022/1/012122
[23] Zaatouri, K., Ezzedine, T. (2018). A self-adaptive traffic light control system based on YOLO. In 2018 International Conference on Internet of Things, Embedded Systems and Communications (IINTEC), Hamammet, Tunisia, pp. 16-19. https://doi.org/10.1109/iintec.2018.8695293
[24] Karoon, W., Chuasuai, P., Thipprasert, P., Khongchu, N., Kunakornjittirak, P., Siriborvornratanakul, T. (2024). Adaptive traffic light control using vision-based deep learning for vehicle density estimation. In Proceedings of the 2024 6th Asia Pacific Information Technology Conference, Bangkok, Thailand, pp. 37-42. https://doi.org/10.1145/3651623.3651629
[25] Rahman, R., Bin Azad, Z., Bakhtiar Hasan, M. (2021). Densely-populated traffic detection using YOLOv5 and non-maximum suppression ensembling. In Proceedings of the International Conference on Big Data, IoT, and Machine Learning: BIM 2021, Cox’s Bazar, Bangladesh, pp. 567-578. https://doi.org/10.1007/978-981-16-6636-0_43
[26] Kermany, D.S., Goldbaum, M., Cai, W., Valentim, C.C., et al. (2018). Identifying medical diagnoses and treatable diseases by image-based deep learning. Cell, 172(5): 1122-1131. https://doi.org/10.1016/j.cell.2018.02.010
[27] XVision AI traffic cam placement parameters. Minnovation Technologies. https://support.minnovation.com.au/xvision-ai-camera-placement-parameters?utm_source=chatgpt.com.
[28] Ayodeji, O., Olusegun, A., Olu, A., Obafemi, J.R., Akinrolabu, O.D., Rotiba, O. (2025). A deep learning-based model for traffic signal control using the YOLO algorithm. International Journal of Computer Applications, 186(63): 43-54. https://doi.org/10.5120/ijca2025924452
[29] Li, H. (2025). Intelligent transportation system for traffic congestion based on Dempster–Shafer evidence theory and fuzzy logic control. Transportation Research Record, 2679(5): 600-613. https://doi.org/10.1177/03611981241312917
[30] Liang, X., Du, X., Wang, G., Han, Z. (2019). A deep reinforcement learning network for traffic light cycle control. IEEE Transactions on Vehicular Technology, 68(2): 1243-1253. https://doi.org/10.1109/Tvt.2018.2890726
[31] Choe, C.J., Baek, S., Woon, B., Kong, S.H. (2018). Deep Q learning with LSTM for traffic light control. In 2018 24th Asia-Pacific Conference on Communications (APCC), Ningbo, China, pp. 331-336. https://doi.org/10.1109/APCC.2018.8633520