Hawraa Khaleel Ibrahim*![]() | Dina Sami Kadhim
| Dina Sami Kadhim![]() | Zahraa Ahmed Nadeem
| Zahraa Ahmed Nadeem![]() | Mohammed A. Salih
| Mohammed A. Salih![]()
© 2025 The authors. This article is published by IIETA and is licensed under the CC BY 4.0 license (http://creativecommons.org/licenses/by/4.0/).
OPEN ACCESS
This study conducts the simulation and optimization of the crude oil separation unit in Basra, Iraq, using Aspen HYSYS software. The investigation was executed through three distinct scenarios: The base case includes four separation stages, an enhanced design incorporates three separation stages, and the suggested configuration amalgamates three separators with a stripping column. The optimization process focused on promoting separation performance and reducing costs through eliminating the fourth-stage separator (S-104) via tuning the pressure drop across the valves to achieve an atmospheric pressure level at the final stage of separation. Additionally, integrating an alternative separation technique increased the crude oil (C6+) mass fraction from 0.8289 to 0.9798. The results proved that eliminating the fourth-stage separator (S-104) provided significant economic benefits without compromising product quality; C6+ mass fractions were recorded to be 0.9805. Specifically, the three-stage separation arrangement in Case 2 reduces the total capital costs by 20.75%, and this yields the cost savings of \$969,550 annually. Comparative economic analysis revealed that the three-stage separation (Case 2) offered the most cost-effective solution, with noticeable reductions in installation and operating expenses. In contrast, the integration of a stripping column in Case 3 led to a reduction of installation expenses by \$87,500 and an increase in other expenses. Further, it improved the separation efficiency by increasing the C6+ recovery, which is advantageous for high-quality crude processing, although it was associated with higher overall costs.
crude oil, separation phases, stripping column, Aspen HYSYS, economic analysis
Petroleum extracted from a reservoir contains intricate mixture of molecules predominantly consist of hydrogen and carbon, each one shows distinct density, vapor pressure, and other physical characteristics. Crude oil extracted from terrestrial sources is a compound of hydrocarbon gases and fluids s, intricately combined with water vapor, free water, fluids particles, and various impurities. Gases are released from fluids s, water vapor condenses, and specific constituents of the well stream transformed from fluids to bubbles, then to fog, and finally to free gases. High velocity gas creates an aerosol of fluids droplets, while fluids containing gas bubbles forms a dispersion of gas bubbles [1]. The Basra oilfields, which provide Basrah Light, Medium, and Heavy crudes, exhibit varying API gravities (24–31°) and comparatively high sulfur concentrations (2.7–4.0%) [2]. The production of associated gas containing detectable H₂S, elevated water cut in mature areas, and saline formation waters complicates separation operations [3]. The main phases must be separated to enable processing or delivery. The apparatus and circumstances following a separation often shall determine the necessary degree of separation and specific design of the vessel. Separators often operate with two-phase systems to separate gas and fluids, or three-phase systems for the separation of gas, oil, and free water [4]. Both types may compromise sand and sludge elimination devices when processing well streams contain particles. A separator is essentially a pressure tank, to assist in gravitational separation of various phases of the process stream according to their densities [5]. The purpose of Phase separation is to mitigate pressure on fluids of reservoir gradually, hence yielding a more stable stock-tank fluids. Under increased pressures, petroleum fluids generally consist of significant quantities of liquefied propane, butane, and pentane, which will vaporize or flash upon a reduction in pressure. This flashing may substantially reduce stock-tank fluids recovery, depending on well-stream composition, pressure, temperature, and other factors [6]. The optimal separation method to reach maximum fluids recovery involves the differential release of gas through a gradual reduction in pressure from the reservoir to the storage tanks. With each minor lowering in pressure, the gas released would be promptly extracted from the fluids. Nonetheless, implementation this differential process would be necessitated endless number of separation phases, which is evidently unfeasible option. We can get a close approximation of differential release by applying series-connected phases of separation, wherein flash vaporization occurs in each Phase. This approach allows optimal recovery of fluids resources [7]. The previous studies have been reviewed the application of optimization and simulation processes of boosting the crude oil separation efficiency and improve the economic performance of Multi-Phase Separation Systems. Mahsakazemi [8], tested separator simulations by altering several variables, include positive fraction partitioning methods and separator temperatures. The condition stated the minimum deviation from experimental data was chosen for testing crude oil separators. The optimal separator pressure that minimizes the overall GOR function was determined based on this analysis. The findings indicated that the Cavett-Edmeister method yields the minimal error value, and the variations in temperature had negligible influence on separator conditions. Mahmoud et al. [9] suggested precise algorithm to predict optimal separation parameters in a multi-Phase crude oil production unit. The suggested methodology determines suitable separator pressures at various separation Phases to enhance operating conditions. An optimization approach is employed to develop optimal artificial neural network model to predict ideal operating parameters improve fluid recovery. The primary objective of this project is to develop an advising system for enhancing oil recovery from production facilities. Moazami Goodarzi et. al. [10] discussed the most important feed characteristic, which has the greatest influence on separator conditions, especially the heptane plus content in the crude oil. It was observed that the heptane plus threshold to determine the appropriate number of separator Phases; which is ca. 30% in the feed Compound. Three separators and a storage tank are required to collect samples with heptane plus contents is less than 30%, and two separators with a storage tank are required to collect samples with heptane plus contents is greater than 30%. The results indicated an increase in oil production ca. 1.3% for the new optimization approach relative to the fixed-ratio method. The previous researchers discussed two criteria for determining the separator size for the Jambur field: the first condition was based on a production rate of 80,000 barrels per day, while the second condition was based on splitting production between rows A and B, with each row producing 40,000 barrels per day. The calculations resulted in an optimal separator pressure of 700 psi for the first Phase, 300 psi for the second Phase, and 120 psi for the third Phase [11]. The results indicated that increasing the number of Phases to more than three in the Jambur field leads to reduced fluid recovery, making the cost of an additional step unjustified. Kotb et al. [12] used Aspen HYSYS modeling and optimization tools to evaluate three different scenarios for improving GOSP performance and stabilizing crude oil. The first scenario analyzed the effectiveness of the existing two-Phase separator in both conventional and optimized configurations. The second scenario altered the T-separator by sequentially rearranging its separators to achieve optimal operating pressures. In the third scenario, a fourth separator was incorporated into the optimized three-Phase system to evaluate additional optimization possibilities. Simulation results showed significant improvements in oil recovery and financial returns: oil recovery increased by 1.8%, 2.3%, and 2.0% in the three scenarios, respectively. Net profit increased by 6.4%, 5.8%, and 4.3%, respectively. This project entailed the simulation of a crude oil separation facility at the Basra oil field, Iraq, utilizing Aspen HYSYS. Prior research has investigated multiple separation methods, emphasizing traditional two- or three-stage separators to stabilize crude oil under diverse field settings. Nevertheless, none of them incorporated a three-stage stripping tower to concurrently enhance hydrocarbon recovery and cost-effectiveness. This research examines this deficiency; this work's innovation is the proposal of a three-stage separation system integrated with a stripping tower, along with an assessment of its economic viability.
The gas-oil separation plant is built to process crude oil, and its detailed composition is shown in Table 1. The untreated fluid, at a crude flow rate 58,523 Kg/h, pressure of 42.2 kg/cm2g and a temperature of 60℃, (API) gravity value 26.85°, consisting of hydrocarbon vapor, crude oil, and up to 20% formation water, Formation water salinity (180,000 - 240,000) ppm, enters the crude oil processing plant from the intake manifold, where it passes through a series of stages to separate the gas and water from the oil.
Table 1. Reservoir crude oil composition
|
Component |
Mol% |
Wt% |
Vol% |
|
N2 |
0.39 |
0.17 |
0.13 |
|
H2S |
0.81 |
0.49 |
0.39 |
|
CO2 |
2.46 |
1.68 |
1.28 |
|
C1 |
38.67 |
9.62 |
20.22 |
|
C2 |
15.92 |
7.42 |
12.52 |
|
C3 |
7.33 |
5.01 |
6.22 |
|
iC4 |
1.49 |
1.33 |
1.5 |
|
nC4 |
3.59 |
3.24 |
3.49 |
|
iC5 |
1.53 |
1.71 |
1.73 |
|
nC5 |
2.1 |
2.36 |
2.35 |
|
C6+ |
25.71 |
66.97 |
50.17 |
|
Total |
100 |
100 |
100 |
2.1 First-phase separator (S-101)
The fluid starts its journey, passing into the 1st Phase separator, S-101. This is a three-phase separator where foam breakers, coalescing medium packs, and wave baffles assist in separating hydrocarbon vapour, crude oil, and water, as is typical followed by three separators design. The bulk of the water with some droplets of crude oil, goes to the oily water coalescer vessel, V-105, under interface level control valve [13]. Before entering the 2nd Phase separator S-102 / dehydrator D-101 system, recycle water, defoamer, and demulsifier chemical are injected into the crude oil stream. The recycled water is extracted from the 3rd Phase separator S-103 / desalter D-102 system and injected into the crude oil stream recycle pumps and the interface level control valve. This mixture of fluids passes through the S-102 / D-101 system mix valve to thoroughly wet and dissolve impurities and dilute the water contained in the crude oil, under controlled conditions.
2.2 Second-phase separator (S-102) / dehydrator (D-101)
The crude oil, laden with some water, passes downstream to the S-102 second-Phase separator/D-101 dryer system under fluids level control. As the pressure drops through the control valves, some of the crude oil is converted to hydrocarbon vapor. The S-102 is a two-phase separator mounted on the dryer. The fluids extracted from the S-102 separator pass through a tube is sloped down to the dryer, where it is dissolved under an electrostatic field and then separated. Most of the water containing the dissolved/wetted impurities falls by gravity force to the bottom of the dryer vessel, where it is removed via a wastewater outlet header. The crude oil, along with some laden water, exits the D-101 onto an outlet tray at the top of the vessel and passes down to the S-103 third-phase separator [14].
2.3 Third-phase separator (S-103)
Before entering the S-103/D-102 third-phase separation system, wash water, defoamer, and demulsifier are injected into the crude oil stream. These fluids pass through a mixing valve to completely wet and dissolve impurities and dilute the remaining water in the crude oil from the S-102/D-101 systems under controlled conditions. Steam is directed to the low-pressure flare through the low-pressure flare separation cylinder via a back-pressure control valve, which maintains the S-103 system pressure at approximately 4.6 kg/cm2 g [14].
2.4 Fourth-phase separator (S-104)
The 4th Phase separator S-104 is a two-phase separator. The vapor is transferred to the flare stack with the FS-103 low-pressure flare separation cylinder, via the PV-144 backpressure control valve, which maintains S-104 pressure at approximately 2.8 kg/cm². The crude oil with traces of water exits the S-104 under level control via the LV-143 control valve and passes into the final phase of a vertical separator. As the pressure drops through the LV-143 control valve, some of the crude oil is converted to hydrocarbon vapor. The crude oil is discharged from the bottom of the vertical separator to storage.
Aspen HYSYS process simulation software was used to model and analyze the performance of a crude oil separation unit. Aspen HYSYS is widely recognized in the oil and gas industry for its outstanding modeling capabilities particularly for hydrocarbon systems.
Case 1: Basic process simulation
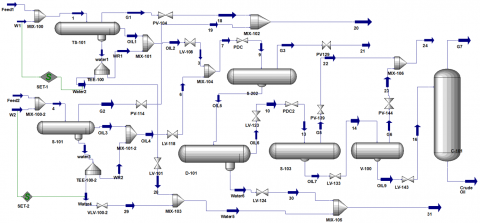
The understudy separation unit was simulated to actual operating conditions through embedding produced-part temperature, pressure, and flow rate values. The process fluid consists of various hydrocarbon components, ranging from light gases to heavy fractions, which makes accurate prediction of phase equilibria critical to assess the separation efficiency. Since the primary components of crude oil are hydrocarbons, the Peng-Robinson equation of state was chosen to perform all thermodynamic property calculations [14]. It is effective to predict the behavior of non-ideal vapor-fluids equilibria of hydrocarbon mixtures under a wide range of pressures and temperatures. The separation chain, including primary and secondary separators, was modeled using detailed input parameters, and the simulation results were analyzed to determine phase compositions, product recovery rates, as illustrated in Figure 1.
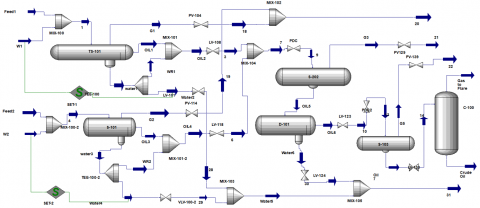
Case 2: Elimination of the fourth-phase separator (S-104)
To improve the separation process, it is essential to appoint out factors affect on separation efficiency. Pressure, in particular, plays a vital role in degassing process and to separate water from crude oil. Other important factors include the number of separation Phases and the type of equipment used. In this context, the pressure was reduced by controlling the valves in front of each separator. Atmospheric pressure reached in the third Phase of separation was 1.03 kg/cm², allowing the 4th Phase separator be excluded as shown in the Figure 2 without compromising the separation efficiency secured in the Case 1.
Case 3: Integration of stripping-phase
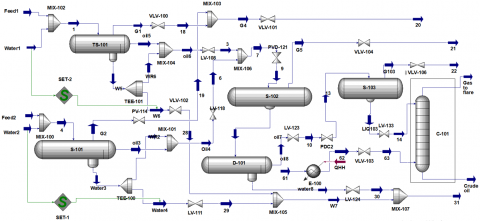
The use of a packed stripper column in the final Phase has been proposed as an alternative to the vertical separator. A packed stripper is a device used in chemical processes to remove volatile components from a fluids stream by facilitating contact with the gas or vapor phase. The choice of a packed stripper column over an absorption column was conditioned by whether the system utilizes a gas or fluid membrane. The gas mass transfer coefficient is typically used for gas absorption, while the fluid mass transfer coefficient is typically used for stripping; therefore, a packed stripper column was chosen [15]. Furthermore, the packed stripper column was chosen because it does not require byproduct extraction from the sides; only the lighter, more volatile components are drawn from the top, while the heavier materials are removed from the bottom [16]. Key design factors include the type of packing, column diameter, column height, and pressure drop. After the third-Phase separator, the crude oil is pressure-reduced at each Phase by valve control until it reaches atmospheric pressure in the final Phase before entering the stripper. The two-phase flow enters the upper section of the stripper and descends through the column. It is contacted by sweet stripping gas, defined by its composition [17], which enters the column from the bottom and ascends to the top. Structured packing within the column facilitates the interaction between the crude oil and the sweet gas to remove hydrogen sulfide from it. The stripping gas, supplemented with hydrogen, exits the top of the column. The stripping gas is heated using an electric heater [14]. The crude oil is released from the base of the column into the reservoir and passes through a valve to maintain a controlled fluid level. Figure 3 shows the improved design of a three-phase crude oil separation facility, which includes an oil separation column. This design aims to improve separation efficiency and raise the purity of the oil by separating the gas from the water. The importance of the stripping column is highlighted when juxtaposed with traditional separation technologies. Although two- or three-stage separators are prevalent, they frequently result in increased hydrocarbon losses and restricted flexibility. The suggested three-stage plus stripping tower method improves recovery and pressure drop management, rendering it a technically viable option for crude stabilization in upstream operations.
Mathematical equations are applied for designing industrial three-and-two-phase horizontal separators equipped with a weir to separate gas, oil, and water phases effectively. These calculations embrace optimizing essential parameters, such as the diameter and length of the vessel required to meet the required process destinations. The process regards fluid properties, flow rates, as mentioned in Table 2, and retention times to achieve efficient phase separation while minimizing pressure drop. Additionally, the surface area, wall thickness, and approximate weight of the vessel are calculated; the design procedures of the vessel with weir are detailed as follows [17].
Step 1: Determination of settling velocity and vapor velocity.
$U_T=k\left(\frac{\rho_L-\rho_V}{\rho_V}\right)^{0.5}$ (1)
$U_V=_{0.75}U_T$ (2)
Step 2: Determination of vessel diameter.
$D=\left(\frac{4\left(V_H+V_S\right)}{0.5 \pi(L / D)}\right)^{1 / 3}$ (3)
Step 3: Determination of low liquid level in separator container.
$H_{L L L}=0.5 D+7$ (4)
Step 4: Determination of weir height.
$H_W=D-H_V$ (5)
Step 5: Determination of minimum length for light liquid collection zone.
$L_2=\frac{V_H+V_S}{A_T-A_V-A_{L L L}}$ (6)
Step 6: Determination of minimum length of the section required to facilitate the separation of light and heavy liquid phases, thereby receiving the calculation of the total vessel length.
$L_l=\max \left(\frac{t_{L H} Q_{H L}}{A_{H L}}, \frac{t_{H L} Q_{L L}}{A_{L L}}\right)$ (7)
$L=L_1+L_2$ (8)
Step 7: Determination the thickness and rough weight of the vessel shell.
$t_{\text {shell }}=\frac{P D}{2 S E-1.2 P}+t_c$ (9)
$W=\left(490 I b / f t^3\right)\left(\frac{t_{\text {shell }}}{12}\right)\left(A_{\text {shell }}+2 A_{\text {Head }}\right)$ (10)
4.2 Stripping column
The routine design equations exhibit the critical variables for the packed column and its pressure vessel. These calculations cover the column diameter, packing height, transfer units, flooding velocity, and pressure drop. To ensure structural safety under operating conditions, we also include design formulas for shell and head thicknesses and weights from a mechanical perspective. Collectively, fluid properties, flow rates, and mechanical constraints contribute to reliable column design; the stepwise methodology is outlined as follows [18]:
Step 1: Specifying the packing’s detailed characteristics, including size (2 in), bulk density (651 kg/m³), surface area (95 m²/m³), and packing factor (210 m⁻¹).
Step 2: Determination of column diameter, D.
$D=1.128\left[\frac{G}{G^{\prime}}\right]^{0.5}$ (11)
Step 3: Determination of height equivalent of theoretical plate for packing, HETP [19].
$H E T P=\frac{\left(4.82\left(\rho_L-\rho_G\right)^{0.5} \mu_r{ }^{-0.06}\right)}{\alpha}$ (12)
$\alpha=a_P\left[\left(1+0.78 e^{0.00058 a_P}\right)\left(\frac{\rho_G}{\rho_L}\right)^{0.25}\right]^2$ (13)
Step 4: Determination of Number of transfer units, NTU.
${N}_{\text {total }}=\frac{1}{1-\beta} \ln \left[(1+\beta) \frac{x_2-y_1}{x_1-y_1}+\beta\right]$ (14)
Step 5: Determination of height of overall gas transfer unit, Hog.
$H_{o g}=H E T P \frac{(1 / \beta-1)}{\ln (1 / \beta)}$ (15)
Step 6: Determination of total height stripping column.
$H_{\text {total }}=H_{\text {og }} \times N_{\text {total }}$ (16)
Step 7: Determination the thickness and weight of shell.
$t_s=\frac{P D}{2 f J-P}+C$ (17)
Shell Weight =Volume of shell × Density of shell material
Step 8: Determination the thickness and weight of column head.
$t_h=\frac{P D}{2 f \bar{J}+0.2 P}$ (18)
$W=\rho_m \frac{4 \pi\left(D_o-D_i\right)\left(h_o-h_i\right) c}{3}$ (19)
Table 2. Flow rates and fluid properties at separators
|
S-101 |
Mass flow, lb/hr |
Density, lb/ft3 |
Viscosity, cP |
|
Oil |
838521.60 |
46.327 |
1.6777 |
|
Gas |
198676.18 |
2.561 |
1.334 |
|
Water |
316286.18 |
72.347 |
0.73 |
|
S-102 |
Mass flow, lb/hr |
Density, lb/ft3 |
Viscosity, cP |
|
Oil |
801494.96 |
48.07 |
1.846 |
|
Gas |
37203 |
0.95 |
1.174 |
|
Water |
110991.72 |
66.467 |
0.71 |
|
S-103 |
Mass flow, lb/hr |
Density, lb/ft3 |
Viscosity, cP |
|
Oil |
78350.17 |
49.15 |
1.95 |
|
Gas |
18018.3 |
0.456 |
1.156 |
|
Water |
62384.2 |
62.29 |
0.78 |
|
S-104 |
Mass flow, lb/hr |
Density, lb/ft3 |
Viscosity, cP |
|
Oil |
777289.08 |
49.3 |
1.56 |
|
Gas |
6120.508 |
0.347 |
1.09 |
|
Water |
1522.964 |
62.190 |
0.77 |
5.1 System performance and material balance analysis
The results acquired from the Aspen HYSYS simulation evaluated the separation unit performance in three case studies according to the conditions approved for each case. Table 3 presents the crude oil specifications before storage. The temperature dropped remarkably in Case 3 to 30.54 compared to Cases 1 and 2 of 41, while pressure remained relatively constant around 101.1 kPa. The temperature reduction in Case 3 wins at making the crude oil ideal for storage. H₂S and CO₂ concentrations are minimal across all cases, announcing effective separation. The distribution of hydrocarbons is shifting along three cases, with a notable growth of C6+ from 82.89% (Case 1) to 97.98% (Case 3), reflecting heavier crude. This suggests Case 3 yields a more stabilized and denser product.
Table 3. Crude oil characteristics directed to storage
|
Condition |
Case 1 |
Case 2 |
Case 3 |
|
Temperature, ℃ |
41.06 |
41.11 |
30.54 |
|
Pressure, kPa |
101.1 |
101.1 |
101.3 |
|
Mass flow, kg/hr |
3.711e5 |
3.711e5 |
3.518e5 |
|
Composition |
Case 1 |
Case 2 |
Case 3 |
|
N2 |
0 |
0 |
0 |
|
H2S |
0.0006 |
0.0001 |
0 |
|
CO2 |
0.0001 |
0 |
0 |
|
C1 |
0.0001 |
0 |
0.0004 |
|
C2 |
0.0045 |
0.0009 |
0.0001 |
|
C3 |
0.0246 |
0.0074 |
0.0001 |
|
iC4 |
0.0146 |
0.0057 |
0 |
|
nC4 |
0.0468 |
0.0181 |
0.0003 |
|
iC5 |
0.0318 |
0.0152 |
0.0064 |
|
nC5 |
0.0480 |
0.0230 |
0.0130 |
|
C6+ |
0.8289 |
0.9295 |
0.9798 |
This demonstrates how reducing system pressure affects vapor-liquid equilibrium: as the pressure decreases, lighter components preferentially transition to the vapor phase, resulting in a heavier liquid fraction that is enriched in C6+. Material balance, as an eloquent procedure, is a routine and useful method for crude oil separation unit performance analysis. Mass transfer processes fundamentally govern the behavior of the separation plant, maintaining that the inside and outside mass were equal. Since chemical reactions are not implicated in this process, both generation and consumption terms are zero. Furthermore, for a continuous process operating under steady-state conditions, the accumulation term is also zero. These calculations are carried out to determine the composition of each missing component for the mixed gas stream and 17 streams within the as-built unit based on the overall mass balance approach. The results were then compared with the corresponding outcomes extracted from Aspen HYSYS simulation. As illustrated in Table 4, a comfortable agreement was observed between the manually calculated and the Aspen HYSYS results. This process confirms both the robustness of the model and the reliability of its physical interpretation.
Table 4. Mass fraction composition of the separation unit streams
|
Component |
1 |
4 |
61 |
Mixed Gas, wt% (Manual) |
Mixed Gas, wt% (HYSYS) |
17, wt% (Manual) |
17, wt% (HYSYS) |
31 |
|
N2 |
0.0013 |
0.0013 |
0.001 |
0.0038 |
0.005 |
0 |
0 |
0 |
|
H2S |
0.0034 |
0.0034 |
0 |
0.0125 |
0.0122 |
0 |
0 |
0 |
|
C1 |
0.0763 |
0.0763 |
0.904 |
0.3431 |
0.3423 |
0.00037 |
0.0004 |
0 |
|
C2 |
0.0589 |
0.0589 |
0.0662 |
0.2218 |
0.2214 |
0.00019 |
0.0002 |
0 |
|
C3 |
0.0397 |
0.0397 |
0.0243 |
0.1481 |
0.1479 |
0 |
0 |
0 |
|
i-C4 |
0.0106 |
0.0106 |
0 |
0.0391 |
0.0393 |
0.00028 |
0.0003 |
0 |
|
n-C4 |
0.0257 |
0.0257 |
0 |
0.0948 |
0.0941 |
0.00557 |
0.006 |
0 |
|
i-C5 |
0.0136 |
0.0136 |
0 |
0.032 |
0.038 |
0.0115 |
0.0124 |
0 |
|
n-C5 |
0.0186 |
0.0186 |
0 |
0.044 |
0.034 |
0 |
0 |
0 |
|
CO2 |
0.0133 |
0.0133 |
0.0019 |
0.049 |
0.0487 |
0 |
0 |
0 |
|
H2O |
0.2074 |
0.2074 |
0.0026 |
0.0028 |
0.0036 |
0 |
0 |
1 |
|
C6+ |
0.5311 |
0.5311 |
0 |
0.008 |
0.0035 |
0.9821 |
0.9805 |
0 |
|
Total |
1 |
1 |
1 |
1 |
1 |
1 |
1 |
1 |
5.2 Equipment design calculations for the separation system
From the design standpoint, calculations of the diameter, height, and length of the horizontal separators rely on the corresponding fluid flow rates, while the wall thickness is determined according to the internal operating pressure. The pioneer outcomes are toward design that ensured required separation conditions with the lowest pressure drop, as summarized in Table 5. It is noted that the higher flow rates are accommodated in S-101, which directly reflects the larger vessel diameter of 13 ft, holdup volume of 1508.39 ft³, and vessel weight of 22035.71 lbs. By comparison, S-104 has a lower capacity for flow rates, resulting in a vessel diameter of 11 ft, a holdup volume of 1313.85 ft³, and a vessel weight of 3632.47 lbs. The difference in vapor and settling velocities ensures optimal phase disengagement. S-103 shows a higher terminal velocity of 3.274 ft/s to ensure faster vapor separation under intermediate loads. Additionally, both light and heavy fluid phases' settling times recorded acceptable design limits (typically from 3 min to 10 min), leading to the creation of a balance between residence time and process production. These incorporated development circumstances make the methodology suitable for industrial applications.
Table 5. Basic design of four separators (S-101 to S-104)
|
Parameter |
S-101 |
S-102 |
S-103 |
S-104 |
|
Qv, ft3/s |
21.55 |
10.87 |
11.12 |
5 |
|
QLL, ft3/min |
301.667 |
277.89 |
265.706 |
262.77 |
|
Parameter |
S-101 |
S-102 |
S-103 |
S-104 |
|
QHL, ft3/min |
72.867 |
27.83 |
16.69 |
0.4081 |
|
UT, ft/s |
1.171 |
2.135 |
3.274 |
2.807 |
|
UV, ft/s |
1 |
1.635 |
2.574 |
3.07 |
|
VH, ft3 |
1508.39 |
1389.45 |
1328.33 |
1313.85 |
|
VS, ft3 |
905.001 |
833.67 |
797.118 |
788.31 |
|
Vessel diameter (D), ft |
13 |
11 |
11 |
11 |
|
Vessel length (L), ft |
33 |
33.91 |
32.42 |
32 |
|
AT, ft2 |
95.033 |
132 |
132 |
132 |
|
HV, ft |
2.2 |
6.5 |
6.5 |
5 |
|
HW, ft |
6 |
6 |
6 |
6 |
|
UHL, in/min |
5.210 |
8 |
4.318 |
3 |
|
ULH, in/min |
10.88 |
8.392 |
8.392 |
6 |
|
tHL, min |
7.68 |
3.9 |
3.9 |
9.6 |
|
tLH, min |
6.46 |
5.32 |
4.46 |
4.15 |
|
Shell surface area, ft2 |
2211.68 |
1384 |
798.84 |
2368.76 |
|
Vessel weight, Ibs |
22035.71 |
5124 |
4387.4 |
3632.47 |
Table 6 presents observations for the development procedure design after eliminating the 4th-Phase separator and applying the stripping column. Both vapour and crude oil flow rates at S-102 increased notably contrast to the prior basic case. The volumetric flow rate of vapour rose from 10.87 ft³/s to 24.534 ft³/s, and the volumetric flow rate of crude oil elevated from 277.89 ft³/min to 286 ft³/min, inspiring a reallocation of gas load to better utilize S-102’s augmented capacity. Furthermore, S-102 offers moderate settling velocities of UHL = 7 in/min, ULH = 8 in/min, which support faster phase separation despite higher vapour loading. There has been an improvement in the diameters and lengths separators to accommodate higher flow rates, in the same time kept the vapour velocity in S-101 reduced to 0.8907 ft/s, minimizing re-entrainment risk. The cross-sectional area was increased in three separators; this modification supports an increase of horizontal flow spread and preserves laminar fluids movement across the weir section. The vapour space height and weir height showed growth also, providing larger areas and enhancing foam extinction and fluids surge handling. The shell surface area and vessel weight explain insight into mechanical robustness and fabrication needs: S-102, being the largest in length and with high vapour flow rate, has the highest shell surface area (2375.04 ft²) and weight (8353.24 lbs). S-103, handling relatively lower volumes, reflects the lightest design (798.84 ft², 1387.4 lbs) and is suitable for downstream polishing or final-Phase separation. S-101, despite its larger flow rates, has a shell area of 2023.18 ft², highlighting the trade-off between length and diameter in defining surface exposure and structural demand.
Table 6. Optimized design of three separators (S-101 to S-103)
|
Parameter |
S-101 |
S-102 |
S-103 |
|
Qv, ft3/s |
21.29 |
24.534 |
11.12 |
|
QLL, ft3/min |
302.05 |
286.03 |
265.766 |
|
QHL, ft3/min |
73.500 |
12.529 |
16.69 |
|
UT, ft/s |
1.17 |
2.10 |
3.43 |
|
UV, ft/s |
0.89 |
1.75 |
2.57 |
|
VH, ft3 |
1510.25 |
1430.15 |
1328.53 |
|
VS, ft3 |
906.15 |
858.09 |
797.118 |
|
Vessel diameter (D), ft |
14 |
13 |
13 |
|
Vessel length (L), ft |
46 |
42 |
32 |
|
AT, ft2 |
153.93 |
143.63 |
132 |
|
HV, ft |
3 |
4 |
6.5 |
|
HW, ft |
6.5 |
6.5 |
6.5 |
|
UHL, in/min |
10.66 |
7 |
9 |
|
ULH, in/min |
10.50 |
8 |
10 |
|
Parameter |
S-101 |
S-102 |
S-103 |
|
tHL, min |
6.75 |
8.4 |
9.25 |
|
tLH, min |
6.85 |
7.25 |
9.36 |
|
Shell surface area, ft2 |
2023.18 |
2375.04 |
798.84 |
|
Vessel weight, Ibs |
16109.73 |
8353.24 |
1387.4 |
5.3 Effect of removing 4th-Phase separator (S-104) and adding a stripping column
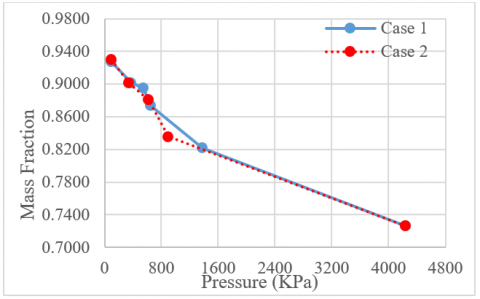
Figure 4 displays an inverse relationship between pressure and mass fraction of crude oil, with lower pressures producing higher concentrations of heavy hydrocarbons. This comparison was made between Case 1 and Case 2. Demonstrates the impact of pressure reduction on vapor-liquid equilibrium: when system pressure diminishes, lighter components preferentially shift to the vapor phase, resulting in a heavier liquid fraction enriched in C6+. The sharp increase in C6+ content after the first separation Phase is attributed to the removal of gas and water for both cases. Furthermore, the removal of the 4th-Phase separator does not significantly affect the separation efficiency, suggesting the potential for simplifying the process and reducing costs without compromising performance.
Figure 4. Pressure vs. mass fraction of crude oil compounds (C6+)
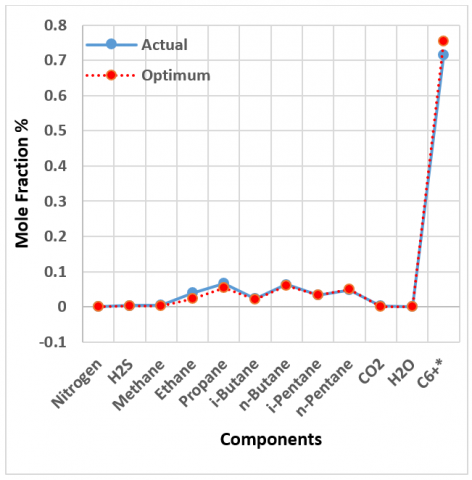
Figure 5 exhibits a comparison between the actual and optimum mole fraction compositions at the third phase separator. The x-axis states the component names embedded from N₂ to C₆+, while the y-axis shows the mole fraction of these components. There is strong alignment between most components’ actual and optimum values, confirming the model’s accuracy. A sharp spike is observed in the mole fraction of C6+, making it the dominant component, while the other components have much lower fractions. And increased in C6+ at stream 14 from 71% to 74%. This illustrates the enhanced phase equilibrium attained in the third-stage separator: when pressure and temperature diminish, lighter components preferentially vaporize, resulting in a liquid concentrated in heavier fractions. In comparison to previous designs, the optimized case attains enhanced stability and superior crude quality, indicating that supplementary separation stages yield quantifiable advancements in product composition without considerable divergence from anticipated values.
Figure 5. Fraction comparison of stream 14 at S-103: actual vs. optimum
Meanwhile, the packed stripping column design is detailed in Table 7, where Raschig rings in ceramic form measuring 0.038 m construct the internal packing of this column. The results reveal that the column has a diameter of 2.5 m, resulting in a cross-sectional area of approximately 4.906 m². The overall height of the column is 20 m, the shell alone weighs 778131 kg, and the weight of the head is 79 kg; the total structural mass references a robust industrial design suitable for high-production separation operations. The column displays a number of transfer units (NTU) equal to 5.5, which enhances the stripping process across the packed bed. Combined with a height of gas transfer unit (Hog) of 3.8 m, the effective packed height (Z) can be estimated using the relationship Z = NTU × Hog, which is around 20.9 m, which is consistent with the calculated total geometric height of the column [20]. The calculated error percentage between the effective packed height and the calculated height of the column is 4.5%, which is relatively small and indicates good agreement between design assumptions and actual construction. In scenarios where minimizing energy consumption and compressor load is crucial, the lowest pressure drop is advantageous. The pressure drop across the packed section was recorded as 0.204 in H₂O/ft.
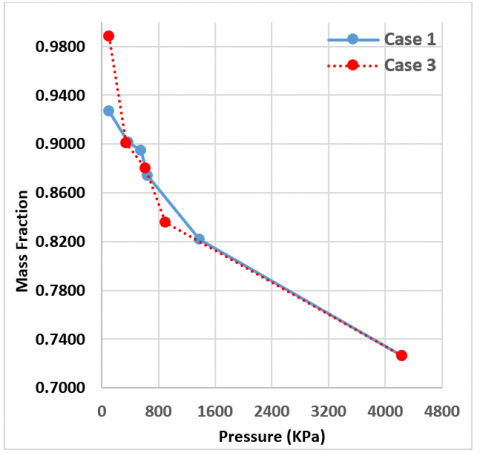
Figure 6 depicts the correlation between pressure and mass fraction for Case 1 and Case 3. In both scenarios, a decrease in pressure results in an elevation in the mass fraction of heavier hydrocarbons, illustrating the essential vapor-liquid equilibrium principle that lighter components preferentially transition to the vapor phase at reduced pressures. Case 3, which incorporates a stripping column, consistently exhibits elevated mass fractions throughout the pressure range in comparison to Case 1. The improved performance is due to the extra mass transfer step offered by the stripping column, where counter-current vapor-liquid interaction aids in the extraction of residual light hydrocarbons from the liquid phase. Consequently, Case 3 produces a more stabilized crude with an elevated C6+ concentration and reduced vapor pressure, highlighting the enhanced separation efficiency and product quality attained by the integrated configuration compared to the conventional system.
Table 7. Specifications of the packed stripping column
|
Diameter of column, m |
2.5 |
|
Area of Column, m2 |
4.906 |
|
NTU |
5.5 |
|
Hog, m |
3.8 |
|
Height of column, m |
20 |
|
Weight of shell, kg |
778131 |
|
Weight of head, kg |
79 |
|
Pressure drop |
0.204 inH2O/ft |
Figure 6. Pressure vs. mass fraction of C6+ for Case 1 and Case 3
Despite the Aspen HYSYS simulations being executed at genuine field operating conditions of 42.2 kg/cm² pressure, 60°C temperature, API 26.85°, 58523 kg/h flow rate, and 2.04 centistokes viscosity, several restrictions must be acknowledged. The model relies on idealized assumptions, such as steady-state operation, perfect phase balancing, and homogeneous feed composition, which may not accurately represent the intricacies of real-world settings. In practice, differences in crude composition, equipment inefficiencies, and contamination may result in variances between anticipated and actual performance. Moreover, problems like tray efficiency, insufficient gas-liquid distribution, and operational interruptions may affect how well stripping towers perform in actual operations. The discrepancies suggest that, although the simulation outcomes are dependable, pilot-scale testing or field validation is essential to verify their relevance in actual operating settings.
5.4 Economic analysis
A comprehensive economic evaluation was conducted to compare the performance and costs of the three cases examined in this study. Each case was evaluated in terms of capital investment, operating expenses, equipment costs, and utility consumption and is systematically presented in Table 8. This evaluation provides important insights into the trade-offs between process performance and economic feasibility, supporting informed decisions for process optimization and design selection.
Table 8. Economic analysis for three case designs
|
Summary |
Basic Process (Case 1) |
Three Stages Separator (Case 2) |
Three Stages Separator with Stripping (Case 3) |
|
Total Capital Cost [USD] |
4,670,960.00 $ |
3,701,410.00 $ |
4,692,590.00 $ |
|
Total Operating Cost [USD/Year] |
993,459.00 $ |
983,341.00 $ |
1,039,220.00 $ |
|
Total Utilities Cost [USD/Year] |
35,544.40 $ |
35,544.40 $ |
49,811.00 $ |
|
Desired Rate of Return [Percent/Year] |
20.00 $ |
20.00 $ |
20.00 $ |
|
Equipment Cost [USD] |
737,900.00 $ |
539,700.00 $ |
746,800.00 $ |
|
Total Installed Cost [USD] |
1,962,700.00 $ |
1,362,900.00 $ |
1,875,200.00 $ |
|
Electricity [KW] |
4.0548 USD/H |
4.0548 USD/H |
5.6823 USD/H |
The results presented in Table 8, are demonstrating significant improvements in economic performance in Case2 compared to Case 1. The total capital cost decreased from 4,670,960 \$ to 3,701,410 \$, reflecting an annual saving of 969,550 \$. Similarly, the total operating cost declined from 993,459 \$ to 983,341 \$, resulting in a cost reduction of 10,118 \$. Additionally, the equipment cost was reduced from 737,900 \$ to 539,700 \$, indicating a decrease of 198,200 \$, while the total installed cost dropped from 1,962,700 \$ to 1,362,900 \$, amounting to a saving of 599,800 \$. These results confirm that eliminating the 4th-stage separator (Case 2) contributes to significant cost savings and enhances the economic feasibility of the separation process, while maintaining the same separation efficiency. Additionally, an economic assessment was implemented to compare the costs between the first and third scenarios. The analysis revealed that the annual capital cost increased by 21,620 \$, while the operating cost increased by 45,761 \$ per year. Additionally, the cost of utility has increased by 14,267 \$ per year, and equipment costs increased by 8,900 \$ per year. Conversely, the total installation cost decreased significantly by 87,500 \$ per year. Furthermore, electricity consumption costs increased by approximately 1.6275 KW. These results indicate that although the integration of the degassing tower increased operating and capital expenditures, the lower installation costs partially compensated for the economic benefits. Crude oil separation efficiency also improved significantly.
The present work summarized the prominent results of the crude oil separation unit from the theoretical equations and the simulation via Aspen HYSYS, as well as economic improvements through process modification.
(1) The volume of the separator is governed by its production capacity and the physical properties of crude oil (viscosity, temperature, pressure, and gas/oil ratio).
(2) The four-stage separators were designed based on flow rates, with a diameters of 13 ft for the first-stage and 11 ft for the others. To withstand their respective operating pressures and temperatures as follows: 42.2 kg/cm²g at 59.1℃, 13 kg/cm²g at 53.3℃, 4.6 kg/cm²g at 45.6℃, and 2.8 kg/cm2g at 44.2℃, shell thicknesses of 2.3841 in (S-101) and 2.8125 in (S-102 to S-104) were required, while the head thicknesses were 2.340 in (S-101) and 2.3 in (S-102 to S-104).
(3) The fourth stage is considered dispensable. After its removal, the crude oil mass fraction at stream 16 of 4th-stage separator is increased from 0.8944, to 0.9009 at stream 14 of 3rd-stage separator. This was encouraging evidence to adopt the improved model with the changes that have been made to the pressure.
(4) Separation unit performance can be further improved by integrating a stripping column. The designed column achieved an NTU of 5.5, and a packed height closely matching the geometric column height within 4.5% error, demonstrating strong mass transfer efficiency. Its 2.5 m diameter, 778,131 kg shell weight, and very low pressure drop (0.204 inH₂O/ft) further ensure efficient operation and stable flow under standard stripping conditions.
(5) Economic evaluation showed that Case 2 (three-stage separator without stripping tower) realized considerable cost savings, reducing capital, operating, equipment, and installation expenses. Annual capital cost was minimized by \$969,550 compared to the base case Case 1.
(6) Case 3 (three-stage with stripping column) escalated capital and operating costs by \$67,381 annually but improved separation efficiency, particularly under sour service and strict vapor pressure specifications.
(7) The analysis shows a trade-off: Case 2 offers the optimal cost efficiency, while Case 3 is preferable when a higher product quality of crude oil is required.
|
$Q_v$ |
volumetric flow rate of vapour, ft3/s |
|
$Q_{H L}$ |
volumetric flow rate of water, ft3/min |
|
$Q_{L L}$ |
volumetric flow rate of crude oil, ft3/min |
|
$\rho_L$ |
density of crude oil, lb/ft3 |
|
$\rho_V$ |
density of vapour, lb/ft3 |
|
$k$ |
separator constant |
|
$U_T$ |
settling velocity, ft/s |
|
$U_V$ |
vapour velocity, ft/s |
|
$U_{H L}$ |
settling velocity of the heavy liquid out of the light liquid phase, in/min |
|
$U_{L H}$ |
settling velocity of the light liquid out of the heavy liquid phase, in/min |
|
$L$ |
total length of separator, ft |
|
$L_1$ |
liquid/liquid compartment length, ft |
|
$L_2$ |
light liquid/ heavy liquid compartment length, ft |
|
$A_T$ |
total cross section area, ft2 |
|
$A_V$ |
vapour cross section area, ft2 |
|
$A_{L L L}$ |
light liquid above the bottom of the vessel cross section area, ft2 |
|
$A_{H L}$ |
water cross section area, ft2 |
|
$A_{L L}$ |
crude oil cross section area (ft2) |
|
$V_H$ |
holdup volume (ft3) |
|
$V_S$ |
surge volume (ft3) |
|
$t_{L H}$ |
settling times of the heavy liquid out of the light liquid phase (min) |
|
$t_{H L}$ |
settling times the light liquid out of the heavy liquid phase (min) |
|
$H_{L L L}$ |
low liquid level height (ft) |
|
$H_W$ |
weir height (ft) |
|
$H_V$ |
vapour space height (ft) |
|
$E$ |
joint efficiency |
|
$P$ |
operating pressure (psi) |
|
$S$ |
allowable stress (psi) |
|
$t_c$ |
corrosion allowance (in) |
|
$G$ |
mass flowrate of sweet gas (kg/s) |
|
$G^{\prime}$ |
mass flux of gas (kg/m2.s) |
|
$\mu_r$ |
relation between light liquid viscosity at the packing bed temperature and viscosity of the water at reference temperature of 20℃. |
|
$a_P$ |
specific surface area of the packing (m2 / m3) |
|
$x_1$ |
mole fraction of solute contents at liquid inlet stream |
|
$x_2$ |
mole fraction solute contents at liquid exit stream |
|
$y_1$ |
mole fraction solute contents of gas at bottom |
|
$f$ |
design stress (N/mm2) |
|
$J$ |
joint efficiency |
|
$C$ |
corrosion allowance (mm) |
|
$\rho_m$ |
material density (kg/m3) |
|
$h_o$ |
outer height of head from the base to the crown (mm) |
|
$h_i$ |
inner height of head (mm) |
[1] Wauquier, J.P. (1995). Petroleum Refining: Crude Oil, Petroleum Products, Process Flowsheets (Vol. 1). Editions Technip.
[2] Mehdi, A. (2021). The second split: Basrah Medium and the challenge of Iraqi crude quality. The Oxford Institute for Energy Studies. https://www.oxfordenergy.org/publications/the-second-split-basrah-medium-and-the-challenge-of-iraqi-crude-quality.
[3] Awadh, S.M., Al-Auweidy, M.R., Al-Yaseri, A.A. (2019). Hydrochemistry as a tool for interpreting brine origin and chemical equilibrium in oilfields: Zubair reservoir southern Iraq case study. Applied Water Science, 9(3): 65. https://doi.org/10.1007/s13201-019-0944-6
[4] Neamah A.I. (2014). Separation of the petroleum system. The Hilltop Review, 7(1): 11. http://scholarworks.wmich.edu/hilltopreview/vol7/iss1/11.
[5] Devold, H. (2013). Oil and Gas Production Handbook: An Introduction to Oil and Gas Production. Lulu. com.
[6] Ahmed, T.H. (2010). Reservoir Engineering Handbook. Gulf Professional Publishing.
[7] Sivalls C.R. (2009). Oil and Gas Separation Design Manual. Odessa (TX): Sivalls Inc. https://www.sivalls.com/design-manuals.
[8] Mahsakazemi (2011). Optimization of oil and gas multi stage separators pressure to increase stock tank oil. Oriental Journal of Chemistry, 27(4): 1503-1508. https://www.orientjchem.org/vol27no4/optimization-of-oil-and-gas-multi-stage-separators-pressure-to-increase-stock-tank-oil.
[9] Mahmoud, M., Tariq, Z., Kamal, M.S., Al-Naser, M. (2019). Intelligent prediction of optimum separation parameters in the multistage crude oil production facilities. Journal of Petroleum Exploration and Production Technology, 9(4): 2979-2995. https://doi.org/10.1007/s13202-019-0698-6
[10] Moazami Goodarzi, A., Darvish Sarvestani, A., Hadipour, A. (2020). A novel approach to obtaining the optimum pressure and stages of separators. Iranian Journal of Oil and Gas Science and Technology, 9(1): 33-46. https://doi.org/10.22050/ijogst.2019.153012.1480
[11] Al-Zubaidy, G.M. (2022). Determining optimum oil separator size and optimum operating pressure. Iraqi Journal of Chemical and Petroleum Engineering, 23(2): 43-46. https://doi.org/10.31699/IJCPE.2022.2.6
[12] Kotb, M., Abdelalim, G., Abdall, S. (2024). Optimization of oil-gas separation in the production stations at abo-Sannan field: Case study. Improved Oil and Gas Recovery, 8: 1-12. https://doi.org/10.14800/IOGR.1263
[13] Stewart, M., Arnold, K. E. (2011). Surface Production Operations, Volume 1: Design of Oil Handling Systems and Facilities (Vol. 1). Elsevier.
[14] Carlson, E.C. (1996). Don't gamble with physical properties for simulations. Chemical Engineering Progress, 92(10): 35-46.
[15] Sinnott, R.K. (2005). Chemical Engineering Design, vol. 6. EL
[16] Ibrahim Abduljabbar, M., Ghafouri Taleghani, H., Esmaili Paeen Afrakoti, I. (2024). Simulation and optimization of gas sweetening plant of Iraq Majnoon Refinery. Iranica Journal of Energy & Environment, 15(1): 21-37. https://doi.org/10.5829/ijee.2024.15.01.03
[17] Monnery, W.D., Svrcek, W.Y. (1994). Successfully specify three-phase separators. Chemical Engineering Progress, 90: 29-29.
[18] Branan, C. (2002). Rules of Thumb for Chemical Engineers. Elsevier.
[19] Markoš, J. (Ed.). (2011). Mass Transfer in Chemical Engineering Processes. BoD–Books on Demand.
[20] Anantharaman, N., Begum, K.M.S. (2011). Mass Transfer: Theory and Practice. PHI Learning Pvt. Ltd.