Ghassan Abdulameer Habeeb![]() | Ameer Abed Jaddoa*
| Ameer Abed Jaddoa*![]() | Jafaar Mohammed Daif Alkhasraji
| Jafaar Mohammed Daif Alkhasraji![]()
© 2025 The authors. This article is published by IIETA and is licensed under the CC BY 4.0 license (http://creativecommons.org/licenses/by/4.0/).
OPEN ACCESS
Improving the heat transfer rate and thermal performance of a solar air heater necessitates increasing the thermal exchange between the fluid and the absorber. In this research, spherical obstacles were used, fixed on the bottom plate inside the duct with dimensions of 150×75×30 cm, which raised the exit temperature of air passing through the duct. The experimental work consists of five scenarios executed during sunny days in Iraq/Baghdad for an optimum result. These scenarios from “A” to “E” included different positions of baffles inside the SAH, plus the empty one. A comparison between scenarios under the same conditions and boundaries is achieved, aiming for the optimal case. The mass flow (MF) rate range was from 0.02 to 0.05 kg/s, and the Re range was from 3000 to 10000. The other aim of the comparison was to maximize the Nu and minimize the friction factor (ff). Thermal efficiency is evaluated by analyzing heat losses from convection with the surrounding air and long-wave radiative exchange with the atmosphere. Case A demonstrated a Nu was 32 in the context of the same Reynolds number (Re), which is notably minimal. The maximum observed increases in Nusselt numbers were 62%, 54%, 50%, and 41% for Cases E, C, D, and B, respectively, when compared to Case A at Re = 10000. The evaluation of thermal efficiency involved analyzing heat loss attributed to convection with the external air and long-wave radiative exchange with the sky. An elevated Re is associated with enhanced thermal efficiency. This best case was scenario E (100% obstruction situation) where the Nu was 85, the fraction factor was 0.085, and the thermal efficiency was 93%. It is concluded from this that the barriers have improved the performance of the heater as expected.
experimental solar air collector, absorber surface, spherical obstacles, friction factor
Global population growth and the intensified energy consumption associated with modern life and industrial activities have contributed to the increase in energy demand over the past thirty years. The growing dependence on conventional energy sources, including fossil fuels, has a considerable effect on pollution rates, global warming, and energy costs. Recognized for its sustainability as a renewable energy source, solar energy has emerged as a crucial focus of research to address these impacts. This energy source stands out due to its significant contribution to green energy and its cost-free and sustainable nature [1, 2]. Recent studies indicate that system development focused on improving thermal energy conversion performance is a critical research area with a wide range of advantageous applications worldwide [3]. Fins, baffles, and turbulators, which also promote turbulence, Jaddoa [4] can increase the surface area of heat exchange and enhance energy efficiency in industrial product development processes [5]. Utilizing thermal fluids with enhanced thermophysical properties, such as nanofluids, represents an alternative method to enhance efficiency. Due to their improved thermal conductivity and capacity, heat transfer (HT) applications have utilized nanofluids as substitutes for conventional fluids [6, 7].
The utilization of these materials in HT applications is common, as they significantly improve the energy efficiency of a range of devices [8]. Different types of thermal solar collectors can be employed to transform solar radiation into thermal energy for the purposes of heating and cooling [9]. Solar air heaters (SAHs) function as systems that transform solar energy into thermal energy, generating heated air for use in residential heating or agricultural drying applications [10]. Solar air heaters (SAHs) stand out due to their economical production costs, simple design, and lack of associated health and environmental risks [11]. The devices come in a range of designs, classified based on airflow into single-pass or double-pass categories. A significant number of researchers have explored the improvement of thermal performance in heat systems through the use of fins, baffles, and turbulators [12]. Researchers carried out experiments to examine the friction characteristics and HT in surface-modified solar air heaters under laminar flow conditions [13]. They employed a V-corrugated absorber plate with a roughened texture and a rectangular duct featuring a roughened inner surface [14]. The findings indicate that the redesigned absorber plate exhibits an increased heat transfer rate and elevated friction loss [15].
Researchers investigated the impact of irradiance and air volume flow rate on a modified solar air heater featuring a folded spoiler on the absorber plate [16]. The upgraded solar air heater demonstrates superior efficiency compared to the older model. Furthermore, researchers conducted an experimental study to assess the impact of external mirrors and aluminum can tabulators on the efficiency of a single-pass solar air heater [17]. The evaluation included three distinct absorber plate designs: the smooth plate, the can-line roughened plate, and the staggered-can roughened plate [18]. Each of the three designs incorporated air guide valves within the intake system [19]. A 73% improvement in efficiency was observed. The researchers examined the impact of winglet pairs on the efficiency of an SAH [20]. The variables examined included winglet height, angle of attack, and chord length. An analysis of the measured variables indicated that the ff exhibits greater sensitivity than the Nu [21]. Research has explored the application of a thin layer of porous media on the absorber plate of a solar air heater (SAH) [22]. The thermal performance improved by 500%, while friction loss increased by 2000% as a result of the thin porous layer [23]. For testing the effectiveness of a tubular solar heater (TSAH) with an absorber made up of a pattern of adjacent tubes [24], an experiment was carried out. The findings indicate that the redesigned tubular solar heater exhibits a 13℃ increase in efficiency compared to the conventional solar air heater, resulting in a corresponding rise in air temperature of 13℃ [25]. A SAH was constructed with intervals between S-shaped ribs. In this context, roughened surface area significantly improved thermal efficiency, as indicated by the data [26]. References [27] present experimental results on the thermal performance of roughened, arc-shaped solar air heaters with apex-up and apex-down airflow. Airflow rates in the trials ranged from 0.007 to 0.022 kg/s. At a mass flow rate of 0.022 kg/s, the findings indicated that efficiency increased with higher airflow rates, achieving 73.2% at the upstream flow apex and 69.4% at the downstream flow apex [28]. Furthermore, Olia et al. [29] outlined a comparison between the performance of two triple-pass SAHs. In the first type, there is a double glass cover; in the second, there is a network of tubes under the absorber plate. With efficiencies of 80.2% and 73.4%, respectively, the first model outperforms the second model according to the data. Researchers examined the impact of perforated delta-shaped baffles on solar air heater (SAH) efficiency [30, 31]. In this vein, baffles increased heat transmission efficiency, as shown by the results. The perforated designs demonstrated the highest thermal enhancement factor (TEF) values at 2.26, while non-perforated layouts displayed TEF values as high as 2.21 [32]. This study presents a numerical analysis of solar air heater (SAH) performance, focusing on the impacts of a roughened absorber plate with rectangular, triangular, and elliptical fins at various inclination degrees [33], as described in the study of Duffie and Beckman [34]. The results showed that compared to circular and triangular fins [35], rectangular ones are 12.5% and 5.5% more efficient, respectively, for SAH [36]. We found that an angle between 50 and 70 degrees worked best. Researchers conducted an experimental study to compare the efficiency of a solar air heater with and without perforated C-shaped fins [37]. The results show that using perforated fins increases the heat transfer rate by 2.67 times. Nanofluids' potential impact on solar air heaters (SAHs) has been the subject of much study [38, 39]. In parabolic trough collectors (PTCs), researchers looked at how the amount of the base fluid affected thermal performance and entropy generation [40, 41]. Research showed that nanofluids increase thermal efficiency and heat transmission while minimizing entropy formation. The behavior of the nanofluid in a solar heating channel with a rough rib on the absorber plate was studied and evaluated using the second law of thermodynamics. The study examined friction, the impact of nanofluid concentration on thermal reflections (Re), angle, height, and the quantity of ribs applied to the absorbent plate [42]. The findings showed that a concentration of 0.04 nanofluids reduced thermal entropy generation by about 11.1%. Furthermore, at Re=3200, an increase in rib height between 0.025 and 0.033 reduced thermal entropy generation by about 21.05% [43]. Researchers conducted a study on pulsed flow in a three-dimensional channel, examining both turbulent and laminar flows within the channel [44]. Researchers studied the impacts of various transverse channel shapes, such as triangles, hexagons, and circles, under pulsed flow conditions [45]. To study the effects on pressure, velocity, and temperature, alumina nanofluids (Al₂O₃) were used as a working fluid at different concentrations (0 percent (clean water), 3 percent, and 5 percent). The results showed that the amount of energy provided by Al2O3 remains constant regardless of the percentage of liquid in the total volume [46].
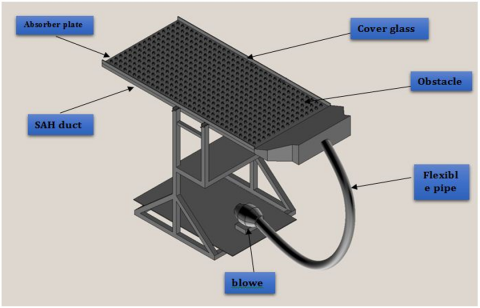
The literature review uncovered a plethora of research efforts aimed at improving solar air heater performance. Despite all the published research and publications, there remains room for improvement in the effectiveness of solar air heaters to better suit the local weather conditions in Baghdad, Iraq. Because of its many potential uses and its contribution to lowering greenhouse gas emissions, this study is highly significant. Thus, this paper's objective is to study how spherical obstructions and inlet air velocity affect the solar air heater's efficiency. To achieve this, we conducted a series of experiments under clear sky conditions for numerous days in 2023, from February to May. For ten hours each day, data was collected hourly. The measured air velocities ranged from 0.02 to 0.05 kg/s. Additionally, the key focuses of current research are the efficiency of solar thermal processes and the enhancement of output temperature. The aim of this research was to develop novel designs that integrate components illustrated in Figures 1, 2, and 3, including a perforated plate, wire mesh packing, an absorber plate, and a double-pass unglazed transpired collector. To improve thermal performance, this study added wire mesh layers, a perforated absorber plate, and a double-pass counterflow collector to the duct, which made the absorbing area much bigger. The ecologically responsible double-pass counterflow collector performs two main functions: it enhances heat transfer to the airstream in the upper channel and extends the air pathway to optimize heat absorption while reducing heat loss to the environment.
This paper is structured as follows: Section 2 experimental work. Section 3 absorber plate and obstacles, it was clarify the model design approach used in this study shows. Section 4 experimental measurement and analysis presents the theoretical foundations and related work. Section 5 discusses experimental results. Finally, section 6 highlights the challenges, conclusions, and future work.
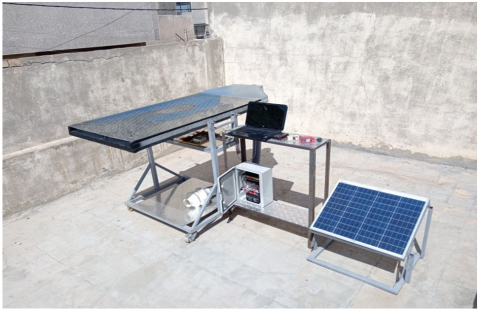
The solar air heater device used in the experimental process is shown in Figures 1 and 2. This device has been designed and built to investigate the effect of spherical obstacle roughness elements on the HT and fluid flow characteristics within a duct used in solar air heaters, as well as the effect of obstacle position and quantity. The device comprises a horizontal rectangular duct measuring 150 cm in length, 80 cm in width, and 30 cm in height. It also incorporates an artificial obstacle, designed as a ball with a diameter of 2.5 cm, which is distributed on the absorber plate. A cover glass is used to encase the topside of the duct, and a wooden frame is put inside with isolation fixed on the bottom side of the absorber. For forced air flow, a blower was used on the section side, which was generated by the PV panel. Moreover, temperatures were measured by thermocouples fixed inside the duct and connected to an Arduino (digital measurement) for more accuracy. It is worth mentioning that the device of the new SAH was constructed locally in Baghdad, Iraq. The outdoor experiment was performed in Baghdad, as shown in Table 1, and the experiment was conducted outdoors at 33° N and 44° E on four cloudless days on 20/02/2024, 25/03/2024, 07/04/2024, and 12/05/2024. The experiment was carried out for five study cases, each with a different arrangement of spherical obstructions inside the SAH duct. All the important parameters were then measured and written down, such as temperatures, MF rate, solar radiation, and other parameters, such as the local HT coefficient. Nu, Rynold, ff.
Table 1. Explanation of equipment
|
Device |
Description |
|
Obstacles |
The SAH applied black paint to the absorber plate and utilized spherical barriers of 2.5 cm in diameter and 0.1 cm in thickness, positioned 5 cm apart from center to center. All 496 spherical obstructions were systematically organized into 32 rows, each including either 16 or 15 columns |
|
Cover glass |
Acrylic glass 0.3 cm thickness and 89% transmittance |
|
Blower |
Size (in) 4, Voltage (v) 220, Power (w) 40, Speed (r/min) 2550, Current 0.14 (A) |
|
PV panel |
Max power 50, Max Voltage (v) 18, Max Current (A) 2.78, Short circuit current (A) 2.97, Open circuit voltage (v) 22 |
|
Arduino |
An advanced thermocouple-to-digital converter, the Arduino has an analog-to-digital converter (ADC). Along with digital control, related control logic, and cold-junction compensation monitoring and correction, the Arduino also has an SPI-compatible interface. An Arduino's signal-conditioning circuitry transforms the voltage from the thermocouple into a form that can be read by the ADC. It is possible to reduce the impact of noise errors introduced by the thermocouple wires by connecting the T+ and T-inputs to internal circuitry. Engineers put a premium on ease of use while designing the software and hardware that make up the open-source electronics platform Arduino. Arduino has been integrated into a wide range of activities and software. An 18-port Arduino was initially connected to a computer in order to record the pressure differential and temperature fluctuations between the solar air heater duct's entrance |
|
Pyrometer |
Solar irradiance is the power received from the sun as electromagnetic radiation. This power is concentrated in a certain surface area. Solar irradiance is often quantified in watts per square meter (W/m²), the prevailing unit of measurement in use. Employing the solar irradiance measurement device (Protek DM-301) used in this study enables a thorough understanding of the solar power received per square meter of a designated surface area |
|
Thermocouples |
A total of twelve thermocouples are installed: two at each inlet and exit point, and two at each absorber and air flow point within the duct, utilizing type K thermocouples |
|
Anemometer |
We employed the UT363BT, a compact anemometer and thermometer, during our experiment. Wind speed can be quantified up to 30 meters per second. The subsequent stage is to ascertain the mass flow rate utilizing the velocity value as the foundation |
Figure 1. Schematic assembly of the SAH
Figure 2. Assembly of the SAH
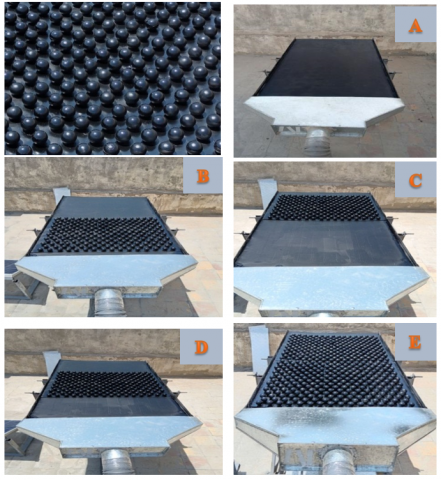
The absorbent plate, which plays a crucial role in converting solar energy into thermal energy, requires a material with a high absorption rate, such as aluminum, copper, steel alloy, or carbon steel, as depicted in Figure 3. In this experiment, an aluminum plate with dimensions of 150*80*3 cm and a 0.3 cm thickness painted with black color was used. Employing a roughening method with various designs and shapes can enhance the HT rate. The spherical obstacles employed in this SAH were 2.5 cm in diameter and 0.1 cm in thickness, distributed on the absorber plate in 5 cm spacing (center to center) and painted black. The total number of spherical obstacles was 496, with 32 rows and 16 or 15 columns.
Figure 3. The spherical obstacles
In each experiment, the heat absorbed by the hot air is measured. It is assumed that the heat used by the heater and the heat absorbed by the hot air will be nearly identical.
$Q_{{air }}=Q_{{obserbor }}$ (1)
The important parameter for HT, the fluid mean temperature (Tm) and coefficient of local heat transfer (hx) [22].
$O x=h x(T w, m-T m)$ (2)
The vector quantities Tm comprise the heat flux Qx, the wall mean temperature Tw, and the temperature difference Tw. Heat transfer occurs from the wall to the fluid, resulting in a consistent decrease in temperature from the wall to the fluid. The average circumferential and axial heat transfer coefficient can be determined using the following expression [22].
$h x=\frac{1}{x} \int_0^x h x \ d x$ (3)
When fluid traverses a non-circular channel, the heat transfer relationships must be predicated on the hydraulic diameter Dh. This must be utilised to determine the Nusselt and Reynolds values, as well as the friction coefficient for the Reynolds analogy [20].
$\mathbf{D h}=\frac{\mathbf{2 a b}}{\mathbf{a}+\mathbf{b}}$ (4)
The Nu quantifies the augmentation of HT through a fluid layer due to convection in comparison to conduction within the same fluid layer [21]. A refined version of the modified Colburn equation can derive the Nu.
$\mathrm{Nu}=0.023 \mathrm{Re}^{0.8} \mathrm{Pr}^{0.4}$ (5)
The relative thickness of the velocity and thermal boundary layers is most effectively characterized by the dimensionless parameter known as the Prandtl number [18].
The Re is the ratio of inertia force to viscous force obtained by:
$\mathbf{R e}=\frac{\rho \mathbf{v} \mathbf{D h}}{\mu}$ (6)
At elevated Re, the inertial force, which is related to the fluid's density and velocity, predominates over viscous forces, rendering it challenging for the viscous forces to mitigate the fast and chaotic fluctuations of the fluid. On the contrary, with low Re, viscous forces sufficiently counterbalance inertial forces, preserving the fluid's ordered motion. Consequently, the flow is turbulent in the former case and laminar in the later. ff in the duct is determined using equation:
$ff=0.79 R e^{-0.2}$ (7)
All the result of (temperature, MF rate, pressure drop and solar radiation) was recorded in Baghdad for four days 20/2/2024, 25/3/2024, 7/4/2024 and 12/5/2024 by measuring device and Arduino, recording was done every hour from 9:00 am to 17:00 pm for all cases and with a constant and different MF rate from 0.02, 0.03, 0.04 and 0.05 kg/s. Absorber plate and air temperature measured by the thermocouple which is fixed along the duct separated with equal distance (0.25 m) in X-direction in addition to inlet and outlet points also, solar radiation on the SAH duct, MF rate. Table 2 is uncertainty for measurement device used in this study.
Table 2. Uncertainty of the measuring instrument
|
Measurement Device |
Unit |
Range |
Uncertainty |
|
Solar meter |
W/m2 |
0 to1999 |
$\pm$0.1 W/m2 |
|
Anemometer |
m/s |
0 to 30 |
$\pm$0.5% |
|
Manometer |
hpa |
0 to150 |
0.1 hpa |
|
Thermocouple type K |
C |
-40 to -1300 |
0.25℃ |
5.1 Temperature distribution
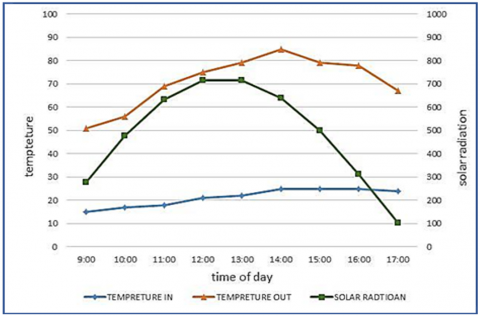
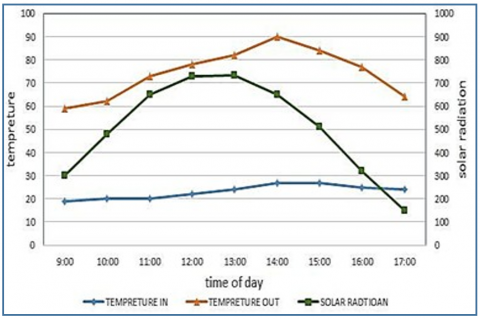
This section delineates the solar air heater and outlines the five examined cases: whole roughed duct (Case A), first half roughed duct (Case B), middle half roughed duct (Case C), end half roughed duct (Case D), and empty roughed duct (Case E). Furthermore, it has delineated the protocol for the experimental technique. The evolution of the measurable parameter for our experimental investigation has been conducted in accordance with the recommendations for testing system operation. In this context, the measurement devices and their associated uncertainties guarantee the reliability of the measured parameters. The experimental findings indicated that the roughened cases surpass the smooth ones in efficiency. Furthermore, compared to smooth ducts, roughed casings demonstrate superior reliability in enhancing heat exchange within the solar air heater. The experimental results were plotted for various days from the four months of February, March, April, and May, from 8:00 pm to 17:00 am. The current study employs a variety of solar air heater models, including full roughed ducts, first half roughed ducts, middle half roughed ducts, end half roughed ducts, and empty roughed ducts, across a range of Re=3000, 4500, 6000, 75000, and 10000. The presentation of experimental results using temperature, nu, ff, and thermal efficiency was performed from February to May 2023. The study compares five configurations under climatic conditions in a rough duct. For each scenario, 30-minute intervals of fixed and variable MF rates of 0.01, 0.02, 0.03, 0.04, and 0.05 kg/s were used to record all the settings that were known, such as solar radiation, temperatures, pressure drop, and energy use. On the days that were studied, the mass flow rate (MF) was 0.02 kg/s, and the solar radiation values, as well as the inlet and outlet temperatures for case A (a smooth duct) and other cases with obstructions in the duct, changed depending on the weather (Figures 4 and 5). In the cases that were analyzed, maximum solar radiation levels of 715, 733, 542, and 554 W/m² were recorded on February 20, 2024, March 25, 2024, April 7, 2024, and May 12, 2024, respectively. The data show that temperatures increased steadily with the increment in solar energy, peaking between 13:00 and 14:00. The duct achieved an exit temperature of 85℃ on February 20th, with a Re of 3000. So, we checked the important factors for our study, such as the temperature of the air at the intake and outlet, which were at right angles to the flow direction, and the temperature of the absorber and bottom plates four times. The radiation from the sun on the inclined collection surface, electric power consumption of the blower, and the mass flow rate were monitored. The results showed that the hourly variations of the measured outlet temperatures increased from a temperature of 50℃ at 9:00 to the maximum value of 85℃ at 14:00 and then decreased to 69℃ at 17:00. The inlet temperatures increased from 15℃ at 9:00 to the maximum value of 25℃ at 14:00 and then reduced to the lowest value of 24℃ at 17:00. Also, the measured solar radiation raised from 278 W/m² at 9:00 pm to the maximum value of 713 W/m² at 13:00 pm and then decreased to 101 W/m² at 17:00 pm. The temperatures of various compounds rise over time in response to increasing solar radiation, reaching their peak values between 12:00 and 13:00, as illustrated in Figures 4-7.
Figure 4. Solar radiation and time of day were associated with input and exit temperatures at an MF rate of m=0.02 kg/s (20/02/2024)
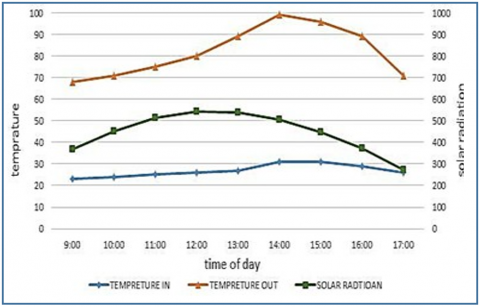
Figure 5. Inlet and output temperatures were related to solar radiation versus time of day with MF rate m=0.02 kg/s (25/03/2024)
Figure 6. Inlet and output temperatures were related to solar radiation versus time of day with MF rate m=0.02 kg/s (07/04/2024)
Figure 7. The relationship between inlet and output temperatures was analysed in relation to solar radiation as a function of time of day for a mass flow rate of 0.02 kg/s on December 5, 2024
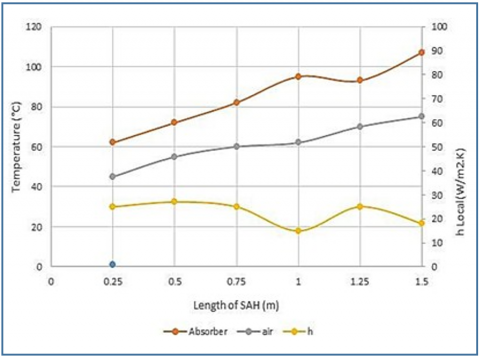
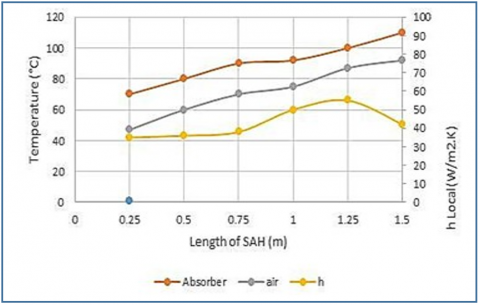
The hx coefficient demonstrates the considerable impact of obstacles and their varying positions on the temperatures of the absorber plate and air in the analyzed scenarios. Figure 8 illustrates the relationship between the temperatures of the absorber and air, using the hx coefficient along the duct for an air MF rate of 0.02 kg/s. The hx coefficient decreases, reaching its minimum value at a distance of 1 m, as the temperature increases, and vice versa. The results showed that the absorber temperature increased from 62℃ to 107℃ by a percent of 72% for the absorber and increased from 45 to 75℃ by a percent of 66% for the air side.
Figure 8. The values of air and absorber temperatures were related to the HT coefficient according to the length of case A at $\dot{m}$=0.02 kg/s
Case B is shown in Figure 9, which demonstrates how the temperatures of the absorber and the air change with the hx coefficient along the duct when the air flow rate is 0.02 kg/s. In this regard, the obstacles at the top of the duct create two as shown in Figure 9. Initially, the hx coefficient exhibits the same behavior as in case A, which is a decrease. However, after a distance of 1 m, the hx coefficient in the obstacle area changes to an increase in the x-direction of the duct, a clear indication of the effect of roughness. The figure indicated that the absorber plate's temperature increased from 62 to 92℃ by 29%.
Figure 9. The values of air and absorber temperatures were related to the hx coefficient according to the length of case C at $\dot{m}$=0.02 kg/s
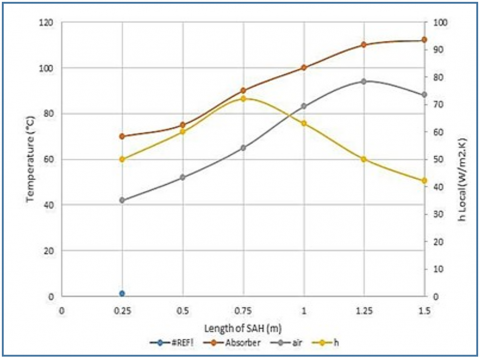
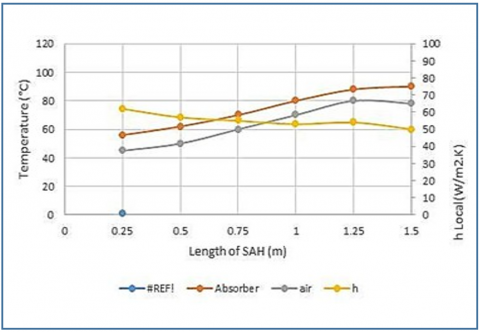
Figure 10 illustrates case D, demonstrating the impact of placing obstacles in the center of the duct on the temperature relationship between the absorber and air, as measured by the hx coefficient, at an air MF rate of 0.02 kg/s. The hx coefficient slightly increased at the beginning of the obstacles area, reaching a peak value at a distance of 1.25 m. After that, the value steadily decreased until the end of the duct, when the temperature difference between the absorber and air reached its maximum. The figure concluded that the temperature of the air increased by 95%, from 47 to 92℃.
Figure 10. The values of air and absorber temperatures were related to the hx coefficient according to the length of case D at $\dot{m}$=0.02 kg/s
In case E, as depicted in Figure 11, there are numerous obstacles from the inlet to the outlet of the duct. The values of the hx coefficient, the absorber's temperature, and the air's temperature show a gradual decrease in the hx coefficient until the end of the air duct, while the temperature difference between the absorber and air increases gradually. According to the figures from 5.5 to 5.9, it was recognized that the value of the hx coefficient increases in the baffled area case (B, C, D, E) and decreases in the smooth case (case A).
Figure 11. The values of air and absorber temperatures were related to the hx coefficient according to the length of case E at $\dot{m}$=0.02 kg/s
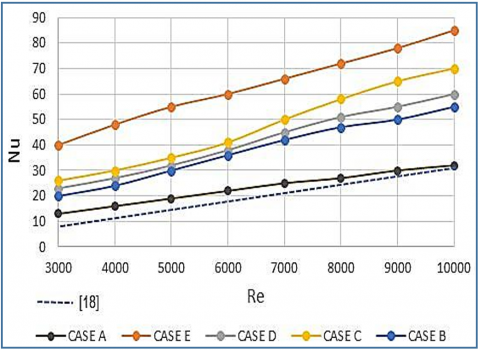
5.2 Nusselt number (Nu)
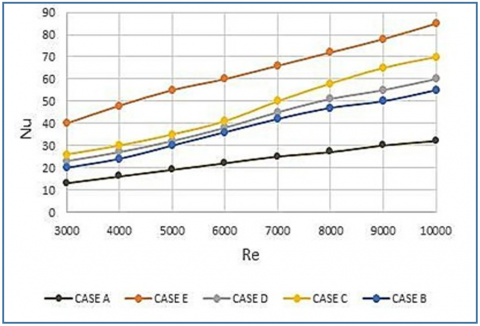
Figure 12 demonstrates that the Nu values for scenarios involving rough surfaces are considerably higher than those for scenarios with smooth surfaces when evaluated at the same Re. The vorticity generated by the primary flow causes mixing and interferes with the thermal boundary layer. Case E demonstrates the highest average Nu value when compared to the other roughened cases, featuring baffles distributed throughout the air channel ("100%"). Creating a greater disturbance than the rest of the cases, and due to this great disturbance, Nu was the highest. In this scenario, a reduced number of dead zones is observed compared to other situations, and the improved mixing promotes the transfer of heat from the heated absorber plate to the fluid, especially the air. In scenario B, where the baffles were located in the upper section of the SAH duct and demonstrated a higher number of dead zones compared to other scenarios, the Nusselt number values were the lowest. The highest recorded Nusselt number (Nu) was 85, occurring at a Re of 10,000 in case E. In scenario C, the Nusselt number (Nu) was measured at 70 under identical Re conditions, whereas scenarios D and B exhibited Nusselt values of 60 and 55, respectively, at a Re of 10,000. The Nusselt number reached a minimum value of 32 for case A at the corresponding Re. The maximum enhancement in the Nusselt number was observed to be 62%, 54%, 50%, and 41% for Case E, Case C, Case D, and Case B, respectively, in comparison to Case A at a Re of 10,000.
Figure 12. Variation in Nu with Re for all cases
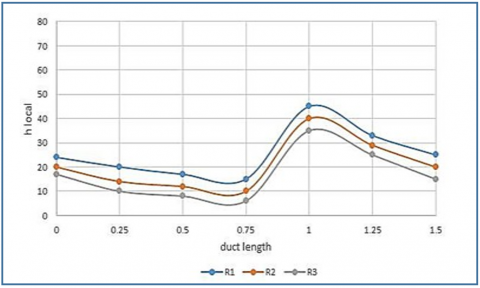
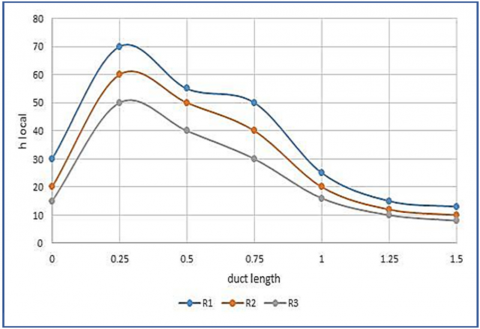
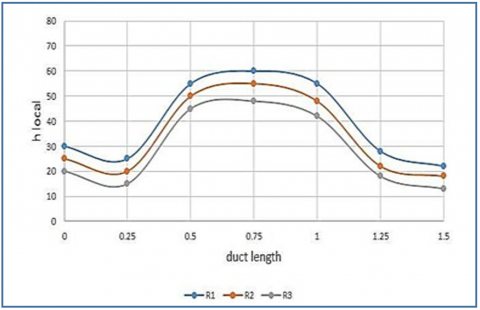
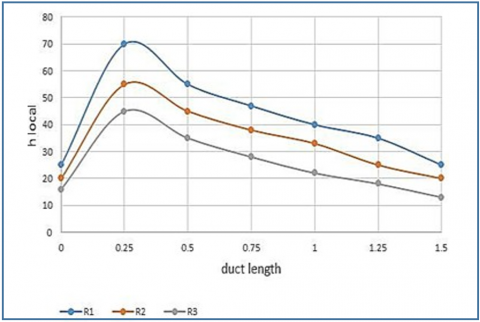
Figures 13 to 16 illustrate the influence of the Re on the local convective heat transfer coefficient across all baffled scenarios. In Case B, the baffles are positioned at the top of the SAH duct, and Figure 13 illustrates the relationship between the local convective heat transfer coefficient and duct length. The hx initiates at a low level in the initial smooth section, due to the regular flow, as there are no obstacles that affect the flow disorder, then experiences a sharp increase at the onset of the roughened area, specifically at the location of the baffles, Because of the significant increase in the flow disorder due to the presence of obstacles, thus improving heat transmission. followed by a swift decline until the boundary of this region, as the flow begins to restore its nature. In Case C, a similar behavior is noted; however, the position of the highest hx shifts to the first half of the air channel due to the arrangement of the baffles shown in Figure 14. Figure 15 depicts the hx of Case D in relation to the baffles situated in the center of the air channel. The curve shows a minimum after the initial baffle, a maximum in the baffled region, and a sudden decrease at the end of this area. This indicates that the airflow passes through a strong turmoil that improves heat transfer in the barrier area. However, as soon as this area is crossed, a sudden decrease in HX occurs towards the end of the channel, which reflects the stability of the flow and the low -minded effect caused by the barriers. Figure 16 illustrates the local convective heat transfer coefficient (hx) for Case E. This case exhibits a higher heat transfer coefficient than the other cases, attributed to the arrangement of the baffles. The heat transfer coefficient rises at the initial baffle and gradually declines toward the duct's end, displaying consistent peaks throughout.
Figure 13. The relationship between the local convective HT coefficient and the length of SAH for Case B at various Reynolds values
Figure 14. The correlation between the local convective heat transfer coefficient and the length of the surface area heat transfer (SAH) for Case C, as evaluated at different Reynolds levels
Figure 15. The local convective HT coefficient versus the length of SAH for Case D at different Re
Figure 16. The relationship between the local convective HT coefficient and the length of SAH for Case E at various Reynolds values
5.3 Thermal efficiency
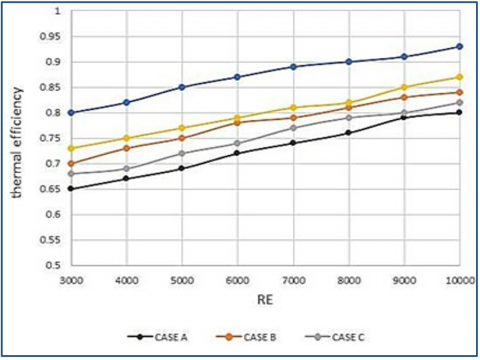
Figure 17 depicts the correlation between the Re and thermal efficiency across various SAH scenarios. With an increase in Re, there is a corresponding increase in thermal efficiency, independent of the context. The findings of this study indicate that the presence of baffles enhances thermal efficiency, especially in case E (100%). This is followed by case B (50% up), case D (50% middle), and case C (50% down), consecutively, while the lowest value is related to case A. Heat losses increase with the absorber's higher surface temperatures, which is the underlying cause of this phenomenon.
Figure 17. The Re in relation to the projected thermal efficiency
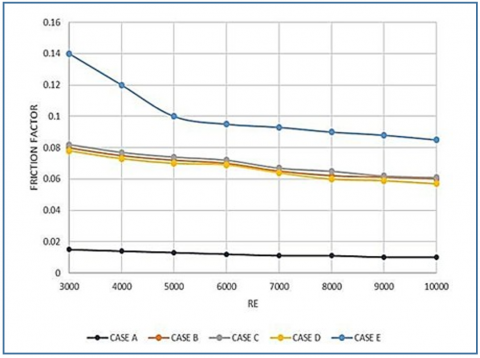
5.4 Friction factor (ff)
Figure 18 illustrates the variation in relation to Re for each of the examined examples. The observed decrease in ff with increasing Re suggests an inverse relationship between the two variables. The graph illustrates that the curves progressively converge to a constant value. Case E exhibited the highest ff value, recorded at 100%. Subsequently, cases B, C, and D exhibited ff values of 50% Up, 50% Down, and 50% Middle, respectively. The smooth channel exhibited the lowest ff value. The baffles and their positioning disrupt fluid flow, leading to an increased pressure drop that consequently affects the flow rate. The maximum ff was obtained at Case E for a maximum value of 0.14 as compared with the other cases at 0.08 at Re = 3000, but as the Re increased, the ff decreased for all cases due to decreasing the friction drag with increasing the air flow rate.
Figure 18. Variation of ff with Re for all cases
5.5 Validation of the experimental procedure
Comparison of the value of the Nusselt number between this study and study of Abdullah et al. [17], Figure 19 at Cases (A smooth) at same Reynolds number, When the Reynolds number values are high, there is a good match between both studies. Still, when the Reynolds number values are low, a difference occurs due to the difference in operating conditions between the two studies, where the study of Abdullah et al. [17] was indoors. Still, in this study the experimental conditions were outdoors between February to May.
Figure 19. Variation in Nusselt number with Reynolds number for all cases
The research examining the enhancement of solar air heater performance identifies two primary forms of artificial roughness, ribs and baffles, which are utilized to increase the efficiency of these heaters. Each category underwent additional classification according to its shapes, sizes, orientations, and arrangements. Previous studies suggest that a comprehensive examination is necessary to determine the positioning of baffles on the bottom plate within the air channel of solar air heaters. The test apparatus consisted of a solar air heater (SAH) featuring a single pass It contains spherical obstacles distributed on the plate in different proportions, constructed from locally sourced materials in Baghdad, Iraq. The outdoor experiment was performed in Baghdad at 33° N, 44° E, on four cloudless days: 20/02/2024, 25/03/2024, 07/04/2024, and 12/05/2024 outdoors, the tests starting at 9 am and ending at 3 pm. The air temperature in the solar air heater's air channel, derived from experimental findings and the proposed CFD method, has been merged, resulting in an acceptable concordance between the two data sets. The effects of different ball placements on the local convective heat transfer coefficients (Nu and ff) have been examined. Based on the following points, we may summarize the conclusions:
The estimation of thermal efficiency has been conducted by analyzing heat losses due to convection with the external air and long-wave radiant exchange with the sky. It has been observed that thermal efficiency is greater at elevated Re, indicating that efficiency improves with the incorporation of baffles, particularly evident in case E (100% obstacles scenario).
These results show that the distribution of barriers inside the canal directly affects the local gesture transmission factor. Placing barriers in different areas leads to changes in the flow disorder, which affects the rate of heat transmission. The E state shows the best thermal performance, which indicates that the optimal design of the arrangement of barriers can significantly enhance the efficiency of thermal exchange systems.
For future work, we recommend that the experience be repeated under different air conditions to understand more comprehensive performance.
[1] Rashidi, S., Kashefi, M.H., Hormozi, F. (2018). Potential applications of inserts in solar thermal energy systems – A review to identify the gaps and frontier challenges. Solar Energy, 171: 929-952. https://doi.org/10.1016/j.solener.2018.07.017
[2] Gilani, A., Hoseinzadeh, S. (2021). Techno-economic study of compound parabolic collector in solar water heating system in the northern hemisphere. Applied Thermal Engineering, 190: 116756. https://doi.org/10.1016/j.applthermaleng.2021.116756
[3] Rashidi, S., Hormozi, F., Sundén, B., Mahian, O. (2019). Energy saving in thermal energy systems using dimpled surface technology – A review on mechanisms and applications. Applied Energy, 250: 1491-1547. https://doi.org/10.1016/j.apenergy.2019.04.168
[4] Jaddoa, A.A. (2024). An empirical study of the electric solar refrigerator based on Iraqi's environment. AIP Conference Proceedings, 3002(1): 070045. https://doi.org/10.1063/5.0205774
[5] Manikandan, K., Iniyan, S., Goic, R. (2019). Enhancing the optical and thermal efficiency of a parabolic trough collector – a review. Applied Energy, 235: 1524-1540. https://doi.org/10.1016/j.apenergy.2018.11.048
[6] Meng, L., Zhang, W., Quan, D., Shi, G., et al. (2019). From topology optimization design to additive manufacturing: Today’s success and tomorrow’s roadmap. Archives of Computational Methods in Engineering, 27: 805-830. https://doi.org/10.1007/s11831-019-09331-1
[7] Rubbi, F., Habib, K., Tusar, M., Das, L., Rahman, M.T. (2020). Numerical study of heat transfer enhancement of turbulent flow using twisted tape insert fitted with hemispherical extruded surface. International Journal of Heat and Technology, 38(2): 314-320. https://doi.org/10.18280/ijht.380205
[8] Zhao, X.H., E, J.Q., Zhang, Z.Q., Chen, J.W., et al. (2020). A review on heat enhancement in thermal energy conversion and management using Field Synergy Principle. Applied Energy, 257: 113995. https://doi.org/10.1016/j.apenergy.2019.113995
[9] Choi, J., Eastman, J. (1995). Enhancing thermal conductivity of fluids with nanoparticles. ASME International Mechanical Engineering Congress & Exposition, 231: 99-105.
[10] Sms, M., Castro, A. (2014). Nanofluids: Synthesis, Properties and Applications. Nova Science Publishers Inc.
[11] Atia, D.B., Al-Saadi, M.K., Jaddoa, A.A. (2024). Modeling of a domestic hybrid electric/solar water heating system. AIP Conference Proceedings, 3002(1): 070031. https://doi.org/10.1063/5.0206383
[12] Murshed, S., Castro, D. (2017). A critical review of traditional and emerging techniques and fluids for electronics cooling. Renewable and Sustainable Energy Reviews, 78: 821-833. https://doi.org/10.1016/j.rser.2017.04.112
[13] Al-Dulaimi, M., Rasool, A., Hamad, F. (2016). Investigation of impingement heat transfer for air-sand mixture flow. The Canadian Journal of Chemical Engineering, 94(1): 134-141. https://doi.org/10.1002/cjce.22364
[14] Kumar, P., Panchabikesan, K., Deeyoko, L., Ramalingam, V. (2018). Experimental investigation on heat transfer augmentation of solar air heater using shot blasted V-corrugated absorber plate. Renewable Energy, 127: 213-229. https://doi.org/10.1016/j.renene.2018.04.056
[15] Jia, B.G., Liu, F., Wang, D. (2019). Experimental study on the performance of spiral solar air heater. Solar Energy, 182: 16-21. https://doi.org/10.1016/j.solener.2019.02.033
[16] Jaddoa, A.A. (2023). Experimental investigation of heat transfer of supercritical fluid flowing in a tube with twisted tape. Jurnal Teknologi, 85(2): 69-82. https://doi.org/10.11113/jurnalteknologi.v85.18850
[17] Abdullah, A., Amro, M., Younes, M., Omara, Z., Kabeel, A., Essa, F. (2020). Experimental investigation of single pass solar air heater with reflectors and turbulators. Alexandria Engineering Journal, 59: 579-587. https://doi.org/10.1016/j.aej.2020.02.004
[18] Dezan, D., Rocha, A., Ferreira, W. (2020). Parametric sensitivity analysis and optimisation of a solar air heater with multiple rows of longitudinal vortex generators. Applied Energy, 263: 114556. https://doi.org/10.1016/j.apenergy.2020.114556
[19] Jouybari, N., Lundström, T. (2020). Performance improvement of a solar air heater by covering the absorber plate with a thin porous material. Energy, 190: 116437. https://doi.org/10.1016/j.energy.2019.116437
[20] Hassan, H., Abo-Elfadland, S., El-Dosoky, M. (2020). An experimental investigation of the performance of new design of solar air heater (tubular). Renewable Energy, 151: 1055-1066. https://doi.org/10.1016/j.renene.2019.11.112
[21] Jaddoa, A.A., Mahmoud, M., Karema, A.H. (2023). On assessing the effectiveness of hybrid solar collectors scheme in Iraq's environment. Eurasian Physical Technical Journal, 20(2-44): 57-64. https://doi.org/10.31489/2023No2/57-64
[22] Wang, D.J., Liu, J., Liu, Y.F., Wang, Y.Y., Li, B.J., Liu, J.P. (2020). Evaluation of the performance of an improved solar air heater with “S” shaped ribs with gap. Solar Energy, 195: 89-101. https://doi.org/10.1016/j.solener.2019.11.034
[23] Ghritlahrea, H., Sahu, P., Chand, S. (2020). Thermal performance and heat transfer analysis of arc-shaped roughened solar air heater – An experimental study. Solar Energy, 199: 173-182. https://doi.org/10.1016/j.solener.2020.01.068
[24] Yassien, H., Alomar, O., Salih, M. (2020). Performance analysis of triple-pass solar air heater system: Effects of adding a net of tubes below absorber surface. Solar Energy, 207: 813-824. https://doi.org/10.1016/j.solener.2020.07.041
[25] Mahdi, M.M., Jaddoa, A.A., Al Ezzi, A. (2022). Impact of pumping head on a solar pumping system with an optimal PV array configuration: Solar water heater application. Journal of Engineering Science and Technology, 17(3): 2035-2048.
[26] Baissia, M., Brimaa, A., Aouesa, K., Khanniche, R., Moummi, N. (2020). Thermal behavior in a solar air heater channel roughened with delta-shaped vortex generators. Applied Thermal Engineering, 165: 113563. https://doi.org/10.1016/j.applthermaleng.2019.03.134
[27] Hosseini, S., Ramiar, A., Ranjbar, A. (2018). Numerical investigation of natural convection solar air heater with different fins shape. Renewable Energy, 117: 488-500. https://doi.org/10.1016/j.renene.2017.10.052
[28] Saravanan, A., Murugan, M., Sreenivasa Reddy, M., Ranjit, P.S., Elumalai, P.V., Kumar, P., Rama Sree, S. (2021). Thermo-hydraulic performance of a solar air heater with staggered C-shape finned absorber plate. International Journal of Thermal Sciences, 168: 107068. https://doi.org/10.1016/j.ijthermalsci.2021.107068
[29] Olia, H., Torabi, M., Bahiraei, M., Ahmadi, M., Goodarzi, M., Safaei, M. (2019). Application of nanofluids in thermal performance enhancement of parabolic trough solar collector: state-of-the-art. Applied Sciences, 9(3): 1-22. https://doi.org/10.3390/app9030463
[30] Shafi, S.T.A., Al-Saadi, M.K., Jaddoa, A.A. (2025). Optimizing solar air heater performance using perforated V-shaped barriers with varied geometric designs. Frontiers in Heat and Mass Transfer, 23(2): 703-719. https://doi.org/10.32604/fhmt.2025.063118
[31] Rashidi, S., Javadi, P., Esfahani, J. (2019). Second law of thermodynamics analysis for nanofluid turbulent flow inside a solar heater with the ribbed absorber plate. Journal of Thermal Analysis and Calorimetry, 135: 551-563. https://doi.org/10.1007/s10973-018-7164-4
[32] Hoseinzadeh, S., Otaghsara, S., Khatir, M., Heyns, P. (2019). Numerical investigation of thermal pulsating alumina/water nanofluid flow over three different cross-sectional channels. International Journal of Numerical Methods for Heat & Fluid Flow, 30(7): 3721-3735. https://doi.org/10.1108/HFF-09-2019-0671
[33] Puranik, S.M., Ramarao, I., Ravikumar, S.K. (2021). Effect of heat transfer on Newtonian flow between concentric elliptical regions. International Journal of Heat and Technology, 39(3): 1015-1025. https://doi.org/10.18280/ijht.390339
[34] Duffie, J., Beckman, W. (2013). Solar Engineering Thermal Processes. New York: John Wiley & Sons.
[35] Matuszewski, P., Sawicka, M. (2010). Optimization of Solar Air Collector. Aalborg: Aalborg University.
[36] Amraoui, M.A. (2021). Three-dimensional numerical simulation of a flat plate solar collector with double paths. International Journal of Heat and Technology, 39(4): 1087-1096. https://doi.org/10.18280/ijht.390406
[37] Incropera, F., DeWitt, D. (2002). Introduction to Heat Transfer. New York: John Wiley & Sons, Inc.
[38] Jaddoa, A.A., Ekaid, A.L., Al-Sadawi, L. (2020). A numerical study of natural convection in a square cavity with a heated cylinder of different diameters and locations through computational analysis. Journal of Engineering Science and Technology, 15(4): 2472-2491.
[39] Moran, M., Shapiro, H. (2010). Fundamentals of Engineering Thermodynamics (SI Version, 6th ed.). New Delhi: Wiley India (P) Ltd.
[40] Mahdi, M.M., Jaddoa, A.A. (2021). An experimental optimization study of a photovoltaic solar pumping system used for solar domestic hot water system under Iraqi climate. Journal of Thermal Engineering, 7(2): 162-173. https://doi.org/10.18186/thermal.871296
[41] Petela, R. (2010). Engineering Thermodynamics of Thermal Radiation: For Solar Power Utilization. New York: McGraw Hill.
[42] Bejan, A. (2006). Advanced Engineering Thermodynamics. Hoboken: Wiley.
[43] Petela, R. (1964). Exergy of heat radiation. ASME Journal of Heat and Mass Transfer, 86(2): 187-192. https://doi.org/10.1115/1.3687092
[44] Al-Gaheeshi, A.M.R., Rashid, F.L., Eleiwi, M.A., Basem, A. (2023). Thermo-hydraulic analysis of mixed convection in a channel-square enclosure assembly with hemi-sphere source at the bottom. International Journal of Heat and Technology, 41(3): 551-562. https://doi.org/10.18280/ijht.410307
[45] Fadhil, N.A., Al-Dabagh, A.M., Hatem, F.F. (2023). Numerical investigation of heat transfer and pressure drop characteristics in a double pipe heat exchanger with corrugated tubes and rod baffles at various Reynolds numbers. International Journal of Heat and Technology, 41(3): 591-601. https://doi.org/10.18280/ijht.410311
[46] Holman, J. (2010). Heat Transfer. New York: McGraw Hill Higher Education.