Agus Mansur*![]() | Achmad Bauravindah
| Achmad Bauravindah![]()
© 2025 The authors. This article is published by IIETA and is licensed under the CC BY 4.0 license (http://creativecommons.org/licenses/by/4.0/).
OPEN ACCESS
The healthcare business relies heavily on effective blood supply chain management, yet common forecasting models frequently fail to account for all the variables affecting blood demand blood demand. On the one hand, the demand is known to be seasonal, but on the other hand, there are also many unexpected disruptions. This study investigates the use of a Gated Recurrent Unit (GRU) model for time-series forecasting to increase the accuracy and efficiency of blood demand predictions. This study creates a GRU-based forecasting model to reduce inventory shortages and waste using daily blood donation statistics from the Indonesian Red Cross (PMI) in Yogyakarta. The model results in more consistent healthcare delivery. In this study, data preprocessing comprised chronological alignment, normalization, and the improvement of temporal dependency detection using a sliding window approach. The GRU model is better than standard forecasting approaches on the test dataset, with a Mean Absolute Error (MAE) of 0.2033 and a Mean Squared Error (MSE) of 0.0923. The visual and statistical examinations show consistent prediction accuracy. The model can adjust to variations in blood demand, making it useful for enhancing blood supply chain management. This research not only underscores the applicability of deep learning in healthcare logistics but also lays the groundwork for scalable, data-driven solutions in perishable goods supply chains, promising enhanced resource allocation, reduced waste, and improved preparedness in healthcare settings.
blood supply chain, forecasting, Gate Recurrent Unit (GRU), inventory optimisation
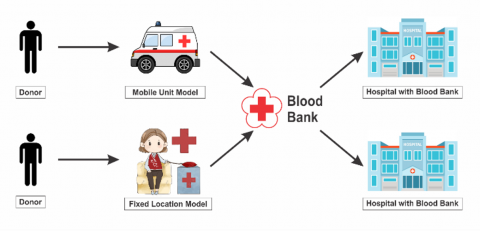
The healthcare system relies heavily on the availability and management of a robust blood supply chain. For example, over 40,000 units of blood products are needed daily in the United States [1]. Blood supply chains are critical for various medical procedures, from emergency trauma cases (where a single patient may require up to 100 units) to routine surgeries, supporting 16 million annual [1]. However, managing blood resources presents unique challenges due to their limited shelf life (42 days for whole blood and five days for platelets) [2]. Indonesia has been experiencing the most severe national blood shortage in the past two decades, with the supply declining by 25% since July 2024. The donor numbers dropped, with only 3% of eligible people donating [3, 4], and there were external disruptions like extreme weather events [5]. To prevent further shortages and waste in the blood supply chain, a reliable forecasting system and inventory management are needed. This is crucial because shortages and waste will pose a risk to the healthcare system; for example, the 25% shortage aforementioned has impacted 18% of medical practices [6]. To build a reliable forecasting system and inventory management, first, we need to understand the business process of the blood supply chain, as shown in Figure 1.
Figure 1. Business process in blood supply chain
Figure 1 shows that one of the critical success factors in the blood supply chain is that the blood bank management must carry out proper planning. In the case of failure in predicting demand from hospitals, the blood bank will have to deal with two risks. First, there will be a shortage as the supply is lower than the demand, which not only poses a risk to patients’ conditions and mortality but also tarnishes the blood bank’s reputation. Second, the blood bank may experience inefficiency due to overstock, which will result in expired products and waste that require proper disposal.
Blood demand patterns are non-linear and unpredictable, so traditional forecasting techniques commonly used in inventory management, such as moving averages and exponential smoothing, are unsuitable. The supply chain requires more advanced systems. Modern machine learning models could be a promising solution, as shown in past research, where they reduce blood shortage rates by 32.1% and wastage rates by 26.6% compared to traditional forecasting techniques [7]. The traditional techniques work well for stable demand patterns but may not be compatible with the rapid changes in healthcare supply chain management (SCM). Numerous variables are at play in this context, which challenges accurate forecasting. For example, the blood supply is projected to decrease from 2.6 million units in 2021 to 1.4 million units by 2050 [8]. Traditional models lack the flexibility to fit all influencing factors with such notable changes and sensitivity to demand volatility caused by local events and demographic shifts [9, 10]. A significant trend is seasonal variations in blood donor turnout, which typically rises during holidays and school breaks. However, traditional forecasting methods can occasionally struggle to accurately reflect these cyclical variations [11]. Overlooking any of these vital components could lead to inaccurate predictions and disrupt supply coordination, therefore compromising the overall functioning of the healthcare system.
The incorporation of machine learning into blood supply chain forecasting has generated revolutionary changes. Although increasing the amount of gathered blood by roughly 11%, previous research suggests this approach could reduce shortages and waste by as much as 20% [12]. Of all machine learning techniques, recurrent neural networks (RNNs) have been particularly effective in controlling sequential data. Furthermore, models with multiple variables sometimes outperform traditional univariate techniques [11]. In time-series forecasting, the Gated Recurrent Unit (GRU) model, a variant of RNN, outperforms Long Short-Term Memory (LSTM) networks by achieving lower Root Mean Squared Error (RMSE) (970.99 vs. 2170.50) and better Mean Absolute Error (MAE) (1199.107 vs. 1881.31) [13].
For blood demand forecasting, where its capacity to capture complicated, time-dependent relationships has helped optimize inventory levels and improve general healthcare supply chain efficiency through more exact predictions and real-time adaptability, his increased accuracy together with GRU's lower computational needs makes it an ideal choice [14]. This paper creates a GRU-based model to forecast blood demand and better control blood supply networks. The main goal is to create an accurate forecasting system that can help reduce blood shortages and prevent excess inventory. In this way, the blood supply chains will be more efficient and reliable.
Traditional blood supply chain forecasting statistics make use of seasonal decomposition models, Autoregressive Integrated Moving Average (ARIMA), and Moving Average. These techniques work well for spotting recurring patterns and demand trends. Moving Average approaches, for instance, can make short-term volatility less pronounced, so they can detect predictable, periodic spikes in blood demand, which is seasonal, with peaks usually seen in March and October [15]. ARIMA models’ prediction of blood demand shows Mean Absolute Percentage Errors (MAPE) of 12.99% for blood donation, 19.59% for blood issues, 37.15% for RDP issues, and 31.94% for Fresh Frozen Plasma issues [15]. Meanwhile, seasonal decomposition models are suitable for recurring patterns, such as during the peak season amid the constant fluctuation throughout the year.
However, traditional methods, as exemplified above, may not be robust enough to forecast demand in blood BSCM as they cannot handle sudden changes and complex patterns. For instance, blood donations were severely impacted during global health crises like the COVID-19 pandemic, especially among younger donors, as donor collections at schools were suspended [16]. Data shows a 60.7% drop in donations from donors aged 16-18 years old and another 31.9% drop from donors aged 19-24 years old in 2021 compared to 2019 [16]. Moreover, traditional methods are not capable of accounting for multifactorial influences that drive or lower blood demand, such as demographic shifts and healthcare advancements. For example, the US aging population has driven demand for blood products [17]. In another context, the number of donors aged 65 and older increased by 40.7% in 2021 compared to 2019 [17], highlighting the complexity of factors influencing donations and demand. Traditional models often can't manage the wild swings of modern blood supply chains due to their unpredictable nature.
Lately, machine learning has gained much attention for its power to predict time-series data. This is useful in guessing changes in demand within blood supply chain systems, which can be quite complex [18]. By spotting hidden patterns in big sets of data across many kinds of products, machine learning like deep learning is often better than old forecasting ways that rely on set rules or simple math [19]. In time-series study, many time-based factors shape data trends. This growth matters a lot now [20]. In 2023, a study showed that AI and ML models do better than old ways for forecasting. These smart systems led to an 11% rise in collected blood. They also cut down waste by 20% compared to the old data. This shows that AI tools give more accuracy and are flexible to use [12]. Machine learning helps boost demand guesses and smooth out routing in blood supply chains. This tech aids many areas of blood supply work. It cuts waste, speeds up the process, and checks that the right amount of blood goes to where it's needed most [21, 22].
The use of machine learning in blood supply has grown. It helps to guess how much blood is needed and makes delivery paths better. Among these, especially noteworthy are support vector machines (SVM) [23], neural networks (NN) [10], and RNN. SVMs are great for predicting shifts in health care needs. They handle many variables well and deal with complex, non-linear choices [24]. Neural networks can look at complex and deep ties in time-series data. They find patterns from small changes to big trends. These tools spot details at every level, making sense of both little shifts and broad paths [10]. RNN models work well to predict patterns in order over time, like changes in blood needs or shifts in patient numbers as time goes on [25]. In areas like blood supply management, machine learning can give exact forecasts. These predictions can be more accurate than those from old models.
Specifically, RNN models can perform time-series prediction well because they can perform deep learning, which is suitable for sequential and time-dependent data [25]. RNN models have internal memory, so they can remember details about inputs that have been given earlier in the sequence [26]. Therefore, RNNs are superior to regular neural networks. They can deal with temporal data dependencies. This ability is useful in blood demand forecasting since demand can be impacted by historical occurrences and patterns. It can see inter-relationships and trends that statistical approaches frequently miss.
Regular RNNs cannot deal with advanced demand forecasting scenarios because of the vanishing gradient problem. In this case, gradients decrease little by little during RNN training. When they do, the network cannot acquire long-term dependencies. This problem is commonplace in demand trends that are influenced by long-term historical data. As such, a regular RNN model cannot make accurate predictions. It might not be sufficiently flexible to handle complex and widely differing patterns that are frequently found in blood demand data [27]. To address these problems and improve model performance, sophisticated RNN architectures have been created.
RNN architecture advancement has produced GRU and LSTM networks. To maintain long-term dependencies and avoid the vanishing gradient issue [26], which the basic RNN models are unable to manage, LSTM networks employ a gating mechanism to regulate input flow. A more straightforward version of LSTM, GRU is intended to be more memory and computationally efficient without sacrificing gating mechanisms [28-30]. In non-linear data patterns, GRU has a better ability to predict, this is calculated from the magnitude of the MAE when compared to the ARIMA and LSTM methods [31]. Although the above research does not specifically predict data in the case of the blood supply chain, in general the data patterns used have similar data forms. In live forecasting, like blood demand, GRU is superior because it is simpler and converges faster. Although both GRU and LSTM are actually good at capturing temporal dependencies, GRU tends to perform better because it is flexible and compatible with applications that need accurate and fast forecasting.
To simplify recurrent neural networks, GRU model uses a gating system to store and update data [32]. The reset gate controls how much info to forget, while the update gate decides how much to keep. The GRU model fits well when quick change is needed, as it handles both short and long needs well. Its simple build cuts down the work for computers, which helps a lot in big blood supply systems that need fast learning and fast action [33].
Its simple design helps cut down on computer work. This is key for big blood supply chains that need fast training and quick processing [34]. The GRU model is a good choice for predicting in supply chain and health logistics. It is simple and does not cost much. While events can make blood needs change fast, past patterns help us guess well. Though events can make blood needs change fast, past trends let us predict quite well.
3.1 Research design
This study looks at blood demand in Indonesia's healthcare system using time-series forecasting and deep learning methods. It builds a predictive system using the GRU model meant to enhance inventory control, cut waste, and decrease shortages. Starting with daily blood donation records, the study gathered and processed them for deep learning analysis. Time-series forecasting called for only needed columns like donor date and blood kind; records with unknown blood types were left out. The data was dated to keep things in order. Missing parts were filled using Forward Fill (FFILL) [35]. Blood type counts were set to the same level, and outliers were scaled with Min-Max to lessen their effect. Overlapping data parts were made using a sliding window, helping the GRU model see time patterns in giving blood better.
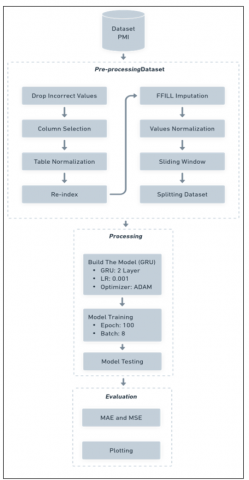
Building the GRU model needed picking the right layers, units, and activation functions for sequential data. Tweaking settings like learning rate, batch size, and number of epochs helped make it work better. After training, a different set of data checked how well the model did. We used MAE and MSE for this; the first shows average mistakes, and the second shows how it handles big errors. Projected versus actual blood demand visual comparison helps to highlight trends and anomalies. Ultimately, the GRU-based method seeks to improve blood supply management by means of precise daily projections, therefore facilitating improved inventory control, resource allocation, and reduction of both overstocking and shortages. This study investigates the issue: “How can predictive modeling and deep learning increase both efficiency and responsibility in blood supply management?” It also shows how deep learning can help data-driven decisions in healthcare logistics. Figure 2 depicts the research design conducted in this study.
Figure 2. Research design
3.2 Dataset
Spanning October 1, 2023, to January 31, 2024, the study makes use of daily blood donation records from the Yogyakarta branch of the Indonesian Red Cross (Palang Merah Indonesia (PMI)). The dataset includes 5,170 entries and features 13 different attributes, ranging from donation dates and blood types to donor demographics, hemoglobin levels, and blood pressure readings. By focusing primarily on the donation date and blood type (including Rh factor), the research narrows its scope to key variables that are crucial for constructing an effective time-series forecasting model, while also maintaining the integrity and reliability of the data [36]. We exclude hemoglobin level and blood pressure data from the data set because the existing data already meets the health requirements for the blood donation process. Likewise, demographic data is not included in the data set, because in reality donors are not limited by their demographics. Meanwhile, blood type is maintained and treated as an important variable because of its inherent complexity and diversity. The distribution and compatibility of several blood types (e.g., A, B, AB, O, and their Rh factors) in the next process in the blood supply chain will be processed into several products such as platelets, packed red cells, plasma and others. So that blood supply data based on blood type has an important role in the planning and management of blood supply.
After data restructuring, the dataset originally consisting of 5,170 samples was transformed into a daily time series, resulting in 120 data points representing daily blood donation counts. This restructuring was necessary to ensure chronological alignment and maintain the temporal consistency essential for time-series forecasting. During the data cleaning process, initial inspection revealed some inconsistencies, such as non-existent blood types (e.g., ‘X+’) and gaps in daily recordkeeping. After restructuring, we identified 30 missing values within the 120-day time series. These missing values were handled using the FFILL method to maintain data continuity. While FFILL is a straightforward imputation technique, it may introduce bias, particularly when gaps occur in clusters. We acknowledge this limitation and suggest exploring more robust imputation techniques, such as interpolation, in future work.
Because the study concentrates specifically on Yogyakarta, the findings might not be broadly applicable beyond this region; however, they remain pertinent within the context of this research. The data, gathered by personnel from PMI and saved in .xls files, has been carefully cleaned and prepared to support time-series analysis. The dataset is reordered based on dates to maintain its chronological sequence. Min-Max Scaling is used to normalize blood type frequencies across all records, so reducing extreme value influence while maintaining general data trends by means of values between 0 and 1.
Maintaining time order to prevent data leakage and guarantee the dependability of the time-series forecasting model, the dataset was split temporally 80% for training and 20% for testing. A strong basis for GRU model training was created by means of careful data cleaning and organization. This increases the precision of blood demand forecasts and streamlines supply chain operations' openness and efficiency [37].
Both the code and dataset used in this work have been made publicly available to encourage openness and help reproduce results. You may find them at the following link: Code and Dataset Repository. The repository holds the last dataset employed in the study, data preprocessing scripts, and complete GRU model implementation [38, 39].
3.3 Training details
Including hyperparameters customised to the blood donation dataset, Table 1 describes the GRU training setup. Comprising four layers, the model architecture is three GRU layers with 512 units each and a fourth layer with 1024 units. All GRU layers had the ReLU activation function used to capture rich temporal dependencies. To avoid overfitting, a dropout layer with a rate of 0.2 follows the final GRU layer. Corresponding to the size of the target variable, the last output is a dense layer with five units [40].
Table 1. Training details
|
Hyperparameter |
Value/Description |
|
Model Type |
GRU |
|
Number of GRU Layers |
4 |
|
Units per GRU Layer |
512 (Layer 1, 2, 3), 1024 (Layer 4) |
|
Dropout Layer |
1 (after the final GRU layer) |
|
Dropout Rate |
0.2 |
|
Dense Layer Units |
5 (output layer) |
|
Activation Function (GRU) |
ReLU |
|
Activation Function (Dense) |
None (Linear) |
|
Input Shape |
(Time Steps / 7, Features / 5) |
|
Return Sequences |
True (for first 3 GRU layers), False (for the last GRU) |
|
Optimizer |
Adam |
|
Learning Rate |
0.001 (default for Adam) |
|
Loss Function |
Huber Loss |
|
Batch Size |
8 |
|
Number of Epochs |
100 |
|
Evaluation Metrics |
MAE, MSE |
Selected for its demonstrated capacity to efficiently handle data changing with time, the model was compiled using the Adam optimizer [41]. To promote consistent and stable convergence during training, the learning rate was maintained at 0.001, the standard Adam setting. Since it handles outliers well and blends MSE with MAE, model training used the Huber loss function [42].
The model was trained for 100 rounds. This helped it find time trends and make fewer mistakes. We picked a batch size of 8. This made sure we used memory well and didn't use too much power on small sets of data [43]. We checked how the model works with two easy steps: MAE and MSE. MAE tells us the average error size. MSE looks at bigger errors since it squares them. Together, these measures show if the model predicts well.
The GRU model was tuned to find a balance between guessing right and being fast. This makes it great for predicting blood needs in the ever-changing healthcare world.
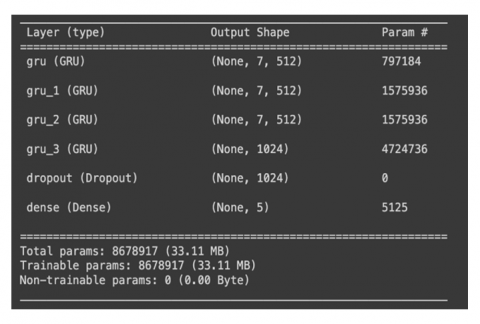
Building a two-layer GRU model, this paper investigates deep learning's possibilities in blood supply management. The GRU architecture was chosen to improve prediction accuracy by means of its ability to capture complex temporal dependencies. The design has 8,678,917 parameters with a computational load of 33.11 MB. Adding dropout layers and a fully connected (Dense) layer to complete the expected outputs helped to improve model performance and lower overfitting. The GRU model architecture employed in this work is shown in Figure 2.
This work looks at how using a two-layer GRU model can help with blood supply control using deep learning. We picked the GRU setup because it can quickly learn complex patterns over time, making predictions better. The model has 8,678,917 parts and uses about 33.11 MB of memory. To help it work well and not learn wrong patterns, we added dropout layers and a Dense layer to make the final guesses [44], see Figure 3 for the GRU model we used in this study.
Figure 3. GRU model architecture
The dataset has 120 daily points, but the GRU model here has 8.6 million bits. This gap shows that the model might fit too well to the tiny dataset. To address this challenge, dropout layers were applied to streamline the model and boost its capacity to generalize to fresh data. Temporal splitting was also employed to preserve the chronological order of the data, so minimizing data leakage and ensuring uniform testing performance.
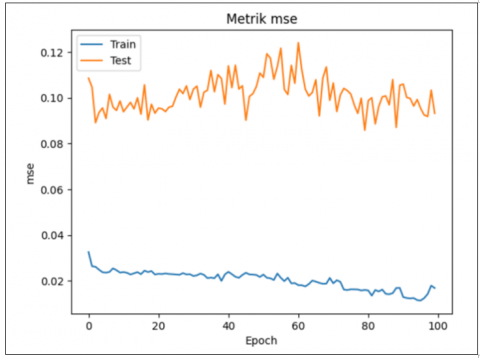
The model was trained over 100 epochs, resulting in a MAE of 0.2033 and a MSE of 0.0923 on the test dataset, as detailed in Table 2. These metrics were selected to evaluate the model’s accuracy, with values based on the test set to prevent the bias that can arise when only considering training performance [45].
Table 2. Performance metrics of GRU model
|
MAE |
MSE |
|
0.2033 |
0.0923 |
It is important to note that these error metrics (MAE and MSE) are computed on the normalized data, as the preprocessing pipeline of the GRU model involved Min-Max scaling [46]. The data normalization process scaled the blood demand values to a range between [0,1], which inherently lowers the magnitude of error values [47]. Therefore, the reported MAE and MSE do not directly correspond to the original scale of blood donations. This normalization step is crucial to maintain the stability and efficiency of the deep learning model during training. Consequently, the relatively low error values reported here reflect both the model’s performance and the effect of normalization. To interpret the error in real-world terms, one would need to reverse the normalization process, translating the error metrics back to the original data scale [48].
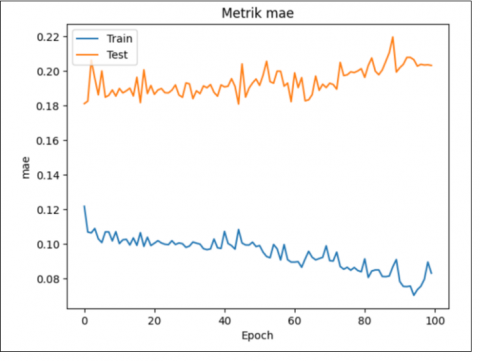
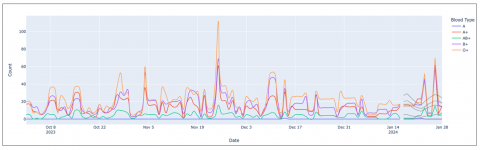
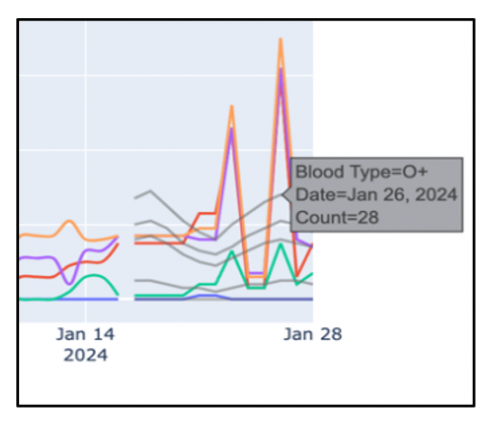
Examining the MAE and MSE metrics graphically, as shown in Figure 4, over time offers a deeper understanding of how stable and accurate the model remains. Moreover, by comparing the predicted results with the actual data collected over a span of twelve days, it becomes clear that the model effectively captures the overall patterns present in the original dataset. The results from January 26 stand out as particularly significant. Despite some discrepancies between the anticipated and actual figures, the model successfully forecasted a rise in the number of blood donors. Figure 5 shows (detailed in Figure 6) the predictions of the GRU model as a grey line, therefore enabling a direct comparison with the actual data.
Figure 4. Historical MAE and MSE during dataset training
Figure 5. Comparison of actual and predicted blood demand
Figure 6. Comparison of actual dataset and predicted value by GRU (Detailed)
The findings show how well deep learning models, depending on GRU might increase the accuracy of blood supply projections. Managing inventory and assisting healthcare services depend much on this capacity. The research indicates that deep learning methods might be useful tools for healthcare logistics, particularly under fast decision-making need. Further research could help GRU models to improve predictive capacity in the healthcare sector, therefore establishing a significant foundation for next supply chain management innovations.
More proactive inventory control is made possible by the exact demand forecasting of the GRU model. Healthcare professionals can keep suitable stock levels by correctly predicting daily blood needs, therefore lowering the probability of shortages and lessening waste produced by surplus inventory [49].
Though the model shows good accuracy, there is still a danger of underestimating demand, which might lead to inventory shortages and possibly interfere with healthcare services. Regular reviews and adjustments of safety stock levels should be made to reflect forecast uncertainty, therefore offering a required cushion to handle unexpected demand spikes [50].
Particularly during periods of expected demand spikes, the inventory management system uses GRU model forecasts to adjust reorder thresholds and maintain suitable stock levels [51]. Combining these projections with operational choices helps to reduce the risk of running out of supplies or keeping too much stock, therefore improving the dependability and reactivity of the blood supply chain [52].
One major limitation of this study is its focus on one site, Yogyakarta. The dataset of blood donations used to develop and evaluate the model was gathered only within this region. Thus, when used in other regions with various demographic profiles and healthcare systems, this might restrict the relevance and dependability of the model. Given that cultural, economic, and social diversity influence blood donation behavior, the model's effectiveness could vary when tested with data from different populations or countries [53].
Often, different areas have different data quality and consistency. We carefully cleaned and preprocessed the dataset in this work, fixing inconsistencies and filling in missing values using the FFILL method. Focusing on daily donation totals, we found 30 gaps scattered over the 120-day period after we reorganised the data. To keep continuity, these missing points were filled using FFFIL. Though simple and quick, this method can sometimes cause bias, especially with respect to sequentially missing values [54]. Knowing this constraint, we recommend future studies to increase the accuracy and completeness of the data by applying more sophisticated methods such model-based estimation or interpolation.
The short four-month span of the data presents one difficulty in this study. This period limits the model's ability to completely understand long-term seasonal variations. Though the model excels at spotting short-term trends, it is advised that future studies increase data collecting to cover at least one full year. Doing so would help the model to consider holiday impacts and annual cycles, both of which significantly affect blood donation patterns [55].
While the structured dataset has just 120 aggregated daily data points, the GRU model used in this study has roughly 8.6 million parameters. This significant disparity between the model's complexity and the small size of the data raises a clear difficulty by raising the possibility of overfitting [56]. Dropout layers were added to solve this; the data was temporally divided to maintain its chronological order. Notwithstanding these measures, the likelihood of overfitting cannot be totally ruled out. We mean to examine various model optimization strategies going forward to improve control over overfitting, including reducing the number of parameters and applying pruning methods. To make the model work better in real life, we need to add more samples to the set. These should be different and complete.
Future work can use data from more places. This shows a wider range of how people donate blood and their traits. It will make the model more useful in real life. Using transfer learning or adjusting the model with local data might help it generalize well [57]. Also, testing the model with data from areas with different rules and health systems would offer a deeper and richer view of its overall reliability.
Including real-time data on hospital demand and external variables such public health alerts and emergency situations would help future research by including more dynamic data sources [58]. Including these components would allow forecasting models to more quickly react to unexpected changes in blood demand. Moreover, considering how GRU fits with other sophisticated time-series methods such LSTM or Transformer-based models could help to improve forecasting performance by more efficiently controlling both transient changes and long-lasting patterns [59].
If the GRU-based forecasting system includes larger and more varied datasets, validates results across several domains, integrates real-time data sources, improves the model's parameters, and uses combined modeling techniques, it will be more flexible and resilient across different healthcare logistics environments, so overcoming these challenges [60].
Using a GRU-based model, this paper investigates predicting blood demand in healthcare supply chains. A time-series dataset from the PMI including preprocessing methods such sliding window segmentation, normalization, and maintaining chronological order was used to create the prediction framework. Its four-layer architecture and application of dropout layers let the GRU model exactly capture the temporal patterns inherent in blood demand and efficiently reduce overfitting. MSE and MAE metrics were used to assess the performance of the model confirming its capacity to closely approximate real demand patterns.
The findings underline the encouraging part deep learning methods, especially the GRU model, might play in optimizing blood supply chain management. This strategy improves inventory control, lowers waste, and helps to avoid shortages by means of precise predictions of blood need, which are absolutely essential for delivering efficient healthcare. This paper underlines the potential modifications of the approach to fit various healthcare operational requirements as well as the benefits of using predictive models in blood supply logistics.
By demonstrating how predictive models may support informed decision-making, optimize resource allocation, and improve transparency, this paper contributes fascinating study to the expanding area of machine learning in healthcare. Techniques like the GRU model offer sensible ways to increase efficiency and guarantee timely access to essential resources, especially as healthcare systems face more difficulties.
[1] The American National Red Cross. US blood supply facts. https://www.redcrossblood.org/donate-blood/how-to-donate/how-blood-donations-help/blood-needs-blood-supply.html.
[2] Paul, S. (2024). Blood banking: Navigating challenges, best practices, and the role of a blood bank management solution. CloudLIMS. https://www.biobanking.com/blood-banking-navigating-challenges-best-practices-and-the-role-of-a-blood-bank-management-solution/.
[3] The American National Red Cross. Red Cross declares emergency blood shortage, calls for donations during National Blood Donor Month. https://www.redcross.org/about-us/news-and-events/press-release/2024/red-cross-declares-emergency-blood-shortage-calls-for-donations-during-national-blood-donor-month.html.
[4] The American National Red Cross. Red Cross-National Blood Inventory Plummets 25% in July —declares emergency blood shortage. https://www.redcross.org/about-us/news-and-events/press-release/2024/red-cross-national-blood-inventory-plummets-in-july-declares-emergency-blood-shortage.html.
[5] Betts, A. (2024). Climate crisis threatens medical blood supply in US amid extreme weather. https://www.theguardian.com/us-news/article/2024/aug/20/blood-shortage-summer-temperatures-extreme-heat-climate-change.
[6] Noyes, J. (2024). Medical experts weigh in on the national blood shortage. https://www.tebra.com/theintake/medical-deep-dives/medical-news/medical-experts-weigh-in-on-the-national-blood-shortage.
[7] Shokouhifar, M., Ranjbarimesan, M. (2022). Multivariate time-series blood donation/demand forecasting for resilient supply chain management during COVID-19 pandemic. Cleaner Logistics and Supply Chain, 5: 100078. https://doi.org/10.1016/j.clscn.2022.100078
[8] Kim, O.S., Ji, S., Jung, H.W., Matthews, S.A., Cha, Y.J., Moon, S.D., Kim, K. (2024). Future blood debt: projecting blood supply and demand of Korea based on subnational population projections (2021–2050). Journal of Korean Medical Science, 39(20): e168. https://doi.org/10.3346/jkms.2024.39.e168
[9] Borkent-Raven, B.A., Janssen, M.P., Van Der Poel, C.L. (2010). Demographic changes and predicting blood supply and demand in the Netherlands. Transfusion (Paris), 50(11): 2455-2460. https://doi.org/10.1111/j.1537-2995.2010.02716.x
[10] Sarvestani, S.E., Hatam, N., Seif, M., Kasraian, L., Lari, F.S., Bayati, M. (2022). Forecasting blood demand for different blood groups in Shiraz using auto regressive integrated moving average (ARIMA) and artificial neural network (ANN) and a hybrid approaches. Scientific Reports, 12: 22031. https://doi.org/10.1038/s41598-022-26461-y
[11] Chideme, C., Chikobvu, D., Makoni, T. (2024). Blood donation projections using hierarchical time series forecasting: The case of Zimbabwe’s national blood bank. BMC Public Health, 24: 928. https://doi.org/10.1186/s12889-024-18185-7
[12] Elmir, W.B., Hemmak, A., Senouci, B. (2023). Smart platform for data blood bank management: Forecasting demand in blood supply chain using machine learning. Information, 14(1): 31. https://doi.org/10.3390/info14010031
[13] Bousnguar, H., Battou, A., Najdi, L. (2023). Gated recurrent units (GRU) for time series forecasting in higher education. International Journal of Engineering Research & Technology, 12(3): 152-154.
[14] Feizabadi, J. (2020). Machine learning demand forecasting and supply chain performance. International Journal of Logistics Research and Applications, 25(2): 119-142. https://doi.org/10.1080/13675567.2020.1803246
[15] Thakur, S.K., Sinha, A.K., Negi, D.K., Singh, S. (2024). Forecasting demand for blood products: Towards inventory management of a perishable product. Bioinformation, 20(1): 20-28. https://doi.org/10.6026/973206300200020
[16] America’s Blood Centers. 2024 blood donation statistics. https://americasblood.org/abc-newsletter/2024-blood-donation-statistics-guide-available/.
[17] Kaylor, A. (2024). American Red Cross tackles national blood shortage with technology. TechTarget. https://www.techtarget.com/pharmalifesciences/news/366607864/American-Red-Cross-Tackles-National-Blood-Shortage-with-Technology.
[18] Shih, H., Rajendran, S. (2020). Stochastic inventory model for minimizing blood shortage and outdating in a blood supply chain under supply and demand uncertainty. Journal of Healthcare Engineering, 8881751. https://doi.org/10.1155/2020/8881751
[19] Benidis, K., Rangapuram, S.S., Flunkert, V., Maddix, D., et al. (2022). Deep learning for time series forecasting: Tutorial and literature survey. ACM Computing Surveys, 55(6): 1-36. https://doi.org/10.1145/3533382
[20] Makridakis, S., Spiliotis, E., Assimakopoulos, V. (2018). Statistical and machine learning forecasting methods: Concerns and ways forward. PLoS One, 13(3): e0194889. https://doi.org/10.1371/journal.pone.0194889
[21] Fariman, S.K., Danesh, K., Pourtalebiyan, M., Fakhri, Z., Motallebi, A., Fozooni, A. (2024). A robust optimization model for multi-objective blood supply chain network considering scenario analysis under uncertainty: A multi-objective approach. Scientific Reports, 14: 9452. https://doi.org/10.1038/s41598-024-57521-0
[22] Khalilpourazari, S., Doulabi, H.H. (2022). A flexible robust model for blood supply chain network design problem. Annals of Operations Research, 328: 701-726. https://doi.org/10.1007/s10479-022-04673-9
[23] Pratama, N.P.P., Sukmono, T. (2022). Forecasting the amount of blood storage using the support vector machine (SVM) method. Procedia of Engineering and Life Science, 3. https://doi.org/10.21070/pels.v3i0.1359
[24] Tello, M., Reich, E.S., Puckey, J., Maff, R., Garcia-Arce, A., Bhattacharya, B.S., Feijoo, F. (2022). Machine learning based forecast for the prediction of inpatient bed demand. BMC Medical Informatics and Decision Making, 22: 55. https://doi.org/10.1186/s12911-022-01787-9
[25] Das, S., Tariq, A., Santos, T., Kantareddy, S.S., Banerjee, I. (2023). Recurrent Neural Networks (RNNs): Architectures, training tricks, and introduction to Influential Research. Machine Learning for Brain Disorders. Neuromethods, 197: 117-138. https://doi.org/10.1007/978-1-0716-3195-9_4
[26] Gu, A., Gulcehre, C., Paine, T., Hoffman, M., Pascanu, R. (2020). Improving the gating mechanism of recurrent neural networks. International Conference on Machine Learning, 119: 3800-3809.
[27] Sherstinsky, A. (2020). Fundamentals of Recurrent Neural Network (RNN) and Long Short-Term Memory (LSTM) network. Physica D: Nonlinear Phenomena, 404: 132306. https://doi.org/10.1016/j.physd.2019.132306
[28] Huynh, A.D., Nguyen, T.K. (2025). The comparison of GRU and LSTM in solar power generation forecasting application. International Journal of Science and Research Archive, 15(2). https://doi.org/10.30574/ijsra.2024.13.1.1831
[29] Naguib, M., Kollmeyer, P.J., Emadi, A. (2023). State of charge estimation of lithium-ion batteries: Comparison of GRU, LSTM, and temporal convolutional deep neural networks. In IEEE Transportation Electrification Conference and Expo (ITEC), Detroit, MI, USA, pp. 1-6. https://doi.org/10.1109/ITEC55900.2023.10186991
[30] Zarzycki, K., Ławryńczuk, M. (2021). LSTM and GRU neural networks as models of dynamical processes used in predictive control: A comparison of models developed for two chemical reactors. Sensors, 21(16): 5625. https://doi.org/10.3390/s21165625
[31] ArunKumar, K.E., Kalaga, D.V., Kumar, C.M.S., Kawaji, M., Brenza, T.M. (2022). Comparative analysis of Gated Recurrent Units (GRU), long short-term memory (LSTM) cells, autoregressive integrated moving average (ARIMA), seasonal autoregressive integrated moving average (SARIMA) for forecasting COVID-19 trends. Alexandria Engineering Journal, 61(10): 7585-7603. https://doi.org/10.1016/j.aej.2022.01.011
[32] Cho, K., Merrienboer, B.V., Gulcehre, C., Bahdanau, D., Bougares, F., Schwenk, H., Bengio, Y. (2014). Learning phrase representations using RNN encoder-decoder for statistical machine translation. arXiv preprint arXiv:1406.1078. https://doi.org/10.48550/arXiv.1406.1078
[33] Yang, S.D., Yu, X.Y., Zhou, Y. (2020). LSTM and GRU neural network performance comparison study: Taking yelp review dataset as an example. In 2020 International Workshop on Electronic Communication and Artificial Intelligence (IWECAI), Shanghai, China, pp. 98-101. https://doi.org/10.1109/IWECAI50956.2020.00027
[34] Chen, X.Y., Yang, L.J., Xue, H., Li, L.H., Yu, Y. (2023). A machine learning model based on GRU and LSTM to predict the environmental parameters in a layer house, taking CO2 concentration as an example. Sensors, 24(1): 244. https://doi.org/10.3390/s24010244
[35] Ding, X.Y., Zhang, X. Li, X.F., Du, J.L. (2023). A hybrid neural network based model for blood donation forecasting. Journal of Biomedical Informatics, 146: 104488. https://doi.org/10.1016/j.jbi.2023.104488
[36] Li, N., Pham, T., Cheng, C., McElfresh, D.C., et al. (2023). Blood demand forecasting and supply management: An analytical assessment of key studies utilizing novel computational techniques. Transfusion Medicine Reviews, 37(4): 150768. https://doi.org/10.1016/j.tmrv.2023.150768
[37] Meisenbacher, S., Turowski, M., Phipps, K., Rätz, M., Müller, D., Hagenmeyer, V., Mikut, R. (2022). Review of automated time series forecasting pipelines. WIREs Data Mining and Knowledge Discovery, 12(6): e1475. https://doi.org/10.1002/widm.1475
[38] Douaioui, K., Oucheikh, R., Benmoussa, O., Mabrouki, C. (2024). Machine learning and deep learning models for demand forecasting in supply chain management: A critical review. Applied System Innovation, 7(5): 93. https://doi.org/10.3390/asi7050093
[39] Zhang, C., Jiang, D.F., Gao, Y.Y., Jiang, K.H. (2023). Interpretable hierarchical error correction GRU model for effective observation selection. Applied Soft Computing, 149: 110982. https://doi.org/10.1016/j.asoc.2023.110982
[40] Zhang, Z., Chen, Q., Han, T.T., Li, C., Liu, Y.L., Liu, G. (2022). Memristor-based circuit demonstration of gated recurrent unit for predictable neural network. IEEE Transactions on Electron Devices, 69(12): 6763-6768. https://doi.org/10.1109/TED.2022.3217116
[41] Dehghani, M.M., Mehrany, K., Memarian, M. (2024). All-optical multi-wavelength-channel ReLU activation function. Optics Express, 32(22): 39160. https://doi.org/10.1364/OE.531165
[42] Reyad, M., Sarhan, A., Arafa, M. (2023). A modified Adam algorithm for deep neural network optimization. Neural Computing and Applications, 35: 17095-17112. https://doi.org/10.1007/s00521-023-08568-z
[43] Peng, Y.L., Lee, W.P. (2024). Practical guidelines for resolving the loss divergence caused by the root-mean-squared propagation optimizer. Applied Soft Computing, 153: 111335. https://doi.org/10.1016/j.asoc.2024.111335
[44] Hu, Z.Z., Hu, Xiao, J.M., Sun, N.H., Tan, G.M. (2022). Fast and accurate variable batch size convolution neural network training on large scale distributed systems. Concurrency and Computation: Practice and Experience, 34(21): e7119. https://doi.org/10.1002/cpe.7119
[45] Podder, P., Das, S. R., Mondal, M.R. H., Bharati, S., Maliha, A., Hasan, M.J., Piltan, F. (2023). LDDNet: A deep learning framework for the diagnosis of infectious lung diseases. Sensors, 23(1): 480. https://doi.org/10.3390/s23010480
[46] Oraiopoulos, A., Howard, B. (2022). On the accuracy of urban building energy modelling. Renewable and Sustainable Energy Reviews, 158: 111976. https://doi.org/10.1016/j.rser.2021.111976
[47] Kim, M., Genton, M.G., Huser, R., Castruccio, S. (2025). A neural network-based adaptive cut-off approach to normality testing for dependent data. Statistics and Computing, 35: 22. https://doi.org/10.1007/s11222-024-10551-0
[48] Amorim, L.B.V.D., Cavalcanti, G.D.C., Cruz, R.M.O. (2023). The choice of scaling technique matters for classification performance. Applied Soft Computing, 133: 109924. https://doi.org/10.1016/j.asoc.2022.109924
[49] Peng, T., Gan, M., Ou, Q., Yang, X.Y., Wei, L.F., Ler, H.R., Yu, H. (2024). Railway cold chain freight demand forecasting with graph neural networks: A novel graph ARMA-GRU model. Expert Systems with Applications, 255: 124693. https://doi.org/10.1016/j.eswa.2024.124693
[50] Fan, L.L., Song, Z.Y., Mao, W.T., Luo, T.J., Wang, W.T., Yang, K., Cao, F.K. (2024). Change is safer: A dynamic safety stock model for inventory management of large manufacturing enterprise based on intermittent time series forecasting. Journal of Intelligent Manufacturing. https://doi.org/10.1007/s10845-024-02442-y
[51] Rekabi, S., Garjan, H.S., Goodarzian, F., Pamucar, D., Kumar, A. (2024). Designing a responsive-sustainable-resilient blood supply chain network considering congestion by linear regression method. Expert Systems with Applications, 245(1): 122976. https://doi.org/10.1016/j.eswa.2023.122976
[52] Niakan, P.B., Keramatpour, M., Afshar-Nadjafi, B., Komijan, A.R. (2024). An integrated supply chain model for predicting demand and supply and optimizing blood distribution. Logistics, 8(4): 134. https://doi.org/10.3390/logistics8040134
[53] Schröder, J.M., Merz, E.M., Suanet, B., Wiepking, P. (2023). The social contagion of prosocial behaviour: How neighbourhood blood donations influence individual donation behaviour. Health & Place, 83: 103072. https://doi.org/10.1016/j.healthplace.2023.103072
[54] Sengewald, E., Hardt, K., Sengewald, M.A. (2024). A causal view on bias in missing data imputation: The impact of evil auxiliary variables on norming of test scores. Multivariate Behavioral Research, 60(2): 258-274. https://doi.org/10.1080/00273171.2024.2412682
[55] Chideme, C., Chikobvu, D. (2024). Application of time-series analysis and expert judgment in modeling and forecasting blood donation trends in Zimbabwe. MDM Policy & Practice, 9(1): 1-15. https://doi.org/10.1177/23814683231222483
[56] Rohloff, C.T., Kohli, N., Chung, S. (2022). The impact of functional form complexity on model overfitting for nonlinear mixed-effects models. Multivariate Behavioral Research, 58(4): 723-742. https://doi.org/10.1080/00273171.2022.2119360
[57] Jain, R., Yoo, T.K., Ryu, I.H., Song, J., Kolte, N., Nariani, A. (2024). Deep transfer learning for ethnically distinct populations: Prediction of refractive error using optical coherence tomography. Ophthalmology and Therapy, 13: 305-319. https://doi.org/10.1007/s40123-023-00842-6
[58] Mansur, A., Setiawan, N., Faiz, A.H., Indrawati, S. (2024). Improving blood donations and lean blood bank services in Indonesian Red Cross: A system dynamics approach. Mathematical Modelling of Engineering Problems, 11(9): 2463-2472. https://doi.org/10.18280/mmep.110918
[59] Mahjoub, S., Chrifi-Alaoui, L., Marhic, B., Delahoche, L. (2022). Predicting energy consumption using LSTM, multi-layer GRU and Drop-GRU neural networks. Sensors, 22(11): 4062. https://doi.org/10.3390/s22114062
[60] Salamian, F., Paksaz, A., Khalil Loo, B.K., Mamoudan, M.M., Aghsami, M., Aghsami, A. (2024). Supply chains problem during crises: A data-driven approach. Modelling, 5(4): 2001-2039. https://doi.org/10.3390/modelling5040104