Synthesis and Characterization of Multiwalled Carbon Nanotubes Decorated by ZnO and Ag2O for Using to Remove Methyl Green and Erythrosin B Dyes from Their Aqueous Solutions

Mariam A. Raheem![]() | Zuhair A. Abdulnabi
| Zuhair A. Abdulnabi![]() | Ali A. A. Al-Shawi*
| Ali A. A. Al-Shawi*![]()
© 2025 The authors. This article is published by IIETA and is licensed under the CC BY 4.0 license (http://creativecommons.org/licenses/by/4.0/).
OPEN ACCESS
A new nanocomposite for multiwalled carbon nanotubes with zinc oxide and silver oxide was prepared by utilizing hydrothermal method with methanol as solvent. Zinc oxide (ZnO) and silver oxide (Ag2O) were synthesized using co-precipitation method under basic medium. They were identified by several techniques such as UV-Vis, X-ray powder diffraction (XRD), scanning electron microscopy (SEM) and EDX analysis. The crystal size of the prepared nano compounds was revealed 17.6, 26.8, 20.3 and 21.5nm for MWCNT (after their functionalized by utilizing acids mixture from sulfuric and nitric acid by ratio 3:1(v/v)), ZnO, Ag2O and MWCNTs/ZnO & Ag2O nanocomposite respectively. The batch adsorption was used for removing two different class as cationic and anionic dyes from its aqueous solutions under various conditions such as pH level, temperature, contact time and agitation speed, the data exhibited a high value to remove dyes methyl green (MG) and erythrosin B (EB) onto the surface nanocomposite were 96.4 and 99.71% respectively. Adsorption equilibrium isotherm appeared the Langmuir model is more fitted than Freundlich to remove erythrosin B dyes with adsorption capacity 184.9 mg/g, while the adsorbed of methyl green dye more fitted with Freundlich isotherm and adsorption capacity is 836.9 mg/g. Thermodynamic parameters (∆G°, ∆H° and ∆S°) have been computed and revealed the negative values for the free energy.
hydrothermal, nanocomposite, batch adsorption, isotherm model, cationic, anionic dyes
Carbon nanotubes have several unique properties, including electronic, chemical, mechanical strength, optical activity, large surface area, high porosity, light mass density, and hollow structure. They can be described as a graphite sheet twisted up within a nanoscale tube. Furthermore, CNTs can be divided into two main classes: single-wall carbon nanotubes (SWCNTs) and multiwalled carbon nanotubes (MWCNTs) [1-3].
Multiwalled carbon nanotubes have additional important features such as internal sites, interstitial channels, and grooves on their outer surface. Moreover, they exhibit non-covalent forces such as hydrogen bonding, π–π stacking, electrostatic forces, van der Waals forces, and hydrophobic properties [4]. Consequently, these unique properties make MWCNTs excellent adsorbent surfaces, allowing strong interactions with various pollutants, including both organic and inorganic contaminants [2].
The release of various pollutants into ecosystems has increased due to anthropogenic activities such as industrial development in sectors like oil production, building materials, cosmetics, food, clothing, and dyes. Additionally, urban growth has led to a rise in domestic waste discharge into the environment without proper treatment [5-7].
Nano oxides have attracted significant research interest due to their chemical properties, applications, and small particle size, making them widely used for removing organic and inorganic pollutants from aqueous solutions. Particularly, zinc oxide (ZnO), silver oxide (Ag₂O), titanium oxide (TiO₂), iron oxide (Fe₂O₃), and selenium dioxide (SeO₂) have been utilized for water treatment applications, targeting pollutants such as heavy metals, dyes, pharmaceuticals, domestic waste, and oil spills through the batch adsorption method [1, 8].
Methyl green (MG) and erythrosin B (EB) dyes are organic compounds belonging to two different dye classes: triarylmethane and xanthene, respectively. They have high solubility in water and exhibit toxicity and carcinogenic effects [9, 10].
Consequently, the present work aims to synthesize a new nanocomposite from functionalized multiwalled carbon nanotubes with nano oxides such as zinc oxide and silver oxide by the hydrothermal method. The objective is to obtain a high surface area and smaller particle size than in previous studies and then use the nanocomposite to remove MG and EB dyes from aqueous solutions with high efficiency using the batch adsorption method.
2.1 Materials
All chemical materials are analytical grade and used without further purification, zinc acetate dihydrate (Zn (CH3COO)2. 2H2O), nitric acid (HNO3 65%) and methanol solvent (CH3OH) were supplied from GCC. Ethanol 96% was purchased from Fisher. MWCNTs (OD 10-20nm, SSA 150 m2/g and purity > 98%), silver nitrat (AgNO3) potassium hydroxide (KOH) and sodium hydroxide (NaOH) were obtained by Mreck. Sodium borohydride (NaBH4) was supplied from Riedel-de Haen Agseelze-Hannover. Sulfuric acid (H2SO4) 98% was purchased from Himedia, India. Methyl green (MG) and erythrosin B (EB) dyes were supplied by Sigma and BDH company respectively.
2.2 Instrumentation
The morphology structure and elementals content of the prepared compounds were characterized by scanning electron microscopy (SEM) and energy dispersive X ray respectively by utilizing Vega A3 TESCAN microscopy at 20 Kv. In addition, X-ray powder diffraction (XRD) was measured by utilizing a Kα-Cu source and wavelength 1.54 A° from Philips model PW1730. The wavelength maximum for dyes solution was selected by UV-Vis spectrophotometer double beam from Shimadzu model UV-1800.
2.3 Procedure
2.3.1 Preparation of ZnO NPs
Zinc oxide NPs were prepared by co-precipitation method according to the previous described study [11] as follows: weighted 0.658 g (3 mmol) of zinc acetate dihydrate and dissolved in 30 ml of methanolic solution. Methanolic basic solution was prepared by dissolving 0.392g (7 mmol) of KOH in methanol as solvent. After completing dissolution, the alkali solution was added dropwise to zinc acetate solution and mixed under ultrasonic effect for 60min and then it was removed from sonicator and left in room temperature in order to complete the deposition process. The white color of precipitate [11, 12] was obtained after using the centrifuging and washing in methanol in several times. Finally, the white precipitate was dried at 120℃ for 180 min then followed calcination process at 400℃ [13] for 120 min. As a result, the pinkish grey color was obtained after calcination.
2.3.2 Preparation of Ag2O NPs
The silver oxide nanoparticles were prepared by using co-precipitation method in basic medium. The method preparation can be summarized as follows: 0.5 g of silver nitrate and transferred into a beaker (500ml) before adding 300 ml of deionized water, and then it was left at 70℃ with stirring for 10 min. After dissolving, 0.113 g of NaBH4 as a reducing agent was added to the solution by several steps. Then, 20ml of potassium hydroxide (4 mmol, 0.224 g) solution was added dropwise in silver nitrate solution after its reduction. Blackish brown precipitate was obtained after washing several times in deionized water and then it was dried at 110℃ for 180 min [14, 15].
2.4 Functionalization of MWCNTs
The oxidation process was carried out to improve some properties for materials, such as interactivity, porosity, surface area and active sites [16] by adding new functional groups. In general, some groups add hydroxyl and carboxyl to the surface of MWCNTs utilizing oxidize agents [17, 18]. The addition process of carboxyl groups to MWCNTs surface was carried out using acid mixture of a combination nitric acid and sulfuric acid as described in literature survey [19] as follows: 0.1g of pristine MWCNTs were immersed in 20 ml of acid mixture (10M H2SO4 and 4M HNO3) by ratio 3:1, and then stirred for 18h at room temperature. After that, the solution was filtered and washed several times with deionized water until it reached neutral pH. Finally, the solid resultant was dried at 80℃ for 12h (Figure 1).
Figure 1. Showed the functionalization of MWCNTs
2.4.1 Preparation of nanocomposite f-MWCNTs/ ZnO& AgO
After preparing functionalized multiwalled carbon nanotubes (f-MWCNTs) and, adding some carboxyl groups to the structure of MWCNTs, it was decorated by the prepared zinc oxide and silver oxide using hydrothermal method. Exactly 0.1 g of f-MWCNTs was weighed and transferred into a beaker 250 ml and then it was dispersed in 50ml of an ethanolic solution 96% for 30min by utilizing an ultrasonic instrument. On the other hand, 0.03 g of each oxide was weighed and also dispersed in 10ml ethanol for 30min. After completing the dispersal process of solutions in ethanol, the solutions were mixed together. After that, the mixture solution was dispersed and left in an ultrasonic device for 60 minutes, and then it was transferred into a container made of polytetraflouroethylene (100ml) tightly closed then put in an autoclave of stainless steel at oven temperature 180℃ for 6h. Finally, the nanocomposite was isolated and dried at 80℃ for 180min
2.5 Preparation of aqueous dye solution
The stock solution (1000 mg/l) of each dye was prepared by dissolving in deionized water in order to determine the suitable concentration of each dye (MG and EB) by following serial dilution method, and they were used in adsorption experiments. The maximum wavelength (λmax) for each dye was measured in concentration at 20 mg/l, and the wavelength was scanned in the region 200 -800 nm using a UV-Vis spectrophotometer. The results recorded the maximum wavelength of MG and EB dyes are 632.5 and 526 nm, respectively.
2.6 Adsorption experiments
The current study has employed two classes of dyes: the first is erythrosine B, which belongs to the xanthenes class dye, and the second is methyl green which returned to the triaryl methane class dyes, Figure 2 [20]. Besides, these dyes can be classified depending on their charge dyes into anionic and cationic dyes respectively. The adsorption method considered is one of the methods that is useful, successful and gives high efficiency to remove the pollutants from their aqueous solutions. Consequently, the batch adsorption experiments were applied to remove MG and EB dyes from its aqueous solutions by employing initial concentrations of 100 mg/l and 250 mg/l for dyes EB and MG respectively, in 50 ml of a conical flask tightly closed after adding 10mg of f-MWCNTs/ ZnO&AgO as adsorbent surface and 10ml of the adsorbate solution under fixed some parameters such as agitation speed (150 RPM), temperature (25℃) and natural pH of solution dyes under different times in order to reach the equilibrium time for each dye. The concentration remained at the equilibrium time was separated by centrifugation and measured by UV-Vis spectrophotometer at the maximum wavelength for each dye.
Figure 2. Structure of dyes
The removal ratio and adsorption capacity were calculated following the equations:
%R=[Ci−CeCi]×100 (1)
qe(mgg)=[VLx(Ci−Ce)]Wg (2)
where, the R is removal percent, Ci and Ce represent initial and equilibrium concentration respectively, qe is the adsorption capacity, VL and Wg represent the volume of adsorbate solution and the amount of adsorbent surface respectively [20].
2.7 Isotherm experiment
The isotherm can be studied the relationships among the amounts of adsorbed material onto the adsorbent surface by changing concentration at a fixed temperature, moreover it can describe the bond nature between adsorbate molecules and the adsorbent surface by Gils classification. The present work's two isotherm models were studied Langmuir and Freundlich models in order to mane one of the models can be correspond with the adsorption system. The adsorption capacity can be computed from the Langmuir isotherm after slope extracting by the plot graph between Ce/qe verses Ce. The Langmuir equation is given in relation [20-22]:
Ceqe=(1qmaxKL)+(Ceqmax) (3)
The Freundlich model can explain the type of adsorption, either mono or multilayer. The Freundlich equation is given by:
Log qe=logKf+(logCe/n) (4)
where, the qmax is represented the maximum amount that can be adsorbed onto the adsorbent surface, KL is the Langmuir constant and that is given by unit L/mg. However, Kf is the Freundlich constant which is related to adsorption capacity that is given by unit L/g, while n is considered the heterogeneity factor that is pointed to intensity of adsorption. The heterogeneity value refers to acceptability of the adsorption process, where if the n value was equal to zero (n=0) which is refers to the isotherm is irreversible, while if the value of n value was located between zero and one (0<n<1) which points to the adsorption process is unfavorable, at last if the n value was more than one (n>1) which refers to the adsorption process is favorable [20-24].
3.1 Characterization of the f-MWCNTs decorated by ZnO&Ag2O
Several techniques were used to confirm the success of prepared methods for synthesizing zinc oxide, silver oxide and their decorating on the F-MWCNTs surface, as bellow:
3.1.1 X-ray powder diffraction spectroscopy
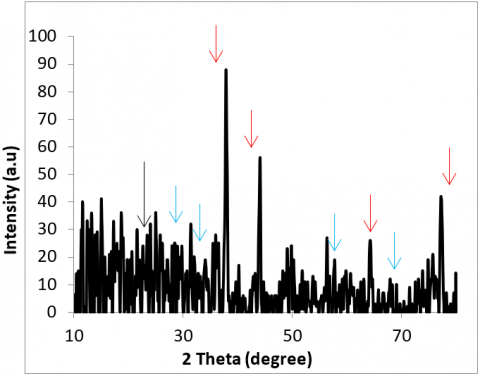
X-ray diffraction (XRD) spectroscopy is a crucial technique for characterizing the crystalline phase, crystal structure, crystal size, and surface properties of the adsorbent material [20, 21, 25]. The XRD patterns of the prepared compounds exhibited characteristic diffraction peaks at 2θ positions: 26.3°, 43.0°, 44.7°, 53.7°, 78.0° for f-MWCNT; 38.02°, 44.13°, 64.51°, 77.36° for Ag₂O; 19.1°, 31.86°, 34.46°, 36.45°, 47.65°, 56.78°, 63.09°, 68.29°, 69.46°, 77.27° for ZnO; and 26.11°, 27.95°, 29.16°, 31.42°, 35.40°, 37.91°, 44.03°, 57.66°, 64.32°, 68.007°, 77.22° for the f-MWCNT/ZnO&Ag₂O nanocomposite.
These diffraction peaks correspond to the characteristic crystal planes of the respective materials: (002 and 100) for f-MWCNT, (111, 200, 220, 311) for Ag₂O, and (200, 100, 002, 101, 102, 110, 103, 112, 201, 202) for ZnO [15, 26-28]. The data confirm the successful synthesis of the prepared compounds and are consistent with the JCPDS reference patterns: 01-0646 for f-MWCNT [26], 76-1393 for Ag₂O [15], and 36-1451 for ZnO [28].
The Debye-Scherrer equation was applied to calculate the crystal size of the synthesized materials, yielding 17.67 nm for f-MWCNT, 26.89 nm for Ag₂O, 20.34 nm for ZnO, and 21.52 nm for the F-MWCNT/ZnO&Ag₂O nanocomposite. These results confirm that all the synthesized materials fall within the nanomaterial classification. The corresponding XRD patterns are presented in Figure 3.
Figure 3. (a) The XRD patterns of the prepared nanocompounds F-MWCNT
Figure 3. (b) The XRD patterns of the prepared nanocompounds Ag2O
Figure 3. (c) The XRD patterns of the prepared nanocompounds ZnO
Figure 3. (d) The XRD patterns of the prepared nanocompounds F-MWCNT/ZnOAg2O
3.1.2 Scanning electron microscopy
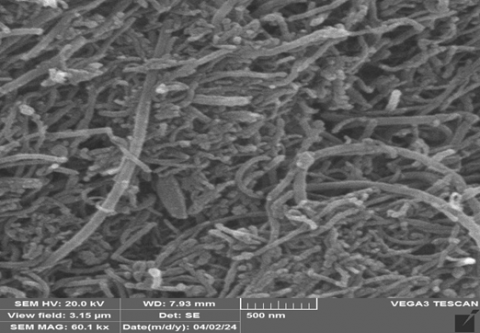
The SEM technique was used to determine the natural of the surface where provide many information about the morphology of the outer surface for any material, this property is employed by researchers who have attention towards the environment system for treating the polluted water through knowledge of the particle size, porosity and active sites [20, 21].
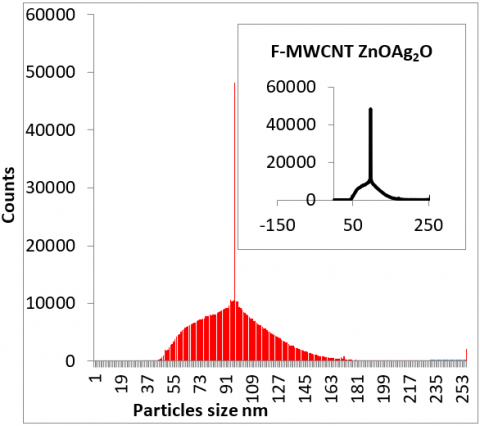
The results of SEM image of the f-MWCNT/ZnO&Ag2O was appeared the tubes structure that belong to multiwalled carbon nanotubes and also exhibited many grooves and channels which enhanced the porosity and surface area. The histogram analyses were extracted information by Imag-J (1.46r) program and appeared the average of particles size for decorated MWCNT is 67.72 nm. The data of SEM image and histogram are explained in Figure 4.
Figure 4. (a) The SEM morphology of nanoparticles sizes
Figure 4. (b) The SEM particles' sizes analyses
3.1.3 EDX analysis
The analyses of energy dispersive X-ray are useful to know the element contents for the analysis of samples at room temperature in 0 to 80 KeV range [20]. The results obviously revealed the new signals in EDX spectrum of f-MWCNTs after their comparison with decorated f-MWCNT. The increasing oxygen signal intensity with a decreased carbon ratio to Oxygen and the new signals that appeared to belong to zinc and silver clearly confirm the success for decorating the multiwalled carbon nanotubes by ZnO and Ag2O. the results are depicted in Figure 5 and Table 1.
Figure 5. (a) The EDX result of nanocompounds F-MWCNT
Figure 5. (b) The EDX result of nanocompounds F-MWCNTZnOAg2O
Table 1. The EDX results of F-MWCNT nanocomposite
|
Compounds |
%Element Ratio |
C/O Ratio |
%Total Ratio |
||||
|
C |
O |
Ni |
Zn |
Ag |
|||
|
F-MWCNT |
96.19 |
3.45 |
0.36 |
- |
- |
27.881 |
100 |
|
F-MWCNT/ ZnO&Ag2O |
49.03 |
11.08 |
- |
15.60 |
24.29 |
4.425 |
100 |
3.1.4 UV-Vis spectroscopy
Uv-Vis technique is an important analysis for characterizing nanomaterial compounds through the new strong peak belonging to the local surface plasmon resonance spectrum (LSPR) rather than with the bulk material solutions [29]. The characteristic peaks exhibited the wavelengths at 268 nm, 371 nm and 408 nm which belong to f-MWCNTs, ZnO and Ag2O respectively that are consistent with previous studies [14, 29, 30]. The spectrum of f-MWCNT after decorating by ZnO and Ag2O was measured by dispersing in water in the region 200-800nm. A peak appeared at 266 nm, which attributed to f-MWCNT and also exhibited a new peak at 372 nm than with pristine spectrum of f-MWCNTs that is assigned to the plasmon peak of zinc oxide. Finally, all the techniques are proving to be successful in the decorating process for F-MWCNTs with zincoxide and silveroxides, the results are depicted in Figure 6.
3.2 Adsorption MG and EB Dyes onto F-MWCNTs/ZnOAg2O
The prepared F-MWCNTs nanocomposite with some nano oxides like ZnO and Ag2O showed many advantages, such as increasing surface area, decreasing particle size, and obtaining different pore sizes. These parameters assist in giving a good adsorption surface for removing several pollutants. Moreover, the used nano oxides such as ZnO and Ag2O for decorating F-MWCNTs can be attributed to increased surface area. The ability to bind with many pollutants and also their bioactivity as antibacterial. Therefore, the adsorption experiment applied the batch method for adsorbing anionic and cationic dyes onto new adsorbent of decorated f-MWCNTs by ZnO and Ag2O under different factors such as equilibrium time, pH level, temperature and agitation speed.
3.2.1 Effect of equilibrium time
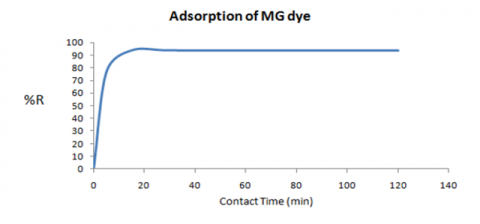
The required time to occupy all active sites onto adsorbent surface by the molecules of dyes. The time was determined for ranging duration times 5-120 min after fixing the other affected parameters like 25℃, 150 RPM, 10 ml, 0.01g as temperature, mixing speed, volume of dye solution and adsorbent weight respectively. In addition, the initial concentration for solution dyes was chosen at 100 and 250 mg/l for EB and MG dyes respectively. The effect of time on adsorption process was observed by increasing the removal percent for dyes solution as function to increase time until to reach equilibrium state in solid-liquid system [21]. The increased removal percent is due to the rise of the active site occupation onto adsorbent surface. The data in Figure 7 of time effect was appeared the equilibrium time at 15min for both dyes solution with removal percent 82.8% and 93.81% for EB and MG dyes after measuring at wavelength 526 and 632.5 nm respectively.
Figure 6. (a) UV Spectra of the prepared nanocompounds F-MWCNT
Figure 6. (b) UV Spectra of the prepared nanocompounds Ag2O
Figure 6. (c) UV Spectra of the prepared nanocompounds ZnO
Figure 6. (d) UV Spectra of the prepared nanocompounds F-MWCNTZnOAg2O
Figure 7. (a) The time effect on adsorption process of EB dye
Figure 7. (b) The time effect on adsorption process of MG dye
3.3 Effect of acidic function
The acidic function is one of the important parameters that influence adsorption percent by shifting charge for the functional groups which found onto adsorbent surface [21, 31]. The experiment of the affected pH value on the adsorption process was studied at different pH levels from 3-9 and the results reveal the partial precipitation that occurs at pH greater than 8 in MG dye solution and less than 3 in EB dye solution, which is attributed to the charge of the dyes structure [32, 33]. The increase of the percent adsorption towards basic medium for MG dye was recorded where the removal percent of MG dye onto adsorbent surface high value at 95.36% at neutral pH level. On the other hand, the best pH value was selected to adsorb EB dye from their aqueous solution onto the adsorbent surface at pH 3 with a high removal percent of 91.95%. The pH experiment was carried out by fixing the other parameters at 15 minutes as the equilibrium time. The data are depicted in Figure 8.
Figure 8. (a) The pH levels' effect on adsorption of EB dye
Figure 8. (b) The pH levels' effect on adsorption of MG dye
3.4 Effect of temperature
The critical parameter that has influenced the change in the binding force between adsorbate and adsorbent surface via functional groups between them in the adsorption process is the temperature change.
When the temperature decreases, the force bonded between adsorbate molecules and adsorbent surface is weakly bound formed, and thus the physiosorption occurs. Moreover, the probability of chemosorption formed with rise in temperatures via the strong bonded generated between adsorbate solution and adsorbent surface [21, 31, 32]. The change temperature was tested to adsorb MG and EB dyes onto decorative F-MWCNTs in the range of 25 to 65ºC with the fixed the other parameters where notice was increased to remove the dye molecules from their equeous solution by f-MWCNTs nanocomposite with rising in temperature especially at 55 and 65ºC with the removal percent at 95.97 and 95.28% for MG and EB dyes respectively. The results are shown in Figure 9.
Figure 9. (a) The temperature effect on adsorption processes of EB dye
Figure 9. (b) The temperature effect on adsorption processes of MG dye
3.5 Effect of agitation speed
In order to obtain a high adsorption efficiency for removing MG and EB dyes from its aqueous solution onto nanocomposite surface with alternative the agitation speed, out fixed the other parameters at the optimum values for time, pH, temperature, volume of dye solution and adsorbent amount at equilibrium state. Subsequently the shaking speed was experimented within the range of 50 to 300 RPM to remove dyes molecules at initial concentration 100 and 250 mg/l for EB and MG respectively by decorated f-MWCNTs. The data of the agitation speed experiment were exhibited at a low of the agitation speed reached to highest adsorption percent for adsorb MG dye molecules onto adsorbent surface at 50 RPM with removal percent at 96.40%. The increased agitation speed needed to remove the EB molecules from their aqueous solution to 150 RPM with adsorption percent at 99.71%. The increased removal percent with increasing agitation speed may be due to the decline of the boundary layer that embraces the adsorbent particles [21, 22].
In general, there are many factors that affect the adsorption process which depend on existing functional groups, increasing surface area, pore size, volume pore and surface charge. These factors limit the adsorption efficiency. for example, the current study used cationic (MG) and anionic (EB) dyes, and the main factors that affect the adsorption process are adsorbent charge and particle size [34]. The effects on the adsorption process by utilizing agitation speed are depicted in Figure 10.
Figure 10. (a) The agitation speed effect on adsorption processes of EB dye
Figure 10. (b) The agitation speed effect on adsorption processes of MG dye
3.6 Isotherm study
Many useful information can be obtained from isotherm experiments, especially the knowledge adsorption relationship between adsorbate molecules and the adsorbent surface [20] by utilizing four temperatures at 25, 35, 45 and 55℃ which are employed to study the behavior at different concentration for adsorbate solutions 100, 150, 200 and 250 mg/l for EB dye solutions, while 100, 200, 250 and 300 mg/l for MG dye solutions.
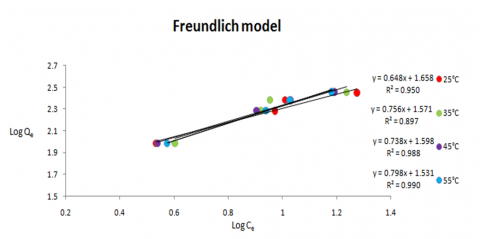
Figure 11 described the relationship between concentration in equilibrium state for dye solutions with adsorption capacity after the adsorption system obeyed at various temperatures according to Giles classification [20, 33]. The classification data to adsorb MG and EB dye solution onto decorated f-MWCNTs surface are corresponding to L class which refers to weak bonding that forms between the dye molecules and the adsorbent surface [33]. The current work employed the adsorption mechanism using two isotherm models as Langmuir and Freundlich, for describing the relationship between the MG and EB dye molecules after adsorbing by decorated f-MWCNTs from their aqueous solutions. The experimental data after adsorbing the MG and EB dye molecules from their aqueous solutions by f-MWCNTs nanocomposite surface appeared; the adsorption process for MG dye corresponds with the Freundlich isotherm and is more favorable than the Langmuir isotherm and also it has an adsorption capacity of 836.94 mg/g. The adsorption system for removing EB dye from its aqueous solution fits with the Langmuir model rather than the Freundlich model, moreover, the Langmuir agreement is increased with increased temperatures to give the adsorption capacity at 184.941 mg/g. The isotherm relationship for MG and EB are depicted in Table 2 and Figure 12 and Figure 13 respectively.
Figure 11. (a) Adsorption isotherm according to Giles classification of EB dye
Figure 11. (b) Adsorption isotherm according to Giles classification of MG dye
Figure 12. (a) The Langmuir for MG dye
Figure 12. (b) The Freundlich models for MG dye
Figure 13. (a) The Langmuir for EB dye
Figure 13. (b) The Freundlich models for EB dye
Table 2. The Langmuir and Freundlich model results
|
Langmuir Model |
||||||||
|
EB |
Co mg/l |
Ce mg/l |
Ce/qe g/l |
qmax mg/g |
KL L/mg |
RL |
R2 |
|
|
100 |
4.012 |
0.041797 |
184.9411 |
0.18877 |
0.05030 |
0.963 |
||
|
150 |
14.824 |
0.109664 |
0.16236 |
0.03944 |
||||
|
200 |
51.521 |
0.346992 |
0.16236 |
0.02987 |
||||
|
250 |
63.17 |
0.338115 |
0.16236 |
0.02404 |
||||
|
MG |
100 |
3.755 |
0.039015 |
836.9465 |
0.034992 |
0.2222 |
0.925 |
|
|
200 |
8.709 |
0.045527 |
0.162365 |
0.0298 |
||||
|
250 |
10.654 |
0.044513 |
0.162365 |
0.0240 |
||||
|
300 |
15.176 |
0.053282 |
0.162365 |
0.0201 |
||||
|
Freundlich Model |
||||||||
|
EB |
Co mg/l |
Log Ce |
Log qe |
1/n |
n |
Kf |
R2 |
|
|
100 |
0.603361 |
1.9822 |
0.206462 |
4.84350 |
73.480 |
0.906 |
||
|
150 |
1.170965 |
2.1309 |
||||||
|
200 |
1.711984 |
2.1716 |
||||||
|
250 |
1.800511 |
2.2714 |
||||||
|
MG |
100 |
0.57461 |
1.983378 |
0.79881 |
1.251863 |
33.972 |
0.990 |
|
|
200 |
0.939968 |
2.281695 |
||||||
|
250 |
1.027513 |
2.379026 |
||||||
|
300 |
1.181157 |
2.454577 |
||||||
3.7 Thermodynamic parameters
The different initial concentrations of each dye solution were studied at 100, 150, 200, 250 ppm for EB dye and 100, 200, 250, 300 ppm for MG dye with various temperatures at 25, 35, 45 and 55℃ in order to obtain the sufficient information about how adsorption mechanism employs in systematic of the solid- liquid by utilizing to estimate the thermodynamic functions like the standard of Gipps free energy ∆Gº, the changing of enthalpy ∆Hº and the changed of entropy ∆Sº which are extracted from Vant Hoff and Gipps equations as the following [21, 31, 32]:
K=\frac{Cs}{Cl}and~LnK=\left( ∆S{}^\circ \frac{1}{R} \right)-\left( ∆H{}^\circ \frac{1}{RT} \right) ∆Gº= -RT LnK and ∆Gº=∆Hº - T∆Sº (5)
where, K is constant, CS is represented the dye concentration onto adsorbent surface after adsorbing occurs, while the CL is the dye concentration of solution in equilibrium state, T is absolute temperature and R is represented the universal gas constant 8.314 J mol-1K-1. The thermodynamic functions after computing that referred to appear all values of the Gipps free energy under the differed temperatures were recorded as the negative value, which indicates the reaction between dyes molecules for EB and MG with decorated functionalized MWCNTs are spontaneous occurred in Table 3. Moreover, the rinsed spontaneous reaction to adsorb dye molecules onto adsorbent surface toward the decreased temperatures which is confirmed the physical adsorption occurred [34]. The adsorption process for removing EB and MG molecules onto functionalized multiwalled carbon nanotubes after decorating by ZnO and Ag2O recorded the negative values of the changed enthalpy ∆Hº at all concentrations, which are refer to the adsorption process is exothermic excepted the concentration at 250 ppm is endothermic to each the dyes adsorption [35]. The changed entropy function was recorded as the positive values for adsorbing MG and EB dyes at all concentrations except the concentration at 100 and 150 ppm for EB dye is recorded the negative value. In general, the positive values to the changed enthalpy function that refers to increase the randomness and affinity for adsorbing of the dye molecules onto adsorbent surface. The thermodynamic parameter results for adsorbing EB and MG dyes onto nanocomposite f-MWCNT surface are listed in Table 3.
Table 3. The thermodynamic function results
|
Dye Name |
Co mg/l |
∆Hº KJ/mol |
∆Sº KJ/mol/K |
∆Gº KJ/mol |
|||
|
298 ºK |
308 ºK |
318 ºK |
328 ºK |
||||
|
EB |
100 |
38.61254 |
0.15537 |
-7.8661 |
-8.8335 |
-11.054 |
-12.318 |
|
150 |
-0.03384 |
0.01718 |
-5.47625 |
-4.77679 |
-5.56381 |
-5.8289 |
|
|
200 |
-5.98002 |
-0.01141 |
-2.6224 |
-2.39662 |
-2.34746 |
-2.26457 |
|
|
250 |
-14.5184 |
-0.04034 |
-2.6866 |
-1.85937 |
-1.55194 |
-1.47679 |
|
|
MG |
100 |
-1.18142 |
0.023417 |
-8.2784 |
-8.1261 |
-8.79424 |
-8.84584 |
|
200 |
2.338737 |
0.033273 |
-7.46005 |
-8.02632 |
-8.39131 |
-8.42488 |
|
|
250 |
-2.41365 |
0.018584 |
-7.81211 |
-8.41528 |
-8.2072 |
-8.48633 |
|
|
300 |
6.54092 |
0.044487 |
-6.69323 |
-7.16183 |
-7.68291 |
-7.99597 |
|
Multiwalled carbon nanotubes were used after their oxidation for forming new functional groups, and then it employed to bond with the prepared nano oxides in the current works as zinc oxide and silver oxide by utilizing the hydrothermal method. The prepared nanocomposite was employed to remove two dyes which are classified as anionic (EB) and cationic (MG) dyes from their aqueous solution after examining and selecting the best optimum conditions as equilibrium time, temperature, pH level and agitation speed to obtain the highest adsorption efficiency for MG and EB dyes. The adsorption of EB dye onto decorated f-MWCNts was recorded at a higher removal percentage than MG dye. However, the adsorption system for MG dye was in unison with the Freundlich isotherm and recorded the highest adsorption capacity more than the adsorption system for EB dye that fits with the Langmuir isotherm. In general, the adsorption system to remove each dye obeyed the physical adsorption that occurred. We recommended reaching the best optimum condition by using other metals or metal oxide for decorating MWCNT and studying the other factors that affect the adsorption process.
This work is supported by Chemistry Department, College of Education for Pure Sciences, University of Basrah, Iraq, as a part of the Master graduation requirements.
[1] Ibrahim Khan, K.S., Khan, I. (2019). Nanoparticles: Properties, applications and toxicities. Arabian Journal of Chemistry, 12(7): 908-931. https://doi.org/10.1016/j.arabjc.2017.05.011
[2] Aslam, Z., Yousaf, I., Zahir, A., Akhtar, A. (2021). Adsorptive performance of MWCNTs for simultaneous cationic and anionic dyes removal; kinetics, thermodynamics, and isotherm study. Turkish Journal of Chemistry, 45(4): 1189-1200. https://doi.org/10.3906/kim-2005-12
[3] Chaurasia, Y.S. (2024). Ceramic nanocomposites reinforced with multi-walled carbon nanotubes (MWCNTs) for aerospace engineering. International Journal for Multidisciplinary Research, 6(1): 1-7. https://doi.org/10.36948/ijfmr.2024.v06i01.12212
[4] Wepasnick, K.A., Smith, B.A., Bitter, J.L., Howard Fairbrother, D. (2010). Chemical and structural characterization of carbon nanotube surfaces. Analytical and bioanalytical chemistry, 396: 1003-1014. https://doi.org/10.1007/s00216-009-3332-5
[5] Al-Tememi, M.K., Al-Mosawi, W.M., Abdulnabi, Z.A. (2019). Monitoring the change of water level and its effect on water quality in Sawa Lake, Southwest Iraq. Iraqi Journal of Science, 60(10): 2177-2185. https://doi.org/10.24996/ijs.2019.60.10.11
[6] Abdulnabi, Z.A. (2020). Assessment of free and total cyanide levels in the water environment of Shatt Al-Arab. Indonesian Journal of Chemistry, 20(4): 880-886. https://doi.org/10.22146/ijc.47369
[7] Salah, L.S., Ouslimani, N., Bousba, D., Huynen, I., Danlée, Y., Aksas, H. (2021). Carbon nanotubes (CNTs) from synthesis to functionalized (CNTs) using conventional and new chemical approaches. Journal of Nanomaterials, 2021(1): 4972770. https://doi.org/10.1155/2021/4972770
[8] Emenike, E.C., Adeleke, J., Iwuozor, K.O., Ogunniyi, S., et al. (2022). Adsorption of crude oil from aqueous solution: A review. Journal of Water Process Engineering, 50: 103330. https://doi.org/10.1016/j.jwpe.2022.103330
[9] Baker, J.R., Williams, E.G. (1965). The use of methyl green as a histochemical reagent. Journal of Cell Science, 3(73): 3-13. https://doi.org/10.1242/jcs.s3-106.73.3
[10] Demirkol, O., Gümüşay, Ö.A., Cerit, I. (2019). Effect of erythrosine and phloxine from xanthene food dyes on oxidative stress in Chinese hamster ovary cells. Food Science and Technology, 40(4): 1009-1013. https://doi.org/10.1590/fst.27819
[11] Seow, Z.L.S., Wong, A.S.W., Thavasi, V., Jose, R., Ramakrishna, S., Ho, G.W. (2008). Controlled synthesis and application of ZnO nanoparticles, nanorods and nanospheres indye-sensitized solar cells. Nanotechnology, 20(4): 045604. https://doi.org/10.1088/0957-4484/20/4/045604
[12] Ekennia, A.C., Uduagwu, D.N., Nwaji, N.N., Oje, O.O., et al. (2021). Green synthesis of biogenic zinc oxide nanoflower as dual agent for photodegradation of an organic dye and tyrosinase inhibitor. Journal of Inorganic and Organometallic Polymers and Materials, 31(2): 886-897. https://doi.org/10.1007/s10904-020-01729-w
[13] Haq, S., Afsar, H., Ali, M.B., Almalki, M., Albogami, B., Hedfi, A. (2021). Green synthesis and characterization of a ZnO-ZrO2 heterojunction for environmental and biological applications. Crystals, 11(12): 1502. https://doi.org/10.3390/cryst11121502
[14] Aftab, K., Naseem, T., Hussain, S., Haq, S., Waseem, M. (2023). Synthesis and characterization of Ag2O, CoFe2O4, GO, and their ternary composite for antibacterial activity. Environmental Science and Pollution Research, 30(2): 4079-4093. https://doi.org/10.1007/s11356-022-22516-9
[15] Al-Shawi, A. A. A., Hameed, M. F., Hussein, K. A., Neamah, H. F., Luaibi, I. N. (2021). Gas Chromatography-mass spectrometry analysis of bioactive compounds of Iraqi Truffle Terfezia claveryi (Ascomycetes), synthesis of silver nanoparticles, and appraisal of its biological activities. International journal of medicinal mushrooms, 23(3):79-89. https://doi.org/10.1615/IntJMedMushrooms.2021037706
[16] Silva, W.M., Ribeiro, H., Seara, L.M., Calado, H.D., et al. (2012). Surface properties of oxidized and aminated multi-walled carbon nanotubes. Journal of the Brazilian Chemical Society, 23: 1078-1086. https://doi.org/10.1590/S0103-50532012000600012
[17] Saleh, S.M., Abdulwahid, A.A., Kadhim, Z.N. (2024). Solid phase-fabrication of multi-walled carbon nanotubes and their derivatives for efficient extraction and analysis of Bismarck Brown-Y Dye from aqueous solution. Analytical Methods in Environmental Chemistry Journal, 7(1): 49-64. https://doi.org/10.24200/amecj.v7.i01.307
[18] Abdulnabi, Z.A., Al-doghachi, F.A.J., Abdulsahib, H.T. (2021). Synthesis, characterization and thermogravimetric study of some metal complexes of selenazone ligand nanoparticles analogue of dithizone. Indonesian Journal of Chemistry, 21(5): 1231-1243. https://doi.org/10.22146/ijc.65763
[19] Hoa, L.T.M. (2018). Characterization of multi-walled carbon nanotubes functionalized by a mixture of HNO3/H2SO4. Diamond and Related Materials, 89: 43-51. https://doi.org/10.1016/j.diamond.2018.08.008
[20] Abdulnabi, Z.B.A., Faris, H.T.A., Al-doghachi, A.J. (2021). Synthesis and characterization of some selenazone complexes and nanoadsorbent surfaces from industrial waste for removing some carcinogenic dyes and heavy metals from water. Doctoral thesis, University of Basrah, Basrah, Iraq.
[21] Abdulnabi, Z.A., Abdulsahib, H., Al-doghachi, F. (2022). Extraction of nanomaterial from soot waste as low cost adsorbent for removal of some carcinogenic dyes from aqueous solution. Indian Journal of Ecology, 49(18): 610-617.
[22] Hammood, A.Y., AL-Tememi, M.K., Abdulnabi, Z.A., Majed, A.A. (2024). Synthesis of magnetic spinal ferrite CrFe2O4 nanoparticles and uses them to remove lead and cadmium ions from aqueous solutions. Advances in Natural Sciences: Nanoscience and Nanotechnology, 15(4): 045015. https://doi.org/10.1088/2043-6262/ad7c1c
[23] Hasani, N., Selimi, T., Mele, A., Thaçi, V., Halili, J., Berisha, A., Sadiku, M. (2022). Theoretical, equilibrium, kinetics and thermodynamic investigations of methylene blue adsorption onto lignite coal. Molecules, 27(6): 1856. https://doi.org/10.3390/molecules27061856
[24] Al-Abdullah, Z., AL-Shawi, A.A., Aboud, M.N., Al Abdul Aziz, B., QM Al-Furaiji, H., Luaibi, I.N. (2020). Synthesis and analytical characterization of gold nanoparticles using microwave-assisted extraction system and study their application in degradation. Journal of Nanostructures, 10(4): 682-690. https://doi.org/10.22052/JNS.2020.04.001
[25] Fresneda, M.A.R., Martín, J.D., Bolívar, J.G., Cantos, M.V.F., Bosch-Estévez, G., Moreno, M.F.M., Merroun, M.L. (2018). Green synthesis and biotransformation of amorphous Se nanospheres to trigonal 1D Se nanostructures: impact on Se mobility within the concept of radioactive waste disposal. Environmental Science: Nano, 5(9): 2103-2116.1039/C8EN00221E
[26] Abdel-Ghani, N.T., El-Chaghaby, G.A., Helal, F.S. (2015). Individual and competitive adsorption of phenol and nickel onto multiwalled carbon nanotubes. Journal of Advanced Research, 6(3): 405-415. https://doi.org/10.1016/j.jare.2014.06.001
[27] Bahreini, H., Ameri, E., Ebadi-Dehaghani, H. (2023). The effect of multi-walled carbon nanotubes on CO2/N2 separation using sulfonated polyether ether ketone/polyetherimide nano composite membrane. Journal of Advanced Materials and Processing, 1(1): 13-24. https://doi.org/10.71670/jmatpro.2024.981651
[28] Kachere, A.R., Kakade, P.M., Kanwade, A.R., Dani, P., Rondiya, S.R., Dzade, N.Y., Bhosale, S.V. (2021). Zinc oxide/graphene oxide nanocomposites: Synthesis, characterization and their optical properties. ES Materials & Manufacturing, 16(6): 19-29. https://doi.org/10.30919/esmm5f516
[29] Fooladsaz, K., Negahdary, M., Rahimi, G., Habibi-Tamijani, A., et al. (2012). Dopamine determination with a biosensor based on catalase and modified carbon paste electrode with zinc oxide nanoparticles. International Journal of Electrochemical Science, 7(10): 9892-9908. https://doi.org/10.1016/S1452-3981(23)16246-8
[30] Cheng, X., Zhong, J., Meng, J., Yang, M., et al. (2011). Characterization of multiwalled carbon nanotubes dispersing in water and association with biological effects. Journal of Nanomaterials, 2011(1): 938491. https://doi.org/10.1155/2011/938491
[31] Mizhir, A.A., Abdulwahid, A.A., Al-Lami, H.S. (2020). Adsorption of carcinogenic dye Congo red onto prepared graphene oxide-based composites. Desalination and Water Treatment, 202: 381-395. https://doi.org/10.5004/dwt.2020.26141
[32] Mizhir, A., Abdulwahid, A., Al-Lami, H. (2020). Chemical functionalization graphene oxide for the adsorption behavior of Bismarck brown dye from aqueous solutions. Egyptian Journal of Chemistry, 63(5): 1679-1696. https://doi.org/10.21608/ejchem.2020.21260.2271
[33] Bonilla-Petriciolet, A., Mendoza-Castillo, D.I., Reynel-Ávila, H.E. (2017). Adsorption Processes for Water Treatment and Purification. Berlin: Springer.
[34] Lafi, R., Montasser, I., Hafiane, A. (2019). Adsorption of congo red dye from aqueous solutions by prepared activated carbon with oxygen-containing functional groups and its regeneration. Adsorption Science & Technology, 37(1-2): 160-181. https://doi.org/10.1177/0263617418819227
[35] Ebelegi, A.N., Ayawei, N., Wankasi, D. (2020). Interpretation of adsorption thermodynamics and kinetics. Open Journal of Physical Chemistry, 10(3): 166-182. https://doi.org/10.4236/ojpc.2020.103010