Rehail Yasser*![]() | Zennir Youcef
| Zennir Youcef![]() | Tchouar Noureddine
| Tchouar Noureddine![]()
© 2025 The authors. This article is published by IIETA and is licensed under the CC BY 4.0 license (http://creativecommons.org/licenses/by/4.0/).
OPEN ACCESS
This study aims to present a complete methodology that integrates evaluation and optimization to address the entire Safety Instrumented Systems (SIS) lifecycle. A comprehensive methodology for SIS evaluation and optimization is proposed, specifically targeting a system, called I-1165, responding to a high-high level alarm in a De-ethanizer Reflux Drum V-2, which is used to separate ethane and lighter components from heavier hydrocarbons. The methodology begins with a comprehensive HAZOP study to identify and assess potential risks, which are then estimated using PHAST software. SIL allocation is performed using the LOPA method, followed by the determination of Achieved SIL through analytical formulas. The Achieved SIL is iteratively validated by comparing it with the Required SIL. If the Achieved SIL does not meet the required standards, a genetic algorithm (GA) is employed to optimize the SIS design and maintenance strategies. This process continues until the target SIL is achieved, or an alternative architecture is proposed, ensuring that the SIS performance aligns with safety requirements. Optimization results for the I-1165 system reveal a significant improvement in PFDAvg from 2.1E-2 to 6.10537E-4, meeting and exceeding the required SIL 2 performance. This improvement not only enhances system safety and reliability but also ensures compliance with IEC 61508 standards while reducing lifecycle costs by optimizing the frequency of maintenance and testing intervals.
SIS, hazard and operability (HAZOP), layers of protection analysis (LOPA), petrochemical industry, PHAST software, GA
Safety Instrumented Systems malfunction can cause severe effects in the petrochemical industry, where hazardous chemicals are handled and processed daily. When abnormal conditions are detected, SISs automatically intervene to safeguard and prevent catastrophic events like fires, explosions, and toxic releases. The design and implementation of SISs are crucial for ensuring the safe operation of industrial processes and reducing the risks of potentially hazardous events.
The IEC 61508 and IEC 61511 standards in the study [1, 2], present SIS requirements for all phases in the SIS lifecycle and have become leading standards for SIS specification, design, implementation, and operation. IEC 61508 is a generic standard common to several industries, whereas IEC 61511 has been developed especially for the process industry. A SIS is a collection of one or more input components (such as sensors and transmitters), logic solvers (such as programmable logic controllers [PLC]), and one or more end elements (such as safety valves). This concept is introduced by the standard mentioned above, which serves as a guide for achieving functional safety in the design of electrical / electronic / programmable electronic safety-related systems. The determination of the Safety Integrity Level (SIL) is a key requirement in the development of SIS, which specifies the target probability of failure-on-demand (PFDAvg) for the safety function [1]. To make sure the SIL achieves the necessary SIL target, it must be designed, implemented, and validated after it has been established [3]. Nonetheless, the process of designing and validating SIS can be complex, encompassing multiple methodologies like HAZOP, LOPA, FTA, Markov chain, and Petri net approaches.
Traditional approaches to Safety Integrity Level (SIL) evaluation have primarily focused on the three fundamental steps outlined in the 61508 and IEC 61511 standards. The first step involves conducting a comprehensive risk analysis to identify potential hazards, assess their severity, and determine their likelihood of occurrence. Based on this analysis, the required SIL is determined, which specifies the target probability of failure on demand for the safety function. The second step focuses on designing and implementing a SIS to meet the required SIL target. Finally, the third step involves verifying whether the realized SIS, referred to as the Real SIL, satisfies or exceeds the required SIL level. This verification process often employs techniques such as fault tree analysis [2], Markov models [3], or Petri net [4] simulations to quantify the probability of failure on demand and ensure compliance with specified SIL requirements.
Following the IEC 61508 standard, Omeiri et al. [5] conducted a safety integrity evaluation of a butane tank overpressure evacuation system. This evaluation was comprised of risk analysis through Fault Tree Analysis (FTA) and HAZOP, SIS design utilizing Markov Models and Petri Net Simulations, and verification through Layer of Protection Analysis (LOPA) and FTA. In other work, Boudjoghra and Innal [6] employed a combination of HAZOP, LOPA, and the SIL module to verify the safety integrity level of the same butane tank system. Zhao et al. [7] focused on using Monte Carlo simulation and stochastic Petri nets to evaluate the SIS performance. Kaczor et al. [8] conducted a thorough investigation into the verification of SIL by applying Reliability Block Diagrams (RBD) and Monte Carlo simulation. Zennir et al. [9] evaluated the safety instrumented system located at the Skikda refinery using a combination of HAZOP, LOPA, and FTA techniques to evaluate the effectiveness of the existing safety integrity level. Traditional approaches to SIS's main goal have been to confirm that the real SIL, meets or exceeds the required SIL established during the risk analysis stage. While this verification process is essential for guaranteeing compliance with functional safety regulations, it ignores other critical aspects like system availability, reliability, and lifecycle costs. Moreover, the lack of integration with optimization techniques limits the potential for improving SIS design and maintenance strategies to enhance both performance and cost-effectiveness.
On the other hand, several researchers have focused on the optimization side of SIS design and maintenance. The optimization of SIS was introduced by Torres-Echeverria et al. [10], who focused on policy testing and the use of genetic algorithms (GAs) in multi-objective optimization to balance performance metrics like lifecycle costs (LCC), spurious trip rate (STR), and probability of failure on demand (PFDavg). A variety of optimization techniques, such as GA, PSO, and stochastic modeling, have been used in other studies to optimize SIS architectures, maintenance plans, and performance metrics while taking safety, environmental, and economic considerations into account. Eddine et al. [11] focused on minimizing spurious trip rates in emergency shutdown systems installed in combined cycle power plants by optimizing Safety SIS using Particle Swarm Optimization (PSO). Redutskiy [12] developed a mathematical model for SIS design optimization in a generalized form as a multi-objective problem, intending to achieve the necessary target SIL prescribed by safety regulations. Rabah et al. [13] optimized SIS maintenance strategies to meet SIL requirements, as optimal control problems by investigating the financial impact of proof tests, including direct costs (such as manpower, equipment, and transportation) and indirect costs (such as production losses and gas flaring tax. A mathematical optimization model has been proposed by Cheraghi et al. [14] to determine Safety Integrity Levels in process facilities, balancing cost and reducing risks. Touahar et al. [15] proposed a multi-objective genetic algorithm to optimize SIS by minimizing PFDavg, STR, and LCCavg, with specific maintenance strategies to reduce technical, economic, and environmental risks. Zhang et al. [16] focused on optimizing maintenance strategies for SISs by modeling the degradation of SIS final elements as a stochastic process. Finally, Berrah et al. [17] applied the Manta-Ray Foraging Optimization (MRFO) algorithm to optimize the design and operation of SIS aiming to obtain a balance between safety integrity, operational performance, and lifecycle costs. These contributions have expanded the scope of SIS optimization. however, they exclusively focus just on the optimization phase, often assuming that the evaluation processes, such as SIL allocation and validation, have already been satisfactorily completed. This separation of evaluation and optimization can result in suboptimal solutions that fail to address the interconnected challenges of safety, reliability, and cost.
This study aims to employ an innovative, complete methodology for the design, evaluation, and optimization of SISs within a unified framework. Our approach encompasses the entire SIS lifecycle, starting with risk analysis through HAZOP study and PHAST software, followed by SIL allocation using LOPA. The SIS realization phase employs analytical formulas to determine the Real SIL, which is then validated against the required SIL in alignment with established IEC standards. If the Achieved SILis below the required SIL, we optimize the SIS design and maintenance strategy using the GA. This integrated approach ensures that the SIS meets necessary safety integrity standards and operates optimally in terms of cost, performance, and dependability.
The novelty of the proposed methodology lies in its comprehensive integration of evaluation and optimization, addressing the full lifecycle of SISs. Unlike traditional methods that focus primarily on SIL verification or isolated optimization, this approach provides a unified framework that ensures both safety compliance and operational efficiency. By linking risk assessment, SIL allocation, realization, validation, and iterative optimization, it not only guarantees the required safety standards but also enhances system performance, reliability, and cost-effectiveness across all phases of the SIS lifecycle. Another significant contribution of this work is its application to a real-world system, the De-ethanizer Reflux Drum (30-V-2) located in the RA1k refinery of Skikda/Algeria. Unlike theoretical or generalized optimization studies, the methodology addresses specific operational challenges within an industrial setting.
The rest of the paper is structured as follows. Section 2 presents the Hazard Analysis Methods for SISs, detailing HAZOP and LOPA used for risk identification and SIL allocation. Section 3 describes the methodology for evaluating and optimizing the SIS using GA, highlighting the process of determining the Achieved SIL and performing iterative optimization. Section 4 discusses the optimization process results, including identifying a new optimal SIS architecture and its impact on system performance. Finally, the conclusions from the SIS evaluation and optimization study are presented in Section 5.
The proposed methodology for the evaluation and optimization of SIS comprises five key steps, as illustrated in Figure 1.
Figure 1. Proposed methodology for SIS lifecycle management
These steps are designed to provide a comprehensive and systematic approach to address the critical aspects of risk analysis, SIL allocation, SIS realization, validation, and optimization. The five main steps of our methodology for SIS evaluation and optimization are explained below:
Step 1: Risk analysis
The risk analysis stage is essential for locating possible risks and assessing their effects. Several well-known risk analysis techniques have been used in this phase, including Fault Tree Analysis (FTA), Hazard and Operability (HAZOP), Failure Modes, Effects, and Criticality Analysis (FMECA), and Preliminary Hazard Analysis (PHA) [18, 19]. Studies on HAZOP are widely utilized techniques, especially in the petrochemical industry [20]. The study is carried out by a multidisciplinary team that divides the plant into streams (which represent particular products or utility materials) and nodes (which represent strategic equipment and sections). To find possible departures from the design intent, the team uses a set of guidelines (like no, more, and less) along with process parameters (like temperature, flow, and pressure). The team looks into the causes, effects, and current safeguards for each deviation that is found; it then looks for any gaps and suggests adding new safeguards as needed. Potential accident scenarios and their effects, such as fires, explosions, or toxic releases, are identified through the HAZOP study process [21]. To support the risk analysis process, modeling and calculation programs like PHAST and ALOHA can be used in addition to the HAZOP study [22, 23]. PHAST (Process Hazard Analysis Software Tool) is selected to quantitatively model the consequences of hazardous scenarios. PHAST, developed by DNV, is a comprehensive software tool widely used in the industry to simulate the progression of accidental releases, such as gas leaks, fires, explosions, and toxic dispersions [24]. It provides critical outputs, including safety distances, thermal radiation contours, overpressure levels, and toxic exposure zones. While HAZOP identifies potential deviations, their causes, and qualitative consequences, PHAST completes the HAZOP analysis by simulating the physical progression of identified scenarios, such as vapor cloud dispersion or pool fires [25]. This integration allows for a more detailed understanding of the potential impacts, supporting the prioritization of risks and the design of effective mitigation measures. The consequence analysis using the PHAST Software involves the following steps:
Scenario selection: Hazardous events identified in the previous phases are selected for consequence modeling.
Input data preparation: Process parameters, environmental conditions, and chemical properties are entered into the software.
Simulation and analysis: PHAST generates consequence reports including impact zones and thermal radiation levels.
Step 2: SIL allocation
The allocation of a Safety Integrity Level (SIL) is a critical step in the design of SIS, ensuring that the system provides a quantitative measure of the effectiveness of safety functions in controlling risk to an acceptable level. The SIL provides a statistical measure of the reliability of SIS when faced with a process demand. According to IEC 61508, there are four distinct SIL categories, ranging from SIL 1 (lowest) to SIL 4 (highest). Each of these levels is associated with a specific range of values for both the average probability of failure on demand (PFDAvg) and the probability of a dangerous failure per hour (PFH). These Relationship is illustrated in Table 1. The two common methods used for SIL allocation are Risk Graph and LOPA.
Risk Graph is a qualitative technique used to assign SILs based on predefined criteria related to consequences severity, exposure frequency, hazard avoidance probability, and demand rate on safety functions [26, 27]. While the Risk Graph method is simpler and easier to apply, it lacks precision compared to LOPA as it relies on subjective judgments rather than exact probabilities and frequencies [28]. This qualitative nature can lead to inconsistencies in SIL determination, particularly in complex industrial processes where numerical data is more readily available [29]. The method's reliance on subjective assessments may introduce uncertainties in SIL assignments, highlighting the importance of considering more quantitative approaches like LOPA in certain contexts.
Table 1. Safety integrity level (SIL) according to PFDavg and PFH [1]
|
Safety Integrity Level (SIL) |
Probability of Failure on Demand (PFDAvg) |
Probability of Failure Per Hour (PFH) |
|
4 |
≥10-5 to <10-4 |
≥10-9 to <10-8 |
|
3 |
≥10-4 to <10-3 |
≥10-8 to <10-7 |
|
2 |
≥10-3 to <10-2 |
≥10-7 to <10-6 |
|
1 |
≥10-2 to <10-1 |
≥10-6 to <10-5 |
LOPA is a semi-quantitative method that enables determining the minimum SIL necessary to lower the risk levels of SISs to acceptable levels [30, 31]. This method bases its calculation on the number of independent protection levels required to control the risk in each hazardous situation. The LOPA technique begins with information gathered during hazard identification, typically through a HAZOP study. It addresses each identified hazard by documenting both the initiating causes and the protective measures that prevent or mitigate the hazard. The fundamental approach of LOPA is to calculate the frequency of a hazardous event (impact event) by quantifying the initiating causes, frequencies, and probability of failure on demand for each protective layer [32, 33]. The Intermediate event frequency can be formulated as follows:
fc=fIE∗∏iPFDiavg (1)
fc: occurrence frequency of consequence C
fIE: initiating event frequency
PFDiavg:: Average probability of failure on demand of the barrier i.
The required risk reduction allocated to the SIS safety function is obtained by comparing with the maximum allowable average probability of failure that the SIS could have, such that the necessary risk reduction is achieved. Reading this quantity in Table 1 makes it possible to define the corresponding SIL.
PFDSISavg≤ftfIE∗∏iPFDiavg (2)
Comparing the frequency of the feared event to the safety objective (tolerable frequency) yields the assigned risk reduction for the SIS safety function. The inequality's right-hand side quantity represents the SIS's maximum allowable average failure probability that would achieve the required risk reduction. Consulting Table 1 with this quantity enables the determination of the corresponding SIL.
Step 3: SIS realization
After assigning the necessary SIL, the SIS must demonstrate performance that meets the corresponding criteria. Several methodologies have been used to calculate the Probability of Failure on Demand (PFDavg) and determine the Achieved SIL, such as Markov models [3], Petri nets [3], and FTA [3]. However, these techniques may have limitations when integrated into optimization frameworks due to their computational complexity and difficulty in handling large search spaces efficiently. For these computations, we employ the generalized analytical equations established by Innal et al. [34]. The computed result should not exceed the threshold value set during the required SIL stage. This quantitative assessment necessitates the evaluation of multiple factors: the system's architecture (including the number of components used and their voting logic), failure rates, diagnostic coverage, intervals between periodic tests, time required for repairs, and common cause failures.
Step 4: SIS validation
In this step, a comparison between the determined required and Achieved SILs is made. The SIS is considered to meet its requirements if the Achieved SIL is equal to or greater than the required SIL. This indicates that the SIS can provide the necessary risk reduction assigned to it, thus fulfilling the security objective. It is crucial to record the comparison results, including the methodologies used to calculate the actual SIL, data origins, assumptions, and any conducted verification tests. This documentation acts as proof of adherence to relevant safety standards, such as IEC 61508 and IEC 61511. However, if the Achieved SIL is lower than the required SIL, the SIS must be enhanced to ensure the actual SIL meets or surpasses the required level.
Step 5: SIS optimization
If the realized SIS does not meet the required Safety Integrity Level (SIL), the methodology advances into the optimization phase. In this step, the SIS architecture is iteratively modified and enhanced until the required SIL is achieved. The optimization process explores various architectural configurations by considering parameters such as the number of elements used and their voting logic, failure rates, diagnostic coverage, periodic test intervals, repair time, and common cause failures. This iterative process continues until a solution is identified that meets the SIL requirements.
In this step, the GA was selected as the most suitable optimization method due to its efficiency in handling complex, non-linear problems, particularly those involving single-objective functions like minimizing the Probability of Failure on Demand (PFDavg) [34]. The optimization of PFDavg involves exploring a vast search space defined by various decision variables, including the number of components in each subsystem (sensors, logic solvers, and final elements), their voting logic configurations (e.g., KooN), and proof-test intervals [35]. This non-linear problem is characterized by interactions among these variables, which influence the PFDavg in complex ways. The use of GAs in SIS optimization facilitates the discovery of architectural configurations that satisfy the required SIL while optimizing other critical parameters. Readers can consult research by Sohail [36], Gen [37], and Katoch at al. [38] for a thorough examination of GAs and their uses.
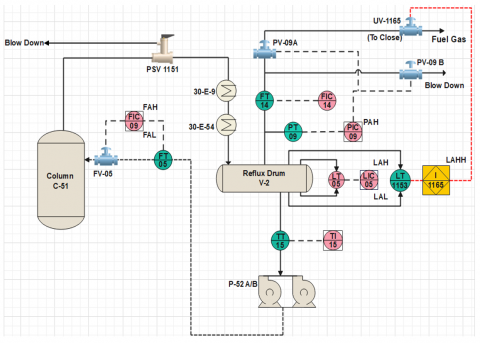
The De-ethanizer Reflux Drum (30-V-2) plays a pivotal role in the separation process of lighter hydrocarbons (C1 and C2) from LPG. Operating at a pressure of 33.4 kg/cm²g and a temperature of 68℃, this drum serves as an accumulator for the condensed vapors from the overhead of the De-ethanizer Column (30-C-51). The column itself, designed with 25 trays, operates at a top pressure and temperature of 29.6 kg/cm²g and 61℃ and a bottom pressure and temperature of 29.9 kg/cm²g and 118℃, respectively. The column separates lighter hydrocarbons from heavier components through fractional distillation. The vapors from the column's overhead are condensed in the De-ethanizer Overhead Condensers (30-E-9 and 30-E-54), where their temperature is reduced from 53℃ to 38℃ using cooling water as the medium.
The condensed vapors are collected in the reflux drum (30-V-2), which not only provides liquid reflux to the column but also facilitates pressure stabilization and ensures that downstream processing receives a consistent flow of LPG. Pressure within the reflux drum is maintained by a split-range controller (30-PIC-9), which modulates the discharge through two control valves, 30-PV-9A and 30-PV-9B. These valves regulate the flow to the fuel gas header and blow-down header, respectively, ensuring the system's safety and operational efficiency. The overhead vapor flow rate is measured by flow indicator 30-FI-14, which provides crucial data for monitoring and control.
The liquid collected in the drum is pumped back to the De-ethanizer Column (30-C-51) using one of the two pumps, 30-P-52 A or B, depending on availability. The temperature of the liquid is monitored by temperature indicator 30-TI-15, and the flow is regulated by the flow controller 30-FIC-5, which adjusts the automatic control valve in the reflux line. The liquid is then distributed onto the 25th tray of the column, enabling efficient separation.
The level in the reflux drum is a critical parameter for safe and stable operation. It is monitored and controlled by level controller 30-LIC-5, which operates in cascade with 30-FIC-5 to ensure precise flow adjustments. In the event of abnormal level fluctuations, high and low-level alarms (30-LAH-5 and 30-LAL-5) send signals to the control room for immediate attention. The corresponding level flow diagram for the De-ethanizer Reflux Drum (30-V-2) is depicted in Figure 2.
Figure 2. Process flow diagram for De-ethanizer Reflux Drum (V-2) and associated control systems
3.1 Safety instrumented safety of De-ethanizer Reflux Drum (30-V-2)
The majority of the process control operations are handled by the BPCS, which acts as a second automated line of defense in the case of failure of the BPCS or due to any other condition that prevents the BPCS from controlling on its own. In our case, this action is ensured by the activation of interlock I-1165. The components of our SIS are presented in Table 2.
I-1165 is a Safety Instrumented System that responds to the critical high-high level alarm in the reflux drum, and its role is to automatically close the overhead line valve UV-1165 as a protective safety action to mitigate the overfill or overpressure risk in the drum. The level transmitter LT 1153 continuously measures the level in the reflux drum 30-V-2, and the level indicator LI 1153 displays this level for monitoring purposes. If the level in the drum exceeds a critical high-high setpoint, the logic solver LAHH 1153 is triggered. When LAHH 1153 is triggered, it activates the interlock system I-1165, which in turn closes the valve UV 1165 on the overhead line of the reflux drum. Closing UV 1165 prevents further vapors from entering the drum, mitigating the risk of overfilling.
Table 2. Components of I-1165
|
Element |
Type |
Process Function |
|
LT 1153 |
Level transmitter |
Detecting High Level in V-2 |
|
LS 1165 |
Logic solver |
Collects information from LT 1153 and transmits it to UV 1165 |
|
UV 1165 |
Control valve |
To close |
In what follows, the study approach will be applied to the reflux drum 30-V-2 described in the previous section.
4.1 Risk analysis
The first step involves thorough risk analysis to identify the potential risks associated with the industrial process under consideration. The HAZOP method is applied in this step concerning the deviation "High Level inside 30-V-2" which is given in Table 3.
The corresponding frequency table is presented in Tables 4 and 5, respectively. The risk matrix is a tool to classify and visualize risk by defining categories of consequences and occurrence frequency.
A risk matrix is a tool used to classify and visualize risks by combining qualitative assessments of consequence severity and occurrence frequency shown in Tables 4 and 5, respectively. These categories are then applied to the risk matrix in Table 6, which determines the overall risk level. For the analyzed risk (overpressure), the severity is classified as "Catastrophic S4." According to the RA1K risk acceptance criteria, the risk is tolerable only if its frequency falls within the "Very Low P2" category. From Table 6, the corresponding maximum tolerable frequency for this risk level is:
FT = 1E-5/year.
Table 3. Application of the HAZOP method for "High Level" deviation
|
Deviation |
Causes |
Consequences |
Safeguards |
Criticality |
||
|
Parameter |
Guide Word |
S |
P |
|||
|
Level |
High |
Cascading control loops BPCS 9 of level and BPCS 9 of flow failure: LT 5 failures LIC 5 failures FIC 5 failures FV 5 failures (does not open) Pumps P-52A/B fail to suck and reflux the accumulated liquid to the overhead of column 30-C-51. |
Loss of containment, leading to the release of LPG into the atmosphere (Leak) Overpressure Vapor cloud explosion (VCE) Flash fire/ Pool fire |
LAH on LIC 5 FAH on FIC 5 Interlock 1165 (close UV 1165) |
4 |
2 |
Table 4. RA1K Severity scale [39]
|
Severity |
Zone Related to Significant Lethal Effects |
Zone Related to First Lethal Effects |
Zone Related to Irreversible Effects |
|
Minor |
No exposed person |
At most 1 exposed person |
Less than 10 exposed persons |
|
Serious |
At most 1 exposed person |
At most 10 exposed persons |
Between 10 and 100 exposed persons |
|
Important |
Important Between 1 and 10 exposed persons |
Between 10 and 100 exposed persons |
Between 100 and 1000 exposed persons |
|
Catastrophic |
Between 10 and 100 exposed persons |
Between 10 and 100 exposed persons |
Between 1000 and 10.000 exposed persons |
|
Disastrous |
More than 100 exposed persons |
More than 100 exposed persons |
More than 10000 exposed persons |
Table 5. RA1K occurrence frequency scale [39]
|
Scale |
1 |
2 |
3 |
4 |
5 |
|
Qualitative ranking |
Possible but extremely unlikely |
Very low |
low |
Moderate |
High |
|
Frequency/year |
F<10E-5 |
10E-4>F≥10E-5 |
10E-3>F≥10E-4 |
10E-2>F≥10E-3 |
F≥10E-2 |
Table 6. Risk acceptance matrix for RA1K [39]
|
Severity |
Frequency |
||||
|
P1 |
P2 |
P3 |
P4 |
P5 |
|
|
S5 |
M |
H |
H |
H |
H |
|
S4 |
M |
M |
H |
H |
H |
|
S3 |
M |
M |
M |
H |
H |
|
S2 |
L |
L |
M |
M |
H |
|
S1 |
L |
L |
L |
L |
M |
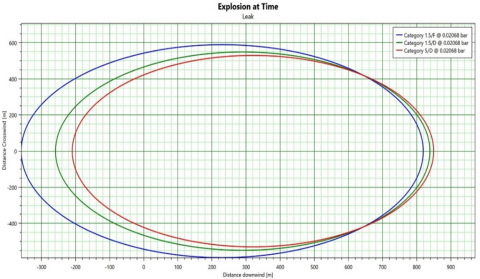
Figure 3. Predicted downwind distance vs. leak dispersion for different overpressure categories
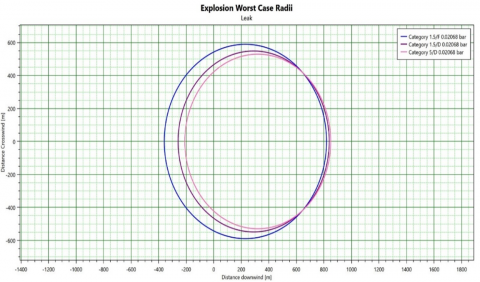
Figure 4. Maximum blast wave radii for various overpressure thresholds
To estimate the severity level, we use the PHAST Software to simulate threat zones. Figure 3 shows the distance downwind (in meters) against the distance traveled (in meters) for three different overpressure categories (Category 1.5/F, Category 1.5/D, and Category 5/D), while Figure 4 shows the maximum radii of the blast waves for the same three overpressure categories mentioned above.
The simulation results for the Reflux Drum V-2 equipment under the "Leak" scenario are summarized in Table 7. It lists the overpressure levels (in bar) and the corresponding maximum distances (in meters) and diameters (in meters) for each overpressure category and weather condition (Category 1.5/F, Category 1.5/D, and Category 5/D). The consequence analysis of the De-ethanizer Reflux Drum V-2 leak scenario, conducted using PHAST software, reveals potentially severe outcomes. The model predicts irreversible effects extending up to 849 meters and lethal effects up to 423 meters from the source, with impact zones varying significantly based on atmospheric conditions.
Table 7. Overpressure levels and the corresponding maximum distances and diameters of the leak scenario in V-2
|
Path |
Scenario |
Weather |
Effect threshold |
Overpressure level [bar] |
Maximum distance [m] |
Diameter [m] |
|
Study\Reflux Drum V-2 |
Leak |
Category 1.5/F |
Irreversible Effects Threshold (IET) |
0.02068 |
819.228 |
1178.46 |
|
Lethal effects threshold (LET 1%) |
0.1379 |
344.52 |
229.041 |
|||
|
Lethal effects threshold (LET 5%) |
0.2068 |
315.863 |
171.726 |
|||
|
Category 1.5/D |
Irreversible Effects Threshold (IET) |
0.02068 |
838.726 |
1097.45 |
||
|
Lethal effects threshold (LET 1%) |
0.1379 |
402.045 |
204.09 |
|||
|
Lethal effects threshold (LET 5%) |
0.2068 |
376.509 |
153.019 |
|||
|
Category 5/D |
Irreversible Effects Threshold (IET) |
0.02068 |
849.704 |
1059.41 |
||
|
Lethal effects threshold (LET 1%) |
0.1379 |
422.951 |
205.903 |
|||
|
Lethal effects threshold (LET 5%) |
0.2068 |
397.189 |
154.378 |
These findings underscore the critical necessity for a robust safety instrumented system and comprehensive emergency response protocols.
4.2 Allocation of the required SIL for SIS
The next step is to assign a suitable SIL to the SIS based on the risks that have been identified in the first step. The LOPA method is used for this allocation. It calculates the required SIL by assessing the risk reduction offered by different independent protection layers (IPLs).
The chosen impact event is Lighters C1/C2 release to the atmosphere from V-2 De-ethanizer Reflux Drum (Leak) due to failure of Basic Process Control Systems of level and flow level, which leads to a VCE if it is not mitigated. According to the severity levels in Table 4, the tolerable frequency corresponding to a hazardous event with severity 4 is set to 1E-5/year. The initiating cause of the undesired event is the pumps P-52A/B failing to suck and reflux the accumulated liquid inside V-2, which has a frequency value of 1E-1/year. The probabilities of failure on demand (PFDavg) of IPL that intervene to prevent the development of this impact event (Leak) are shown in Table 8 [40]. The obtained results during the application of the LOPA method are summarized in Table 9.
According to the LOPA analysis results, the required SIL for our SIS is SIL 2 with a minimum PFDAvg of 5E-3.
Table 8. IPLs and their PFDs [40]
|
IPL |
PFD |
|
LAH-5+operator action |
2E-1 |
|
FAH-5 +operator action |
2E-1 |
|
PSV 1151 A/B |
1E-1 |
Table 9. LOPA related to the impact event lighters C1/C2 released to the atmosphere
|
1 |
2 |
3 |
4 |
5 |
6 |
7 |
8 |
9 |
10 |
11 |
|
Impact Event Description |
Severity Level |
Initiating cause description |
Initiating Likelihood (Freq Per Year) |
Protection Layers (Probability of Failure) |
Intermediate event likelihood (freq per year) |
PFDAvg required (and SIL) |
Tolerable mitigate event likelihood |
|||
|
General Design |
Alarms & Operator Action |
Other Protection Devices |
Other Mitigation Measures |
|||||||
|
Lighters C1/C2 release to atmosphere from V-2 De-ethanizer Reflux Drum (Leak) |
4 |
P-52 A/B Failure |
1E-1 |
1 |
2E-1 |
1E-1 |
1 |
2E-3
|
5E-3 (SIL 02) |
1E-5 |
4.3 Realization of the SIS (real SIL)
To calculate the Achieved SIL, we employ the analytical formula for calculating the PFDavg as developed by Cheraghi and Taghipour [14] and Touahar et al. [15] which are detailed in the study of Zhao et al. [7] (see Eq. (3)).
PFDKOON=AN−K+1N∗λN−K+1Dind∗N−k+1∏i=1MDT100i+λccfDU(T12+MRT)+λccfDD∗MTTR (3)
where:
MDT100i=λDDλD∗MTTR+λDUλD∗(T1i+1+MRT) (4)
AN−K+1N=N!(K−1)! (5)
{λDD=λD∗DCλDU=λD∗(1−DC) (6)
The PFDKOON formula takes into account the dangerous failure rates (λD), mean time to repair (MTTR), and diagnostic coverage (DC) for each SIS component, including sensor LT 1153, logic solver LS 1165, and final element UV 1165. The λD parameter is further broken down into λDD (the detected dangerous failure rate) and λDU (the undetected dangerous failure rate), enabling a comprehensive assessment of the system's reliability performance (see Eq. (4)). The different reliability data used are shown in Table 10 [41].
Table 10. Reliability data of the SIS [41]
|
Components |
λD (h-1) |
DC (%) |
MTTR=MRT(h) |
T1 (h) |
|
LT 1153 |
1.4E-06 |
60 |
8 |
8760 |
|
LS 1165 |
3E-08 |
0 |
12 |
8760 |
|
UV 1165 |
3E-06 |
30 |
8 |
17520 |
Table 11. PFDavg of the SIS using Eq. (3) and FTA
|
Subsystem/System |
PFDavg using Eq. (01) |
PFDavg using FTA |
|
Sensor (S) |
2.464E-3 |
6.116E-3 |
|
Logic solver (LS) |
1.3167E-4 |
1.3168E-4 |
|
Final element (FE) |
1.84E-2 |
2.33E-2 |
|
SIS |
2.1E-2 |
2.94E-2 |
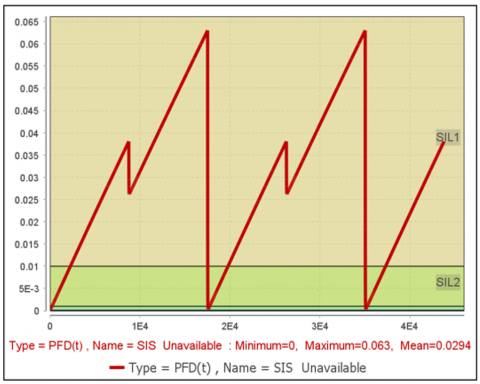
Figure 5. PFDavg and SIL graph of the SIS
Table 11 presents the calculated PFDavg values for the various subsystems and the overall SIS. A comparison with FTA results is provided to validate those obtained by Eq (3). Some slight differences are also present for the subsystems, which look insignificant for the whole SIS. Finally, the PFDavg of the SIS and the associated SIL graph are modeled using the Tree module of the GRIF software (Graphical interface for reliability forecasting) as shown in Figure 5.
4.4 Validation of SIS
In this step, we compare the Achieved SIL with the required SIL target determined by the LOPA method. The Achieved SILis quantified by calculating the PFDavg using the analytical formulas, while the required SIL corresponds to the minimum acceptable PFDavg value identified during the LOPA analysis. In our case study, the obtained PFDavg value for the current SIS design is 2.1E-2, corresponding to a Achieved SIL of 1. However, the LOPA results indicate that the minimum required PFDavg should be at least 5E-3, aligning with a target SIL 2. Since the Achieved SIL1 does not meet or exceed the required SIL 2, the risk associated with the current SIS design is unacceptable.
To address this issue and reduce the risk to an acceptable level, the SIS architecture needs to be optimized to achieve an Achieved SIL that meets or exceeds the required SIL target. Our proposed solution is to employ a Genetic Algorithm (GA) optimization technique to search for an optimal SIS architecture that minimizes the PFDavg while considering other performance metrics and constraints. The GA will explore various combinations of SIS component configurations, redundancy levels, and diagnostic coverage to identify architectures that can satisfy the required SIL while optimizing factors such as reliability, availability, and lifecycle costs.
4.5 Optimization of SIS design using GA
The objective of this optimization step is to minimize the average Probability of Failure on Demand (PFDavg) for our SIS, subject to the following constraints:
•PFDavg must be less than or equal to 5E-3 to ensure compliance with SIL 2 requirements.
•The total acquisition cost must not exceed 32,000 units.
•The total proof-test cost must not exceed 18,000 units.
These constraints are evaluated over a mission time (MT) of 20 years, ensuring that both safety and cost performance are optimized within the specified cost limits.
The fitness function used to evaluate potential solutions is defined by Eq. (3), which calculates the PFDavg using the KooN voting formula. The decision variables include the number of elements in each subsystem (N), the number of elements required for operation (K), the acquisition and proof-test costs (CP and CT), and the proof-test intervals (T). To achieve this, we set up a GA optimization problem in MATLAB, where the objective function calculates the PFDavg using the KooN formula for each subsystem, and the constraint function checks if the PFDavg satisfies the given limit.
Table 12. Encoding of the SIS solutions: SIS chromosomes
|
X1 |
X2 |
X3 |
X4 |
X5 |
X6 |
X7 |
X8 |
X9 |
X10 |
X11 |
X12 |
|
N1 |
K1 |
ST |
CSP CST |
N2 |
K2 |
LST |
|
N3 |
K3 |
FET |
CFEP CFET |
To find an optimal solution using the GA, it is necessary to represent potential solutions as coded expressions called chromosomes. In our SIS configuration, a chromosome consists of 12 genes (as shown in Table 12). These genes correspond to the decision variables of the optimization problem. After establishing the encoding, an initial population (generation) of potential solutions (individuals, each defined by a chromosome) is randomly created across the solution space. The decision variables are constrained within predetermined limits. The encoding for each subsystem includes the number of components and their operational specifications as follows:
N1, N2, and N3 represent the total number of components in the sensor, logic solver, and final element subsystems, respectively.
•K1, K2, and K3 represent the minimum number of components required to remain operational in each subsystem.
•TS, TLS, and TFE represent the proof-test intervals for each subsystem.
• CSP,CLSP,CFEP represent the acquisition costs for the sensor, logic solver, and final element subsystems.
• CST,CLST,CFET represent the proof-test costs for the sensor, logic solver, and final element subsystems.
The GA progressively enhances the makeup of the population across subsequent generations. As the generations advance, the population's adaptability, as measured by the objective function (fitness function), should typically show improvement. The creation of a new population from its predecessor occurs in two phases: selection and reproduction. The used data in the SIS optimization is presented in Table 13. It is noteworthy that the SIS operates in a low-demand mode.
•The positions of the GA take variable values between the lower bound: LB: [1 1 1 1 1 1 1 1 1 1 1], and the upper bound: UB: [3 3 3 4 1 1 3 3 4 4 3 4].
•The used parameters are population size (150), Maximum Number of Iterations (200), and the maximum size of the archive (100).
Table 13. SIS optimization data
|
Components |
β= βS=2 βD =2 βSD MTTR= MRT=MRTPST |
||
|
Sensor (S) Nmax=5 |
Logic solver (LS) Nmax=3 |
Final element (FE) Nmax=4 |
|
|
λD (h-1) |
1.4E-06 |
3E-08 |
3E-06 |
|
DC (%) |
60 |
0 |
30 |
|
β |
0.15 |
0.1 |
0.12 |
|
MTTR |
8 |
12 |
8 |
|
T1 |
4380 8760 13140 17520 |
8760 13140 17520 |
2190 3285 4380 8760 |
|
CP |
4844 2306 500 |
4000 2800 2000 |
6940 6500 6000 |
|
CT |
60 30 20 |
70 50 40 |
90 70 60 |
To solve the SIS optimization problem using GA, we use the Optimization Toolbox" of the MATLAB environment. Our strategy involves minimizing the PFDavg (the considered objective). Therefore, the objective problem with constraints takes the form:
{Y=F(X)=(PFDavg(X))PFDavg≤5E−3CSISP≤CmaxP;CSIST≤CmaxTK1≤N1;K2≤N2;K3≤N3 (7)
The achievement of the objective related to safety integrity requires the study of four (04) design choices and therefore represents an optimization problem that can be summarized as follows:
1. How many elements in each subsystem (S, LS, FE) are required: NS ∈ {1, ..., NSmax}, NLS ∈ {1, ..., NLSmax}, NFE ∈ {1, ..., NFEmax}?
2. How many elements within each subsystem whose operation is required, the following conditions must be met: KS ≤ NS, KLS ≤ NLS, KFE ≤ NFE?
3. What is the proof-test interval (T) for each subsystem?
4. What are the acquisition and proof-test costs for the SIS components, considering the given mission time (MT = 20 years): CSISP≤CmaxP;CSIST≤CmaxT?
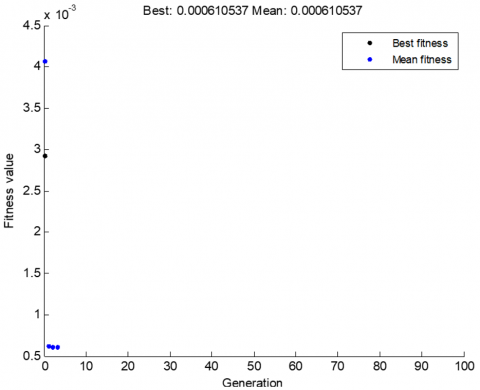
Figure 6. Best fitness value PFDavg through generations
The evolution of the best value of the objective function through generations is given in Figure 6. We note that it reaches a stationary value from the second generation. The GA explored various combinations of subsystem architectures and proof-test intervals, converging on an optimal solution within the first few generations. The resulting optimized SIS architecture consists of:
Sensors (LT 1153): 1oo3 configuration tested every 8760 hours (each year).
Logic solver (LS 1165): 1oo1 configuration tested every 13140 hours (18 months).
Final element (UV 1165): 1oo3 configuration tested every 2190 hours (each 03 months).
The corresponding values for PFDavg, CSISP and CSIST are respectively: 6.10537E-4 (SIL 3), 21500 u, and 5600 u. This new design achieved a significantly improved PFDavg of 6.10537E-4, which meets the required SIL 2 performance.
The optimization of our SIS architecture achieved a significant reduction in PFDavg, from an initial value of 2.1E-2 to 6.10537E-4. This reduction represents a significant improvement in the safety integrity, positioning the SIS below the required PFDavg of 5E-3, thereby achieving compliance with SIL 2, which mitigates the risk of hazardous events, and ensures a safer operational environment for the De-ethanizer reflux drum V-2. In addition to enhancing safety, the optimized design also delivers substantial cost efficiency. The total acquisition cost was reduced to 21500 units, whereas the total proof-test cost was minimized to 5600 units. ensuring that the SIS delivers superior safety performance without exceeding budgetary constraints.
Annual testing of the sensors ensures early detection of potential failures, while the more frequent testing of the final element addresses its higher likelihood of failure. This strategic balance between testing intervals and component criticality maximizes system availability, minimizes downtime, and reduces maintenance costs over the system's lifecycle.
The performance of the GA in this optimization task underscores its robustness and effectiveness in solving complex, multi-variable, and constrained optimization problems. The rapid convergence to a stable solution, coupled with the consistent improvement in the objective function, highlights the algorithm’s capability to navigate intricate solution spaces efficiently. Sensitivity analysis further validated the robustness of the solution, demonstrating minimal deviations in the optimal PFDavg across different GA parameter settings, such as population size, mutation rate, and crossover rate. This stability indicates that the optimized solution is not only effective but also resilient to variations in optimization parameters.
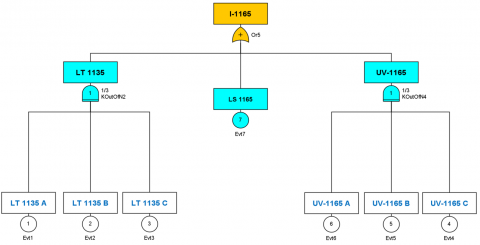
After optimizing the architecture of both the level transmitter and the isolated valve from 1001 to 1003, we will use the Fault Tree to illustrate the new design of our SIS as shown in Figure 7.
Figure 7. Fault Tree related to the proposed architecture of the SIS
This study presents a comprehensive methodology for evaluating and optimizing the Safety Instrumented System (SIS) in the petrochemical industry, specifically focusing on the De-ethanizer Reflux Drum V-2 (I-1165). Through an integrated approach combining risk analysis, SIL allocation, system realization, validation, and optimization, the methodology ensures robust regulatory compliance, enhanced safety, and operational efficiency.
The initial risk evaluation, conducted using the HAZOP study, LOPA method, and PHAST software, highlighted the potentially severe consequences of a leak scenario, emphasizing the critical necessity of an effective SIS. The LOPA analysis determined a required SIL 2 with a minimum PFDavg of 5E-3, while the initial SIS realization phase resulted in a PFDavg of 2.1E-2, corresponding to SIL 1. This discrepancy necessitated optimization, which was achieved using a Genetic Algorithm (GA). The optimized design achieved a 1oo3 architecture for sensors and final elements, significantly improving the PFDavg to 6.10537E-4, exceeding SIL 2 requirements.
Beyond the technical enhancements, the optimization yielded considerable cost benefits. The lifecycle costs, including acquisition and proof-test expenses, were reduced to 21,500 and 5,600 units, respectively. By strategically balancing the proof-test intervals and component redundancies, the new design minimized maintenance costs and downtime, ensuring an economically sustainable safety solution.
Future research can expand this methodology by exploring its applicability to emerging SIS technologies, such as those involving machine learning-based predictive maintenance or advanced diagnostic algorithms. Additionally, adapting this approach to other high-risk sectors, including nuclear energy, aviation, or healthcare, can establish domain-specific best practices. Furthermore, integrating real-time risk monitoring systems with optimized SIS architectures could provide dynamic safety solutions that adapt to operational changes, enhancing resilience and responsiveness.
[1] IEC 61508-1. (2010). Functional safety of electrical/electronic/programmable electronic safety-related systems - Part 1: General requirements (see Functional Safety and IEC 61508). https://webstore.iec.ch/publication/5515.
[2] Vesely, W.E., Goldberg, F.F., Roberts, N.H., Haasl, D.F. (1981). Fault Tree Handbook (NUREG-0492): Systems and Reliability Research. Office of Nuclear Regulatory Research, US Nuclear Regulatory Commission, Washington, DC.
[3] Chebila, M. (2020). Generalized markovian consideration of common cause failures in the performance assessment of safety instrumented systems.Process Safety and Environmental Protection, 141: 28-36. https://doi.org/10.1016/j.psep.2020.05.009
[4] Rehail, Y. Benaskeur, S. (2021). Petri nets-based analysis of the occurrence frequency of an accident scenario. Master thesis. http://doi.org/10.13140/RG.2.2.16131.41766
[5] Omeiri, H., Innal, F., Hamaidi, B. (2015). Safety integrity evaluation of a butane tank overpressure evacuation system according to IEC 61508 standard. Journal of Failure Analysis and Prevention, 15: 892-905. https://doi.org/10.1007/s11668-015-0031-8
[6] Boudjoghra, N., Innal, F. (2023). Evaluation of safety instrumented system in a natural gas facility according to IEC 61508 standard. International Journal of Safety & Security Engineering, 13(5): 801-811, https://doi.org/10.18280/ijsse.130504
[7] Zhao, X., Malasse, O., Buchheit, G. (2019). Verification of safety integrity level of high demand system based on stochastic Petri nets and monte Carlo simulation. Reliability Engineering & System Safety, 184: 258-265. https://doi.org/10.1016/j.ress.2018.02.004
[8] Kaczor, G., Młynarski, S., Szkoda, M. (2016). Verification of safety integrity level with the application of Monte Carlo simulation and reliability block diagrams. Journal of Loss Prevention in the Process Industries, 41: 31-39. https://doi.org/10.1016/j.jlp.2016.03.002
[9] Zennir, Y., Bouasla, S.E.I., Mechhoud, E.A. (2020). Evaluation of safety instrumented system in a petrochemical plant using HAZOP-LOPA-fault tree methodology: Case study: Naphta stabilizer-a reflux drum (LPG separation) in RA1K. In 2020 International Conference on Electrical Engineering (ICEE), Istanbul, Turkey, pp. 1-7. https://doi.org/10.1109/ICEE49691.2020.9249775
[10] Torres-Echeverría, A.C., Martorell, S., Thompson, H.A. (2012). Multi-objective optimization of design and testing of safety instrumented systems with MooN voting architectures using a genetic algorithm. Reliability Engineering & System Safety, 106: 45-60. https://doi.org/10.1016/j.ress.2012.03.010
[11] Eddine, B.H., Riad, B., Youcef, Z. (2024). Spurious trip rate optimization using particle swarm optimization algorithm. International Journal of Safety and Security Engineering, 14(1): 63-69. https://doi.org/10.18280/ijsse.140106
[12] Redutskiy, Y. (2017). Optimization of safety instrumented system design and maintenance frequency for oil and gas industry processes. Management and Production Engineering Review, 8(1): 46-59. https://doi.org/10.1515/mper-2017-0006
[13] Rabah, B., Younes, R., Djeddi, C., Laouar, L. (2024). Optimization of safety instrumented system performance and maintenance costs in Algerian oil and gas facilities. Process Safety and Environmental Protection, 182: 371-386. https://doi.org/10.1016/j.psep.2023.11.081
[14] Cheraghi, M., Taghipour, S. (2024). A mathematical optimization model for determining safety integrity levels in process facilities. Reliability Engineering & System Safety, 243: 109896. https://doi.org/10.1016/j.ress.2023.109896
[15] Touahar, H., Ouazraoui, N., Khanfri, N.E.H., Korichi, M., Bachi, B., Boukrouma, H.E. (2021). Multi-objective optimization of safety instrumented systems maintenance strategy: A case study. International Journal of Quality & Reliability Management, 38(8): 1792-1815. https://doi.org/10.1108/IJQRM-03-2020-0076
[16] Zhang, A., Zhang, T., Barros, A., Liu, Y. (2020). Optimization of maintenances following proof tests for the final element of a safety-instrumented system. Reliability Engineering & System Safety, 196: 106779. https://doi.org/10.1016/j.ress.2019.106779
[17] Berrah, F., Chebila, M., Innal, F., Got, A. (2023). Cost effective analysis of the design of safety instrumented systems using manta-ray foraging optimization algorithm. International Journal of Safety and Security Engineering, 13(6): 975-986. https://doi.org/10.18280/ijsse.130601
[18] Mahmoud, S., Majid, V.S., Alain, B. (2022). Risk analysis, a fuzzy analytic approach. IntechOpen https://doi.org/10.5772/intechopen.108535
[19] Marhavilas, P.K., Koulouriotis, D., Gemeni, V. (2011). Risk analysis and assessment methodologies in the work sites: On a review, classification and comparative study of the scientific literature of the period 2000–2009. Journal of Loss Prevention in the Process Industries, 24(5): 477-523. https://doi.org/10.1016/j.jlp.2011.03.004
[20] Bennett, J.C., Bohoris, G.A., Aspinwall, E.M., Hall, R.C. (1996). Risk analysis techniques and their application to software development. European Journal of Operational Research, 95(3): 467-475. https://doi.org/10.1016/S0377-2217(96)00171-3
[21] Rossing, N.L., Lind, M., Jensen, N., Jørgensen, S.B. (2010). A functional HAZOP methodology. Computers & Chemical Engineering, 34(2): 244-253. https://doi.org/10.1016/j.compchemeng.2009.06.028
[22] Esfandian, H., Goodarzian Urimi, M., Shokoohi Rad, A. (2021). Risk assessment of gasoline storage unit of national Iranian oil product distribution company using PHAST software. International Journal of Engineering, 34(4): 763-768. https://doi.org/10.5829/ije.2021.34.04a.02
[23] Bhattacharya, R., Ganesh Kumar, V. (2015). Consequence analysis for simulation of hazardous chemicals release using ALOHA software. International Journal of ChemTech Research, 8(4): 2038-2046.
[24] Jafari, M., Emami, S.D., Velayatzadeh, M. (2022). Consequences of fire and explosion in distillation unit of Persian gulf star gas condensate refinery using PHAST software. Occupational Hygiene and Health Promotion, 6(1): 13-28. https://doi.org/10.18502/ohhp.v6i1.9365
[25] EL-Kanishy, A. (2024). Consequence analysis of high-pressure natural gas pipelines to determine the safe zones around the pipelines by using PHAST. In Mediterranean Offshore Conference (p. D021S013R006). SPE. https://doi.org/10.2118/223220-ms
[26] Stavrianidis, P., Bhimavarapu, K. (1998). Safety instrumented functions and safety integrity levels (SIL). ISA Transactions, 37(4): 337-351. https://doi.org/10.1016/S0019-0578(98)00038-X
[27] Sarafraz, P., Varshosaz, K., Orak, N., Jaafarzadeh, N., Aghajari, E. (2023). Quantitative evaluation by protection layer analysis (LOPA) for equipment in imam Khomeini petrochemical aromatic unit. Journal of Advances in Environmental Health Research, 11(2): 119-124. https://doi.org/10.34172/jaehr.2023.15
[28] Bhimavarapu, K., Stavrianidis, P. (2000). Safety integrity level analysis for processes: Issues and methodologies. Process Safety Progress, 19(1): 19-24. https://doi.org/10.1002/prs.680190107
[29] Summers, A.E. (1998). Techniques for assigning a target safety integrity level. ISA transactions, 37(2): 95-104. https://doi.org/10.1016/S0019-0578(98)00010-X
[30] Raeesivand, A., Kasaeyan, M. (2019). New fuzzy uncertainty assessment approach of target SIL evaluation by risk graph optimization. Life Cycle Reliability and Safety Engineering, 8(4): 291-302. https://doi.org/10.1007/s41872-019-00093-0
[31] Rehail, Y., Zennir, Y., Larit, K., Tchouar, N. (2024). Evaluation of safety instrumented system using “HAZOP-LOPA-FTA” methodology: Case study: Column C-63 at Skikda-RA1K refinery. Algerian Journal of Signals and Systems, 9(4): 287-293. https://doi.org/10.51485/ajss.v9i4.249
[32] Dowell III, A.M. (1998). Layer of protection analysis for determining safety integrity level. ISA Transactions, 37(3): 155-165. https://doi.org/10.1016/S0019-0578(98)00018-4
[33] IEC 61511-1. (2016). Functional safety - Safety instrumented systems for the process industry sector - Part 1: Framework, definitions, system, hardware and application programming requirements. https://webstore.iec.ch/en/publication/24241.
[34] Innal, F., Dutuit, Y., Chebila, M. (2015). Safety and operational integrity evaluation and design optimization of safety instrumented systems. Reliability Engineering & System Safety, 134: 32-50. https://doi.org/10.1016/j.ress.2014.10.001
[35] Goswami, R.D., Chakraborty, S., Misra, B. (2023). Variants of genetic algorithms and their applications. In Applied Genetic Algorithm and Its Variants: Case Studies and New Developments, pp. 1-20. https://doi.org/10.1007/978-981-99-3428-7_1
[36] Sohail, A. (2023). Genetic algorithms in the fields of artificial intelligence and data sciences. Annals of Data Science, 10(4): 1007-1018. https://doi.org/10.1007/s40745-021-00354-9
[37] Gen, M. (2008). Network Models and Optimization: Multiobjective Genetic Algorithm Approach. Springer.
[38] Katoch, S., Chauhan, S.S., Kumar, V. (2021). A review on genetic algorithm: Past, present, and future. Multimedia Tools and Applications, 80: 8091-8126. https://doi.org/10.1007/s11042-020-10139-6
[39] Fonseca, C.M., Fleming, P.J. (1993). Genetic algorithms for multiobjective optimization: Formulation, discussion and generalization. Icga, 93: 416-423.
[40] Majuno, S., Shaakal, R. (2006). Safety integrity level (SIL) classification study report of crude distillation unit I&II (unit 10/11). Skikda Refinery.
[41] Hauge, S., Onshus, T. (2010). Reliability data for safety instrumented systems: PDS data handbook. SINTEF Technology and Society. https://pdfcoffee.com/pds-data-handbook-2010-edition-selected-pages-pdf-free.html