Muhammad Faishal | Dwitya Harits Waskito*![]() | Raja Oloan Saut Gurning
| Raja Oloan Saut Gurning![]() | Agoes Santoso
| Agoes Santoso![]() | Tris Handoyo
| Tris Handoyo![]() | Ayudhia Pangestu Gusti
| Ayudhia Pangestu Gusti![]() | Sridhani Lestari Pamungkas
| Sridhani Lestari Pamungkas
© 2025 The authors. This article is published by IIETA and is licensed under the CC BY 4.0 license (http://creativecommons.org/licenses/by/4.0/).
OPEN ACCESS
The growing demand for passenger vessels has been paralleled by increased accidents, resulting in significant economic, human, and environmental losses. Accidents on passenger ships often stem from complex factors, including technical, operational, and human elements. Therefore, a detailed analysis is essential for understanding these factors and improving safety management. While various traditional risk analysis methods exist, the Bayesian Network (BN) offers unique advantages in modelling the probabilistic relationships between risk factors and accident outcomes. This study aims to analyse the accident severity level of passenger vessels in Indonesia by employing a Tree Augmented Naïve Bayesian Network (TAN-BN) to assess 46 passenger ship accidents in Indonesia using 17 identified Risk Influencing Factors (RIFs) focused on ship internal factors. Sensitivity analysis using mutual information and True Risk Influence (TRI) methods identified “Ship Operation” and “Accident Type” as the most significant RIFs, where the ship during passage is the most severe ship operation, and the ship sinking accident is the most catastrophic accident type. Scenario analysis revealed that very serious accidents often occur in transit, with human factors, particularly violation errors, playing a critical role. This study can leverage the decision-making process for stakeholders to reduce the severity of accidents in passenger vessels.
accident analysis, Bayesian Network (BN), maritime safety, passenger ships, risk analysis, Tree Augmented Naïve Bayesian (TAN-BN)
Passenger ships are one of the global sea transportation systems that play a crucial role. With the ability to carry hundreds or even thousands of passengers simultaneously, these ships are the backbone for inter-island, cross-country, and cross-continental travel. Passenger ships are also a vital means of transportation in areas that are difficult to reach by other modes of transportation, such as in archipelagic countries or remote areas, especially in archipelagic countries such as Indonesia [1]. With the increasing need for passenger ships in parallel with technological developments over the past 25 years, accidents resulting in losses and loss of life have also increased. Thus, accidents involving passenger ships have become a significant concern in the maritime industry [2]. Passenger ship accidents have a significant impact globally, including economic losses, fatalities, material losses, and environmental damage [3]. These impacts include rescue costs, disruption of maritime trade, compensation for victims, casualties, damage to ships and cargo, and marine pollution due to oil spills and other hazardous materials [4-6].
Passenger ship accidents are frequent because the large number of passengers increases the fatality risk. Also, because these ships often operate on fixed routes and congested ports, the chance of collision or running aground is higher [7, 8]. In addition, the lack of compliance with safety standards on some passenger ships, especially in developing countries, also contributes to the high accident rate [4, 9]. Studies mention that passenger ship accidents are influenced by various complex factors, including technical, operational, and human factors [10, 11]. Technical factors include ship design, maintenance conditions, and compliance with safety regulations that are often inconsistent, especially in developing countries [12]. From an operational perspective, congested shipping routes and adverse weather conditions also increase the risk of accidents, such as collisions and running aground [13]. Human factors, such as poor decision-making, lack of situational awareness, and crew fatigue, also play a significant role in most maritime accidents [14-16].
Risk analysis is essential in preventing and mitigating risks in the marine transportation sector. The study on risk analysis aims to identify, evaluate, and manage ship operational risks to improve safety management and reduce potential incidents [17]. Various methods have been developed and used in research related to passenger ship accident risk analysis, such as Fault Tree Analysis (FTA), which is a method to identify combinations of failures that can cause accidents through logic tree diagrams, allowing for in-depth analysis of the causal factors and their relationships [18]. The FTA method is also used in studies to find the root causes of many marine accidents, including collisions [19] and Ro-pax ship accident scenarios [20]. Risk evaluation on passenger ships has also been explored and determined using the Failure Modes Effect and Analysis (FMEA) methodology. FMEA can provide an overview of the problem that occurred and the severity of the consequences and detection. The FMEA method produces a level of risk by using a Risk Priority Number (RPN). The Failure and Mode Effects Critical Analysis (FMECA) method is also one of the traditional risk analysis methods widely used in risk assessment and reliability analysis. Nevertheless, there are several constraints regarding the difference in the parameter importation and the subjective scale of RPN [21].
Numerous studies on utilising the safety-III-based risk assessment in the maritime sector have been conducted globally, which include qualitative and quantitative risk assessments [22]. Qualitative assessments offer in-depth insights by analysing small data samples. Commonly used risk assessment methods include the Functional Resonance Analysis Method (FRAM) and the Human Factors Analysis and Classification System (HFACS) [23]. Uğurlu et al. [24] uses the HFACS method to investigate and classify the human factor in maritime accidents. Salihoglu et al. and Yu et al applied the FRAM method to assess the risk of shipping operations qualitatively [25, 26]. Other methods for analysing marine accidents, such as the System Theoretical Accident Model (STAMP) [27, 28] have also been used for risk analysis. Qualitative assessment methods cannot measure risk and are often criticised for their reliability and validity [2]. To overcome those problems, researchers have used QRA to quantitatively measure the causal relationship between marine accidents and relevant influencing factors to overcome this weakness. Another QRA model used for maritime risk analysis is the Bayesian Network (BN) [29, 30]. Compared with the various QRA methods used in maritime transportation risk assessment, BN demonstrates a unique advantage with its strong model capabilities on data tolerance, two-way risk diagnosis, and predictive analysis [31]. Compared to FTA, BN can handle multi-status and multi-output variables. In addition, compared to other QRA methods, BN has demonstrated its capacity to model and accommodate human and organisational factors along with other risk-influencing factors (RIFs) [32].
In the QRA for passenger vessels, it is crucial to look for the most significant factors contributing to the accident and identify the factors that most affect the overall risk. Seemingly minor factors may have a significant impact under certain conditions and can affect safety unexpectedly. Therefore, in-depth studies are needed to understand how various factors interact with each other and affect accident risk. One of the effective methods used in this analysis is the Bayesian Network, which allows probabilistic modelling of causal relationships between these factors, thus aiding in more informed decision-making to improve the safety of passenger ships. Until now, the use of Bayesian Networks (BN), particularly risk analysis for passenger ships, is still limited and has not been widely applied. BN has excellent potential to provide deep insights into the interaction between risk factors and improve safety in the maritime industry [30]. Studies using Bayesian Network (BN) for passenger ships are growing, especially in data-driven risk analysis, to prevent subjectivity and gaps arising from subjective data in Bayesian Network (BN) modelling [3]. Studies on ship accidents using the Bayesian Network (BN) on a data-driven approach have been carried out by improving the approach for creating data-driven Bayesian Network (BN) risk models, which can precisely forecast the risk of maritime accidents, making the model suitable for accident mitigation [33]. The study shows that data-driven BN is one of the most potent methods for managing safety and reducing maritime accidents. Several algorithms are used in data-driven approaches, including NBN, ABN, K2 algorithm, and Tree-Augmented Naïve Bayes (TAN) [32], applying NBN to build network models to explore the interconnections between risk factors and measure the consequences of various maritime accidents and assume that the influencing factors are independent, which does not accurately reflect the complexity of actual maritime accidents. ABN model, selected over the NBN model for analysing critical risks related to RIFs affecting maritime accident severity, is complex and requires manual adjustment of unreasonable causal relationships [34]. Zhou et al. [35] stated that the TAN method outperforms NBN by combining the effectiveness and simplicity of NBN with enhanced result accuracy, making it a more competitive and precise option among data-driven network construction methods [35-37].
Marine transport accidents, especially on passenger vessels, pose a major global challenge with serious safety and economic consequences [38]. The TAN method integrated with the Bayesian Network (BN) has been widely used to map accident data globally, but its use on smaller data scales has not been fully explored. In certain situations, obtaining detailed data from passenger ship accidents can be highly challenging despite critical data being the primary input for accident analysis. Furthermore, to the best of the author’s knowledge, applying the TAN-BN method to specific ship types, particularly passenger vessels, remains unexplored. This study addresses several research questions, including:
1) What is the performance of the TAN-BN model for mapping the severity of maritime accidents with a smaller amount of data? Is there any difference between the more significant number of studies?
2) How can the TAN-BN model be applied to certain ship conditions, especially passenger ships?
3) What are the RIFs that have the most influence on passenger ship accidents?
Based on the question, this study aims to assess whether the TAN-BN model can effectively map passenger vessel accident data even with limited data and identify the key factors that most affect the accident’s severity. In addition, the study will highlight some Risk-influencing factors (RIFs) that have not been emphasised in previous analyses, providing deeper insights into risks and their mitigation. This approach offers better insight into understanding risk and supports more informed decision-making in efforts to improve maritime safety. This study is expected to be an essential contribution to the literature on analysing passenger ship accident risk and applying the BN method in the maritime industry.
2.1 General methodology of this study
Figure 1 shows the overall framework for this study, which comprises three main steps: Data collection, BN modelling, and validation and analysis. A detailed explanation of each step will be stated in the section below.
Figure 1. The framework of this study
2.2 Bayesian Network
Bayesian Networks (BN), first introduced by Pearl in 1998 [39] are typically represented as Directed Acyclic Graphs (DAGs) consisting of nodes and directed edges that connect them [40]. Due to their strong capabilities to analyse the relation between factors, BNs are widely employed as a risk assessment tool in maritime safety research [41]. They integrate probabilistic values with graphical structures to represent relationships between variables [42]. BN structures can be configured using a subjective approach from expert judgment and are data-driven to generate causal relationships between variables or nodes.
The primary output for the BN was represented as the posterior probability, which calculated the likelihood of event “x” occurring when other related events also occurred. Subsequently, this process could also be referred to as the conditional probability. The posterior probability could be calculated by Eq. (1):
P(Ri | S)=P(Ri)P(S | Ri)P(S), i=1,2,3,4,…,j (1)
where, P(Ri|S) was the posterior probability, P(S|Ri) was the conditional probability of S when Ri has been obtained, P(Ri) represented the prior probability of the case, and P(S) was the probability of S.
2.3 Tree Augmented Naïve- Bayesian Network
TAN enhances the Bayesian Network by expanding its structure and maintaining the learning ability of BNs while avoiding the complexity of analysing complete Bayesian Networks [43]. Wang et al. conducted a study that adopts TAN to develop a TAN-BN model for analysing the factors influencing accident severity [44]. The study used extensive statistical data to create a complete CPT, enabling the BN to effectively model stochastic processes, manage nonlinear relationships, and perform reasoning under incomplete, imprecise, or uncertain information conditions.
The joint probability distribution formula defined in BN is expressed in Eq. (2) [45]:
P(R1,…Rn, S)=P(S)⋅∏ni=1P(Ri|S) (2)
If each RIF variable Ri has only one parent node in addition to the class variable S, the DAG forms a tree structure. A function υ is then defined on set R to ensure no loops occur in the tree structure. The condition for υ to define a tree on R is that there must be exactly one i such that υ(i) = 0, meaning each variable has only one unique parent, and there is no sequence i1, …, ik such that υ(ij) = ij+1,1 ≤ j < k, and υ(ik) = i1, ensuring the structure remains acyclic. In this case, υ defines a tree network, and when υ(i) > 0, ∏Ri = {S, Rυ(i)}, while when υ(i) = 0, ∏Ri = {S}. Therefore, during the TAN structure model’s learning and inference process, the main task is to find a tree within the model and define the function υ on set R to maximise its log-likelihood value. Additionally, the TAN structure employs conditional mutual information calculations between variables during learning and reasoning, with the mutual information calculation shown in Eq. (3):
IP(Ri, Rj|S)=∑rii,rji,SiP(rii,rji,Si)logP(rii, rij|Si)P(rii|Si)P(rij|Si) (3)
where, IP represents conditional mutual information, rii refers to the ith state of Ri in the RIF, rji refers to the ith state of Rj in the RIF, and Si represents the ith severity level of the accident [46].
2.4 Data and RIFs selection
2.4.1 Data collection
The data used in this study were the results of investigations conducted by Indonesia’s National Transportation Safety Committee (NTSC). The investigation of accident reports from NTSC included an in-depth technical and social investigation. In marine transport safety, NTSC explored accidents such as sinking, fire-explosion, collision, and grounding, including ships with over 100 GT for passenger ships and more than 500 GT for cargo ships.
This study used 46 passenger vessel accidents to generate the TAN-BN model. The scope of the passenger ship accident data used is passenger ships with the type of Ferries, Ro-Ro, or Ro-Pax size of more than 500 GT and with steel material. These criteria are based on the fact that passenger ships with these sizes and materials have the most significant number in Indonesia, and the focus from stakeholders, such as regulators and marine insurance companies, is the passenger vessels with the hull material steel and larger sizes.
2.4.2 Accident severity
In several studies, each country determines the severity classes of accidents. As the primary source of accident data, Indonesia does not have such a categorisation system. Therefore, the standard used is based on the International Maritime Organization (IMO), the International Maritime governing body, with three accident classifications: “Very serious”, “Serious”, and “Less serious”. The details of each category are explained below [47]:
·Very serious casualties (VS): There are fatalities and people disappear, major environmental damage, significant oil spills, severe damage to the hull, or loss of a ship;
·Serious casualties (S): There are injuries, minor environmental damage, or damage to the hull;
·Less serious casualties (LS): There are no injuries, no environmental damage, or minor hull damage.
2.4.3 Selecting the RIFs
The RIFs selection process was conducted by conducting a literature review of relevant studies with the search keywords of “TAN Bayesian” OR “Data-Driven Bayesian” OR “marine accident severity”. A total of 16 relevant studies were selected, and a summary of the RIFs is shown in Figure 2. From the selected studies, the “Accident Time” and “Ship Type” are the most used RIFs with 15, followed by the Ship’s Gross Tonnage, “Ship’s age”, “Voyage Segment”, and “Accident Type” with 14,13,12,11 times, respectively. Thus, this study will adopt the RIFs that have a high number of appearances in the studied literature. Nevertheless, since this study will emphasise the ship’s internal factors and human-related error, the environment RIFs will not be included in the model.
Previous studies showed that some models used human factors as general terms. Although some studies use detailed RIFs for human errors such as operational errors, violation errors, education, and ship manning, the number is still below the generalised human factors. This also happens for vessel condition and equipment; most of the studies do not provide details on the ship’s condition; there are only two RIFs in the studied literature, namely vessel condition and equipment. Therefore, in this model, the two RIFs regarding structural condition will be detailed by adding “structural errors” and “design errors”. While on the ship’s equipment, several RIFs were added, such as “safety equipment” and “firefighting equipment and navigation”, to analyse their effect against the severity of passenger vessel accidents, as one of the main contributions of this study. However, some RIFs, such as ergonomics and lookout, will also not be included because these two RIFs were never mentioned in the NTSC accident investigations report. The detailed definitions of RIFs in this study are explained in Table 1.
Figure 2. The identified RIFs from numerous related research papers
Table 1. The detailed explanation of 17 RIFs for accident severity
|
No. |
Main Factors |
RIFs |
Definitions |
States |
|
1. |
Accident |
Accident Type |
The type of the accident. |
collision/contact, stranding/grounding, fire/explosion, capsize/sinking, other |
|
2. |
|
Accident Time |
The time when the accident happened. |
0000-0400, 0400-0800, 0800-1200, 1200-1600, 1600-2000,2000-2400 |
|
3. |
|
Ship Operation |
The state of the vessel when the accident occurred. |
Anchor, loading, passage (transit), manoeuvre, pilotage |
|
4. |
Human |
Seafarer’s education and certificate |
The education of crewmember is not suitable for the position; The education of crewmember is suitable for the position. |
Incomplete and invalid; Complete and valid |
|
5. |
|
Ships manning |
The number of crews is insufficient based on STCW; The number of crews is sufficient. |
Inadequate; adequate |
|
6. |
|
Operational error |
Unsafe acts, decision errors, situational awareness errors, manoeuvring errors, and calculation errors happen. No operational error to the accident. |
Yes; no |
|
7. |
|
Violation error |
Procedure error, exceeding speed, not complying with regulation. No violation error to the accident. |
Yes, no |
|
8. |
Ship’s Data |
Ships certificates |
Class certificate, flag state, port authority permission, stability book, drawing. Documents and certificates are completed. |
Incomplete and invalid; Complete and valid |
|
9. |
|
Ship’s Age |
The age of the ship since it was first built. |
0-10 years, 10-20 years, 20-30 years, more than 30 |
|
10. |
|
Gross Tonnage |
The gross tonnage of the vessel. |
< 500t, 500t-3000t, > 3000t |
|
11. |
|
Engine Power |
The total capacity of the main engine of the vessel. |
< 750kW, 750-3000 kW, > 3000 kW |
|
12. |
Vessel Condition and Equipment |
Structural Condition |
Watertight condition, opening, is there any corrosion or leak. Good structural condition or nothing to do with the accident. |
Bad; good |
|
13. |
|
Design Error |
Design error, modification without approval; No design error. |
Yes;no |
|
14. |
|
Safety Equipment |
Terrible condition of lifejacket, EPIRB, Liferaft. Good condition of safety equipment. |
Inadequate; adequate |
|
15. |
|
Fire Fighting and Navigation Equipment |
The terrible condition of firefighting and navigation equipment. Good condition of firefighting and navigation equipment. |
Inadequate; adequate |
|
16. |
Management |
Regulation and Procedure |
The procedure or regulation does not exist, or the procedures have not been applied. Procedures are in place and well-implemented. |
Inadequate; adequate |
|
17. |
|
Training and Drill |
Training and Drills are not conducted regularly. Training and Drills are conducted regularly. |
Inadequate; adequate |
2.5 Bayesian Network modelling with Tree Augmented Naïve for passenger vessels
After determining the RIFs within the BN model for passenger vessels, the TAN modelling was conducted based on mutual information among several RIFs. RIFs with the closest mutual information are connected by a DAG. In this model, the target is “Accident Severity” at the centre of the model. The determination of the model based on mutual information using equation x was conducted within the NETICA Norsys program with the simulation of “Learning TAN Structure”. The initial model was analysed and discussed with several experts with expertise in maritime safety. Changes made in the model include:
Disconnect several unrelated DAGs from “Safety Equipment” and “FF and Navigation Equipment”
Add the DAG between “Ship Operation” and “Accident Type”
Add the DAG between “Accident Type” and “Accident Time”
Refine the relationship between human-related error
The input of conditional probability is an important feature in BN modelling. The Conditional Probability Table (CPT) was utilised to input the probability based on its condition. Table 2 shows the CPT for the “Training and Drill” RIFs.
Table 2. Conditional probability table for “Training and Drill” RIFs
|
Accident Severity |
Very Serious |
Serious |
Less Serious |
|||
|
Operational Error |
yes |
no |
yes |
no |
yes |
no |
|
Inadequate training |
45.45 |
0 |
44.44 |
33.33 |
11.11 |
0 |
|
Adequate training |
54.55 |
100 |
55.56 |
66.67 |
88.89 |
100 |
2.6 Validation method
Model validation is a crucial step in the result analysis phase. Axiom-based verification is commonly applied in Bayesian Networks (BN), and in this study, three axioms were utilised to evaluate the model’s robustness [48]. The model was tested in NETICA software by changing the probability of the RIFs node against the “Accident Severity” node. The TAN-BN model must fulfil the three axiom rules to guarantee its reliability.
Axiom 1: If the prior probability of any RIFs is slightly increased or decreased, the posterior probability of the target node should correspondingly increase or decrease.
Axiom 2: The increase in posterior probability should be constant, and no fluctuation in value should be allowed.
Axiom 3: The overall effect of probability changes in a set of x parameters should not be less than the cumulative effect of probability changes within a subset y (where y ∈ x).
2.7 Sensitivity analysis
In this study, sensitivity analysis is conducted using a combination of mutual information, joint probability distributions, and the True Risk Influence (TRI) method to identify and quantify RIFs to passenger vessel accident severity.
2.7.1 Mutual information
Mutual information, quantifying the degree of interdependence between variables, is widely utilised as a criterion for feature selection and transformation in machine learning applications [49]. In this study, the mutual information value between the risk variables in the RIFs and “accident severity,” treated as the target variable, can be determined to evaluate their relationship. The specific calculation procedure is outlined in Eq. (4), where S denotes accident severity, ri represents the ith RIF variable, rij corresponds to the jth state of the ith RIF, and I(S, ri) indicates the mutual information between accident severity and the ith RIF:
I(S,ri)= −∑S,iP(S,rij)logP(S,rij)P(S)P(rij) (4)
2.7.2 Joint probability
The TAN-BN model assigns probability values to the different states of the associated RIFs. By holding the other RIF variables constant, the probability distributions for the various states of the class variable or target nodes can be determined. The joint probability values for all RIF states sum to 1. Eq. (5) outlines the detailed calculation process, where S denotes accident severity, and Rij represents the jth state of the ith RIF:
P(S,Rij)=P(S)⋅P( Rij|S) (5)
2.7.3 True risk influence
True Risk Influence (TRI), a novel sensitivity analysis method proposed by Alyami et al., is employed to assess the impact of RIFs [50]. RIFs with substantial influence are identified during sensitivity analysis using mutual information values. Subsequently, the TAN-BN model is applied to compute the high-risk influence (HRI) and low-risk influence (LRI) values for these RIFs. The TRI value, representing the average of HRI and LRI, is then calculated to quantify the extent of each variable’s influence on accident severity. The TRI can be obtained by Eq. (6):
TRI=HRI+LRI2 (6)
3.1 BN-TAN modelling
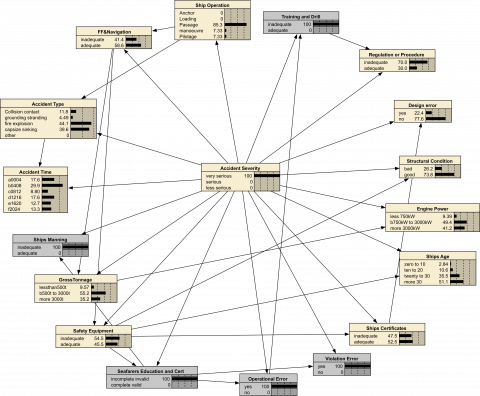
Figure 3 depicts the posterior probability of the TAN-BN model of passenger vessel accidents in Indonesia. Half of the accidents are considered very serious, followed by serious accidents (26.1%) and less serious accidents (23.9%). Regarding the Accident type, the highest proportion of accidents is fire and explosion, with 41.3%, followed by capsize and sinking, with 23.9%. In terms of ship operation, more than 60% of the accidents involving passenger vessels occur when the ship is in transit (passage) between locations, followed by during manoeuvre with 15.2% and pilotage in anchorage area with 13.0%. The gross tonnage of the ship involved in accidents is most likely for ships more than 3000 GT (45.9%), and the age of the ships in the accident is more than 30 years (50.1%).
Regarding the time of the accident, the most frequent accident happened during 16:00-20:00 with 30.4%, followed by the 04:00-08:00 period with 17.4%. The percentage of human error in passenger vessels is exceptionally high, with the “Operational Error” of 87.1% and the “Violation Error” of 69.6, which should be analysed further in the sensitivity analysis. Management aspects are also crucial in the accidents of passenger vessels, with 58.7% of the accidents having inadequate regulations and procedures, and 34.8% of the cases were caused by irregular training and drills as an implementation of the safety management system.
Figure 3. The posterior probability of the TAN-BN model
3.2 Sensitivity analysis of the most influencing RIFs
3.2.1 Mutual information
Table 3 explains the mutual information and entropy reduction of RIFs into the “Accident Severity” node. The results indicated that the accident type is the RIF with the highest mutual information, where the higher mutual information denotes the higher influence on the target node. The mutual information analysis was conducted within the NETICA Norsys Bayesian program. According to the result, the average of the mutual information value is 0.134. Therefore, the RIFs that have more value than average were selected for further analysis of sensitivity analysis (stated in bold). From Table 3, the decreasing ranking from the most influential factors that contribute to the “Accident Severity” are Accident Type> Ship Operation> Gross Tonnage> Accident Time> Violation Error> Engine Power.
Table 3. Mutual information between “Accident Severity” and RIFs
|
Variable |
Mutual Information |
Entropy Reduction |
Variance of Beliefs |
|
Accident Type |
0.3791 |
25.3 |
0.078875 |
|
Ship Operation |
0.34101 |
22.7 |
0.063537 |
|
Gross Tonnage |
0.29371 |
19.6 |
0.020827 |
|
Accident Time |
0.25844 |
17.2 |
0.038155 |
|
Violation Error |
0.19226 |
12.8 |
0.03274 |
|
Engine Power |
0.18577 |
12.4 |
0.014288 |
|
Ships Age |
0.13698 |
9.14 |
0.029241 |
|
Ships Certificates |
0.11002 |
7.34 |
0.017561 |
|
FF and Navigation |
0.0989 |
6.6 |
0.010782 |
|
Safety Equipment |
0.0829 |
5.53 |
0.007347 |
|
Training and Drill |
0.07752 |
5.17 |
0.007634 |
|
Operational Error |
0.05216 |
3.48 |
0.007664 |
|
Design error |
0.02387 |
1.59 |
0.006078 |
|
Seafarer’s Education and Certificates |
0.01996 |
1.33 |
0.001428 |
|
Regulation or Procedure |
0.01342 |
0.895 |
0.002775 |
|
Structural Condition |
0.01168 |
0.779 |
0.002764 |
|
Ships Manning |
0.00824 |
0.549 |
0.001898 |
3.2.2 Joint probability
After obtaining the six significant RIFs to the “Accident severity” node from the mutual information calculation, the following analysis will calculate each state’s joint probability distribution and variable of the RIFs on the accident severity. The normalisation value is applied to certify the correctness of probability distribution. The updated probability was obtained by setting the probability of a specific state within the RIFs by 100% and keeping other probabilities intact. For instance, in the “Accident Type” RIFs, the probability of “Capsize and sinking” was set to 100%, and the probability for a very serious accident state increased to 81.8%. Table 4 shows the complete calculations for every state. The bold font denotes the highest and lowest values within a specific accident severity state.
3.2.3 True risk influence
The values of HRI and LRI must be obtained first for every RIF and every Accident Type’s state to calculate the TRI. The difference in the highest probability value between the states and the original value can calculate the value of HRI.
Take the calculation of the HRI of “Accident Type” to the very serious accident (VS) as an example. It is found that the probability value of VS in the first column of Table 4 is the state which has the sinking or capsizing, with a probability of 81.8%, and the lowest probability is another accident with 0%. The HRI is the difference between the highest probability and the original value (50%), which is 31.8. The LRI is the difference between the lowest probability and the original value of 50. Then, the average HRI and LRI for the “Accident Type” for very serious accidents is 28.4, as shown in the first column of Table 5. The same method was applied to every RIF for each severity state, as shown in Table 5.
Table 4. Joint probability (100%) of “Accident Severity” from each state of RIFs
|
VS |
S |
LS |
|
|
Original Value |
50 |
26.1 |
23.9 |
|
Accident Type |
|
|
|
|
Collision /Contact |
33.33 |
33.33 |
33.34 |
|
grounding stranding |
16.7 |
0 |
83.3 |
|
fire/explosion |
52.6 |
36.8 |
10.5 |
|
capsize sinking |
81.8 |
18.2 |
0 |
|
other |
0 |
0 |
100 |
|
Ship Operation |
|||
|
Anchor |
0 |
100 |
0 |
|
Loading |
0 |
75 |
25 |
|
Passage |
67.9 |
21.4 |
10.7 |
|
manoeuvre |
28.6 |
28.6 |
42.9 |
|
Pilotage |
33.3 |
0 |
66.7 |
|
Gross Tonnage |
|||
|
less500gt |
49.3 |
26 |
24.7 |
|
500t-3000t |
57.6 |
42.4 |
0 |
|
more3000t |
42.6 |
10 |
47.4 |
|
Accident Time |
|||
|
0000-0400 |
57.1 |
42.9 |
0 |
|
0400-0800 |
87.5 |
0 |
12.5 |
|
0800-1200 |
50 |
25 |
25 |
|
1200-1600 |
66.7 |
16.7 |
16.7 |
|
1600-2000 |
21.4 |
35.7 |
42.9 |
|
2000-2400 |
42.9 |
28.6 |
28.6 |
|
Violation Error |
|||
|
yes |
62.3 |
28.3 |
9.37 |
|
no |
21.8 |
21 |
57.2 |
|
Engine Power |
|||
|
less750kW |
49.3 |
26 |
24.7 |
|
750kW-3000kW |
52.8 |
42.4 |
4.8 |
|
more3000kW |
47.4 |
10 |
42.6 |
Table 5. TRI of RIFs for all accident severity states
|
RIFs |
True Risk Influence |
|||
|
VS |
S |
LS |
Average |
|
|
Accident Type |
28.4 |
18.4 |
50 |
32.27 |
|
Ship Operation |
33.95 |
50 |
33.35 |
39.1 |
|
Gross Tonnage |
7.5 |
16.2 |
23.7 |
15.8 |
|
Accident Time |
16.52 |
10.72 |
10.72 |
12.66 |
|
Violation Error |
20.25 |
3.65 |
23.91 |
15.94 |
|
Engine Power |
2.7 |
16.2 |
18.9 |
12.6 |
The results show that the average TRI value of “Ship Operation” is the highest at 39.1, followed by “Accident Type” at 32.27 and “Violation Error” at 15.94. By the average of the TRI, the order of the influence of RIFs on the accident severity has changed into Ship Operation>Accident Type>Violation Error>Gross Tonnage>Accident Time>Engine Power.
From Table 6, it can be concluded that each accident’s severity has a different influence on RIFs. Classifying the TRI values is essential for increasing the accuracy and consistency of risk assessment and can yield insightful information. The “Ship Operation” is the most influencing RIF for very serious and serious accidents, whereas the “Accident Type” is the most sensitive RIF for less serious accidents. The “Violation Error” of the crewmember is the third influencing RIFs in very serious accidents, Where the influence of humans also plays a significant role in the accident’s severity.
Table 6. The most influencing RIFs for all accident severity state
|
RIFs |
VS |
S |
LS |
|
Accident Type |
2 |
2 |
1 |
|
Ship Operation |
1 |
1 |
2 |
|
Gross Tonnage |
5 |
3 |
4 |
|
Accident Time |
4 |
5 |
6 |
|
Violation Error |
3 |
6 |
3 |
|
Engine Power |
6 |
4 |
5 |
3.3 Model validation
Model validation intends to test whether the TAN-BN model in this study confirms the nature of the accident and to check the model’s reliability.
The Axiom 1 and 2 test observes the model by estimating the change of different states of the parent to the child nodes. According to Axiom 1 and 2, if the prior probability of the parent nodes increases, the child nodes also increase along with the increase in probability (Axiom 1). Furthermore, the increase in the posterior probability value must be constant; the model should have no fluctuations. This analysis uses the six selected RIFs based on mutual information to check the model’s validity. The analysis was conducted for each severity state because the factors most affecting the RIFs in each accident severity state are different. For example, the original probability of a very serious accident is 50%. After that, the probability of the states within the “Accident Type” that have the most influence on the severity, i.e., sinking and capsize, was increased by 5%. Consequently, the probability of the most negligible influence on accident severity was reduced by 5%, and the result shows that a very serious accident increases to 53.3%. The same method was applied to other RIFs and accident severity states, as shown in Table 7.
Table 7. Test of Axiom 1 and 2 on different accident severity grades
|
RIFs |
Increase in Percentage |
||||||
|
Accident Type |
5% |
5% |
5% |
5% |
5% |
5% |
|
|
Ship Operation |
5% |
5% |
5% |
5% |
5% |
||
|
Gross Tonnage |
5% |
5% |
5% |
5% |
|||
|
Accident Time |
5% |
5% |
5% |
||||
|
Violation Error |
5% |
5% |
|||||
|
Engine Power |
5% |
||||||
|
VS |
50 |
53.3 |
56.8 |
57.7 |
60.8 |
64.3 |
64.7 |
|
S |
26.1 |
27 |
29.3 |
32.2 |
34.4 |
35.1 |
38.4 |
|
LS |
23.9 |
28.1 |
32.9 |
36.9 |
39.9 |
44.2 |
47.4 |
Axiom 3 examined whether the combined effect of the parent node on the child surpassed its impact individually. In this TAN-BN model, the child nodes are the RIFs, and the main parent node is the “Accident Severity” and other RIFs. Therefore, all child nodes must be checked for compliance with axiom 3. As an example, the RIFs node of “Training and Drill” has a parent node of “Accident Severity” and “Operational Error”. When the negative states for “Accident Severity” and “Operational Error” were set to “Yes” (100%) individually, the posterior probability was 43.4% and 37.5%, respectively. Moreover, when two parent nodes were simultaneously set into a negative state, the probability increased to 45.5%, showing compliance with Axiom 3. The same calculation was performed for each child and parent node in the TAN-BN model, and all results met the requirements of Axiom 3.
3.4 Scenario analysis
3.4.1 Human-influenced error
In this scenario, the nodes related to human effects, such as “Ships Manning”, “Seafarers Education and Certification”, “Operational Error”, “Violation Error”, and “Training and Drill”, were set into their negative states of 100%. The result shows that the state of very serious accidents within “Accident Severity” reaches 100%, meaning that human-related error significantly contributes to serious accidents, as shown in Figure 4. The most interesting finding is that when a human-related error occurred, the probability of state accident time of 04:00–08:00 AM was increased and the highest probability in the “Accident Type” node, where at that hour, the level of fatigue and awareness of the crew is low enough to cause a very serious accident. Regarding ship operations, the most serious accidents, influenced by human error, will occur during passage, with an 85.3% probability. As for the accident type, the two highest types that are heavily contributed by human influence are fire/explosion and capsize/sinking, with 44.1% and 39.6% probability, respectively.
Figure 4. The combined effect of the human-related error on the passenger vessel
3.4.2 Inadequate management
This scenario involves the adverse conditions of ship management, such as inadequate “Regulation or Procedure”, and ship internal conditions, such as “FF and Navigation”, “Safety Equipment”, “Ship certificate”, “Structural Condition”, and “Design error” were set into their respective negative states with 100% probability. The apparent result is that the probability of a very serious accident reaches its maximum (100%), as shown in Figure 5 when the combination of adverse ship management and equipment happens, which concludes that the readiness of ship equipment, adequate ship maintenance, and compliance with regulation and procedure also essential to reduce the severity of accidents. Another evident finding in this scenario is that ships older than thirty are more vulnerable to severe accidents, with a 57.1% probability. This finding follows the natural conditions of machinery, structures, and equipment where the more prolonged the ship’s age, the quality of the structure, the ability of the engine, and other equipment also deteriorate. The exciting finding is that a very serious accident due to improper ship maintenance and condition will likely occur on a ship with GT 500t-3000t and Engine power of 750kW to 3000kW with 71.4% and 57.9% probability, respectively.
Figure 5. The combined effect of ship management and equipment
3.4.3 Detailed sensitivity analysis of human error and ship management
In the sensitivity analysis mentioned in Section 3.2, several RIFs were not included in the in-depth analysis due to the low mutual information. However, these RIFs could influence stakeholders to reduce the probability of accidents in passenger vessels since these RIFs are the controlled factors with proper training and maintenance of the ship equipment. Therefore, a joint probability analysis was conducted on these RIFs except for Violation error because it has featured in the TRI analysis as one of the most influencing factors for accident severity.
Table 8 shows the results of the joint probability analysis. In terms of human error, inadequate training and drills for seafarers are the most influential RIFs for very serious accidents, followed by the insufficient number of crew onboard. As mentioned in the ship’s safety management system, it is paramount to have scheduled training and drills because adequate training is the last barrier to reducing the severity of the accidents. For instance, if crews had been appropriately trained to execute the firefighting system, fire propagation could have been reduced, not causing more seriousness or casualties. The number of crew members can also affect individual workload. When a crew conducts a multitude of tasks simultaneously, it can increase the risk of fatigue and inaccurate work, which affects the accident’s severity level.
Table 8. The joint probability of RIFs with Human and ship management
|
RIFs -Human Error |
P (Very Serious Accident) (%) |
RIFs - Ship Management and Equipment |
P (Very Serious Accident) (%) |
|
Ships Manning (inadequate) |
60 |
Firefighting and Navigation Equipment (inadequate) |
73.7 |
|
Seafarers Certificate and Education (inadequate) |
52.8 |
Regulation or Procedure (inadequate) |
55.6 |
|
Operational Error |
54.9 |
Design Error |
71.2 |
|
Training and Drill (inadequate) |
62.5 |
Structural Condition (bad) |
66.7 |
|
|
|
Ship Certificates (inadequate) |
79.9 |
|
|
|
Safety Equipment (inadequate) |
71.2 |
For ship management and equipment, the most prevalent RIFs are inadequate ship certificates and documents, with a probability of 79.9% of very serious accidents. This condition often occurs in sinking cases, the most frequent accident for severe accidents in passenger vessels. It has been found that the vessel does not have the certified stability booklet, which is an important document for calculating the ship’s stability during loading conditions. In the absence of these documents, the calculations will be incorrect, resulting in the ship losing its buoyancy and stability. The second most influential RIF is the inadequate condition of Firefighting and Navigation equipment. Firefighting equipment plays a pivotal role in reducing the consequences of the fire or explosion accident or even responding to the fire so that the case only becomes a less serious marine incident.
To answer the first research question, with a smaller amount of data compared to multiple sources, the TAN-BN model proposed in this study is capable of mapping the causal relationship between the accident severity and several causal factors for the passenger vessels in the Indonesian waters area. In this case, the data from the accident investigation already represents all the accidents for passenger vessels in Indonesia. Consequently, the proposed TAN-BN model can be used in certain more segmented cases, such as specific to certain ship types [51-53], or specific areas [37, 54].
However, the limitation of the amount of data can certainly affect the model’s reliability. First, expert judgment is still needed to assess whether the model is generated automatically using the mutual information and maximum weight spanning tree approach based on data in accordance with the natural conditions in a passenger ship accident. Moreover, methods for validating TAN-BN models are limited, and this study only uses the Axiom theorem or model correctness. In contrast, predictive performance and model consistency verification methods cannot be used because they must use a percentage of the data as a reference. These two model validation techniques are difficult to conduct with limited data because data must be taken as a sample for the accuracy prediction model. However, the model correctness validation method is sufficient for validating the model based on its natural cause of maritime accidents.
Regarding accident severity, the passenger vessels are most likely to have a very serious maritime accident. This result is similar to other studies with the TAN-BN model, such as the study by Cao et al. [45] and Cakir et al. [55], which stated that passenger vessel accidents tend to result in total loss of structural damage and fatality to passengers and crewmembers. Nevertheless, the severity result also differs from another study from Wang et al. [44] which stated that passenger vessels are most likely to have serious marine casualties. Moreover, a study from Zhou et al. [35] stated that passenger vessels will have less serious accidents than fishing vessels and dredgers since the two compared vessel types are more likely to not comply with international or regional rules and regulations.
Regarding the accident type, the analysis has shown that in the passenger vessel, the accident type that is very sensitive to very serious accidents is sinking or capsizing. This result corroborates the study from Wang et al. [44] and Fan et al. [49], stating that sinking or capsizing often occurs in passenger vessels. These results are naturally appropriate because, in the event of a ship sinking accident, there is an inevitable loss of property, the ship sinks, and loss of life. On the other hand, this study also differs from other TAN-BN studies with the global perspective, which states that passenger vessels are more likely to have a collision accident [56-58] because the study collected data in several types of areas, such as canals or anchorage areas.
In this model, the sensitivity analysis process uses three methods, namely mutual information, joint probability, and the true risk influence. From the mutual information sensitivity analysis, there are six most influencing RIFs, and based on the entropy value, the ranking from the highest to the lowest are Accident Type>Ship Operation>Gross Tonnage>Accident Time> Violation Error> Engine Power. However, after the TRI calculations, the order has shifted to Ship Operation> Accident Type> Violation Error> Gross Tonnage> Accident Time> Engine Power. The difference between mutual information and TRI also happened in another TAN-BN model for maritime accident analysis [45]. This difference could happen because when calculating the TRI, all the states for the accident severity were analysed, and each state of RIFs influences different accident severity, which can cause changes to the average TRI value for each RIF. On the other hand, there are similarities in terms of the most influential RIFs according to the mutual information, which is the “Accident Type” with other studies such as [35, 45, 51, 53, 55], which concludes that the “Accident type” is the most significant RIFs to the accident severity.
The selection of RIFs in this TAN-BN model prioritises the internal conditions of the ship, as well as the influence of human error on accidents. The purpose of selecting RIFs is so that stakeholders or marine insurance parties can see which factors from the ship side can be controlled and mitigated by risk control measures. From the human-related factors, “Violation Error” is the most influential RIF for very serious accidents and ranked 3rd in the final ranking of RIFs by TRI. The ranking improvements of violation errors happen because, in Indonesia, the common violations often occur in maritime practice due to lack of supervision, such as allowing more cargo or passengers to be loaded exceeding the standard regulation and using electronic devices that non-marine uses that can cause electric short circuits. Ship equipment and management factors also contribute to the severity of the accidents. According to scenario 2, if the RIFs are related to improper ship management and terrible condition of the ship’s equipment, the probability of very serious accidents reaches its maximum value.
The primary results of the TAN-BN model, including sensitivity and scenario analyses, provide valuable insights for stakeholders such as regulators and decision-makers in addressing urgent issues based on severity levels. For example, ship sinking and capsizing are the most critical accident types, often leading to severe outcomes. As a result, regulators and shipping management should prioritise mitigating hazards and risks associated with these types of incidents. Additionally, the analysis highlights “Accident Time” as a significant factor, with the highest probability of severe accidents occurring between 04:00 and 08:00 AM. This finding underscores the need for enhanced safety measures during this watch period.
A comprehensive analysis emphasising certain types of ships and water areas is needed to analyse and identify maritime accidents. Passenger vessels are the ship type that requires this detailed analysis to create regulations, policies, and survey forms targeted for the passenger vessels, with the final intention to reduce the risk and accident level.
In this study, risk modelling using TAN-BN was carried out on 46 passenger ship accident data in Indonesia obtained from the NTSC investigation results. Compared with other research papers, 17 RIFs from these data are used in the model. The intention of selecting RIFs is to analyse factors from internal ship and human factors so that stakeholders can use them directly to make mitigative plans. So that external factors such as weather, season, and visibility are not integrated into the model.
TAN-BN modelling was used with the mutual information method in NETICA norsys software, with adjustments based on expert judgments. After that, the model was validated using the three-axiom method, and the model satisfied the requirements for all the axioms. The result of the posterior probability of the model is that half of the accident cases are very serious accidents, with 60.9% occurring in the passage and 41.3% of the accident type being fire and explosion. With these results, it can be concluded that for the passenger vessel, the critical condition that must be considered regarding maritime safety is when the ship is in transit. There are often conditions where the crew ignores safety during duty hours. Consequently, it is necessary to increase safety during the ship’s passage.
Sensitivity analysis determined the states in RIFs that influence accident severity most.
The method used was mutual information to analyse the dependence between variables, with the result that “Accident Type” and “Ship Operation” were the two RIFs with the highest values. However, after further analysis of TRI, the highest average value on accident severity is ship operation with a value of 39.91, followed by accident type in the second position with 32.72, and Violation Error in the third.
Other findings from the sensitivity and scenario analysis are:
This study identified several conditions within the RIFs that can lead to accidents with extremely high severity levels on passenger ships. To enhance maritime safety, particularly for passenger vessels, it is essential to implement preventive and mitigative measures addressing RIF failures. As demonstrated in the scenario analysis, improvements in equipment reliability, human performance, and effective shipping management can significantly reduce the likelihood of severe accidents.
The main limitation of this study is the low number of data compared to other studies. To compensate for the lack of data in the modelling process, expert judgment and another numerical method should be applied to strengthen and improve the model’s reliability. Furthermore, future research should prioritise the most critical aspects of the “Accident Type” and “Ship Operation” RIFs. Employing a Dynamic Bayesian Network to analyse severity trends over time can yield valuable insights and predictive models for the severity of passenger vessel accidents in relation to these RIFs.
The authors would like to express their gratitude to experts from the National Research and Innovation Agency and Department of Marine Engineering, Institut Teknologi Sepuluh Nopember, for their time in evaluating the TAN-BN model.
[1] Muntaha, A., Setyohadi, D., Isdianto, A. (2023). Enhancing safety and security: Facilities for wheelchair users in marine tourism area. International Journal of Safety and Security Engineering, 13(6): 1153-1161. https://doi.org/10.18280/ijsse.130619
[2] Jiang, M., Lu, J., Yang, Z., Li, J. (2020). Risk analysis of maritime accidents along the main route of the Maritime Silk Road: A Bayesian network approach. Maritime Policy & Management, 47(6): 815-832. https://doi.org/10.1080/03088839.2020.1730010
[3] Liu, K., Yu, Q., Yuan, Z., Yang, Z., Shu, Y. (2021). A systematic analysis for maritime accidents causation in Chinese coastal waters using machine learning approaches. Ocean & Coastal Management, 213: 105859. https://doi.org/10.1016/j.ocecoaman.2021.105859
[4] Eliopoulou, E., Alissafaki, A., Papanikolaou, A. (2023). Statistical analysis of accidents and review of safety level of passenger ships. Journal of Marine Science and Engineering, 11(2): 410. https://doi.org/10.3390/jmse11020410
[5] Mutmainnah, W., Bowo, L.P., Nurwahyudy, A., Prasetyo, F.A., Furusho, M. (2020). Causative factor analysis of passenger ship accident (Fire/Explosion) in Indonesia. In IOP Conference Series: Earth and Environmental Science, 557(1): 012037. https://doi.org/10.1088/1755-1315/557/1/012037
[6] National Transportation Safety Committee. (2023). NTSC Transport Accident Investigation Statistics Book 2022. Jakarta, Indonesia.
[7] Montewka, J., Manderbacka, T., Ruponen, P., Tompuri, M., Gil, M., Hirdaris, S. (2022). Accident susceptibility index for a passenger ship-a framework and case study. Reliability Engineering & System Safety, 218: 108145. https://doi.org/10.1016/j.ress.2021.108145
[8] Łozowicka, D., Kaup, M. (2015). Analysis of the cause and effect of passenger ship accidents in the Baltic Sea. Zeszyty Naukowe Akademii Morskiej w Szczecinie, 44(116): 68-73. https://doi.org/10.17402/059
[9] Pilatis, A.N., Pagonis, D.N., Serris, M., Peppa, S., Kaltsas, G. (2024). A statistical analysis of ship accidents (1990-2020) focusing on collision, grounding, hull failure, and resulting hull damage. Journal of Marine Science and Engineering, 12(1): 122. https://doi.org/10.3390/jmse12010122
[10] EMSA. (2022). European Maritime Safety Report. https://doi.org/10.2808/138925.
[11] Bowo, L.P., Ispandiari, A.R., Wibowo, D.A., Irawati, N., Furusho, M. (2024). Maritime accident analysis and reduction technique for analysing maritime collision accidents. Australian Journal of Maritime & Ocean Affairs, 1-28. https://doi.org/10.1080/18366503.2024.2350792
[12] Erol, S., Başar, E. (2015). The analysis of ship accident occurred in Turkish search and rescue area by using decision tree. Maritime Policy & Management, 42(4): 377-388. https://doi.org/10.1080/03088839.2013.870357
[13] Mazaheri, A., Montewka, J., Kujala, P. (2016). Towards an evidence-based probabilistic risk model for ship-grounding accidents. Safety Science, 86: 195-210. https://doi.org/10.1016/j.ssci.2016.03.002
[14] Bowo, L.P., Prilana, R.E., Furusho, M. (2021). Human error assessment of situation awareness in bridge operations: A case study of indonesian maritime accidents. In IOP Conference Series: Materials Science and Engineering, 1052(1): 012012. https://doi.org/10.1088/1757-899x/1052/1/012012
[15] de Maya, B.N., Komianos, A., Wood, B., de Wolff, L., Kurt, R.E., Turan, O. (2022). A practical application of the Hierarchical Task Analysis (HTA) and Human Error Assessment and Reduction Technique (HEART) to identify the major errors with mitigating actions taken after fire detection onboard passenger vessels. Ocean Engineering, 253: 111339. https://doi.org/10.1016/j.oceaneng.2022.111339
[16] Bowo, L.P., Gusti, A.P., Waskito, D.H., Puriningsih, F.S., Muhtadi, A., Furusho, M. (2024). Comprehensive analysis of navigational accidents using the MAART method: A novel examination of human error probability in maritime collisions and groundings. TransNav, International Journal on Marine Navigation and Safety of Sea Transportation, 18(3): 565-563. https://doi.org/10.12716/1001.18.03.10
[17] Berrada, H., Boutahar, J., El Ghazi El Houssaini, S. (2023). Roadmap and information system to implement information technology risk management. International Journal of Safety and Security Engineering, 13(6): 987-1000. https://doi.org/10.18280/ijsse.130602
[18] Waghmode, L.Y., Patil, R.B. (2013). An overview of fault tree analysis (FTA) method for reliability analysis. Journal of Engineering Research and Studies, 4(1): 6-8.
[19] Ugurlu, H., Cicek, I. (2022). Analysis and assessment of ship collision accidents using Fault Tree and Multiple Correspondence Analysis. Ocean Engineering, 245: 110514. https://doi.org/10.1016/j.oceaneng.2021.110514
[20] Antao, P., Guedes Soares, C. (2006). Fault-tree models of accident scenarios of RoPax vessels. International Journal of Automation and Computing, 3: 107-116. https://doi.org/10.1007/s11633-006-0107-8
[21] Gul, M., Yucesan, M., Celik, E. (2020). A manufacturing failure mode and effect analysis based on fuzzy and probabilistic risk analysis. Applied Soft Computing, 96: 106689. https://doi.org/10.1016/j.asoc.2020.106689
[22] Zhou, X., Cheng, L., Li, M. (2020). Assessing and mapping maritime transportation risk based on spatial fuzzy multi-criteria decision making: A case study in the South China sea. Ocean Engineering, 208: 107403. https://doi.org/10.1016/j.oceaneng.2020.107403
[23] Arslan, V., Kurt, R.E., Turan, O., De Wolff, L. (2016). Safety culture assessment and implementation framework to enhance maritime safety. Transportation Research Procedia, 14: 3895-3904. https://doi.org/10.1016/j.trpro.2016.05.477
[24] Uğurlu, Ö., Yıldız, S., Loughney, S., Wang, J., Kuntchulia, S., Sharabidze, I. (2020). Analyzing collision, grounding, and sinking accidents occurring in the Black Sea utilizing HFACS and Bayesian networks. Risk Analysis, 40(12): 2610-2638. https://doi.org/10.1111/risa.13568
[25] Salihoglu, E., Beşikçi, E.B. (2021). The use of Functional Resonance Analysis Method (FRAM) in a maritime accident: A case study of Prestige. Ocean Engineering, 219: 108223. https://doi.org/10.1016/j.oceaneng.2020.108223
[26] Yu, Y., Ahn, Y.J., Lee, C.H. (2023). Using FRAM for causal analysis of marine risks in the motor vessel Milano bridge accident: identifying potential solutions. Applied Sciences, 13(15): 8764. https://doi.org/10.3390/app13158764
[27] Uddin, M.I., Awal, Z.I. (2020). Systems-theoretic approach to safety of inland passenger ship operation in Bangladesh. Safety Science, 126: 104629. https://doi.org/10.1016/j.ssci.2020.104629
[28] Ceylan, B.O., Akyuz, E., Arslan, O. (2021). Systems-Theoretic Accident Model and Processes (STAMP) approach to analyse socio-technical systems of ship allision in narrow waters. Ocean Engineering, 239: 109804. https://doi.org/10.1016/j.oceaneng.2021.109804
[29] Zhang, J., Teixeira, Â.P., Soares, C.G., Yan, X. (2018). Quantitative assessment of collision risk influence factors in the Tianjin port. Safety Science, 110: 363-371. https://doi.org/10.1016/j.ssci.2018.05.002
[30] Waskito, D.H., Bowo, L.P., Puriningsih, F.S., Muhtadi, A., Kurniawan, I. (2024). Comprehensive analysis of ship sinking accidents using Bayesian network. Australian Journal of Maritime & Ocean Affairs, 1-24. https://doi.org/10.1080/18366503.2024.2389679
[31] Zhang, Q., Zheng, S. (2024). Causal analysis of accidents during wind power engineering construction using Bayesian networks. International Journal of Safety and Security Engineering, 14(1): 309-319. https://doi.org/10.18280/ijsse.140130
[32] Fan, S., Yang, Z., Blanco-Davis, E., Zhang, J., Yan, X. (2020). Analysis of maritime transport accidents using Bayesian networks. Proceedings of the Institution of Mechanical Engineers, Part O: Journal of Risk and Reliability, 234(3): 439-454. https://doi.org/10.1177/1748006X19900850
[33] Li, H., Ren, X., Yang, Z. (2023). Data-driven Bayesian network for risk analysis of global maritime accidents. Reliability Engineering & System Safety, 230: 108938. https://doi.org/10.1016/j.ress.2022.108938
[34] Wang, L., Yang, Z. (2018). Bayesian network modelling and analysis of accident severity in waterborne transportation: A case study in China. Reliability Engineering & System Safety, 180: 277-289. https://doi.org/10.1016/j.ress.2018.07.021
[35] Zhou, K., Xing, W., Wang, J., Li, H., Yang, Z. (2024). A data-driven risk model for maritime casualty analysis: A global perspective. Reliability Engineering & System Safety, 244: 109925. https://doi.org/10.1016/j.ress.2023.109925
[36] Li, K. X., Yin, J., Bang, H. S., Yang, Z., Wang, J. (2014). Bayesian network with quantitative input for maritime risk analysis. Transportmetrica A: Transport Science, 10(2): 89-118. https://doi.org/10.1080/18128602.2012.675527
[37] Kamal, B., Çakır, E. (2022). Data-driven Bayes approach on marine accidents occurring in Istanbul strait. Applied Ocean Research, 123: 103180. https://doi.org/10.1016/j.apor.2022.103180
[38] Passarella, R., Safitri, A.I., Husni, N.L., Widyastuti, R., Veny, H. (2024). Classification models for assessing the severity of marine accidents based on machine learning. International Journal of Safety and Security Engineering, 14(4): 1213-1221. https://doi.org/10.18280/ijsse.140418
[39] Pearl, J. (1988). Probabilistic reasoning in intelligent systems: Networks of plausible inference. Morgan Kaufmann.
[40] Xiao, S., Lu, Z., Wang, P. (2018). Multivariate global sensitivity analysis for dynamic models based on wavelet analysis. Reliability Engineering & System Safety, 170: 20-30. https://doi.org/10.1016/j.ress.2017.10.007
[41] Hänninen, M. (2014). Bayesian networks for maritime traffic accident prevention: Benefits and challenges. Accident Analysis & Prevention, 73: 305-312. https://doi.org/10.1016/j.aap.2014.09.017
[42] Jiang, M., Lu, J. (2020). The analysis of maritime piracy occurred in Southeast Asia by using Bayesian network. Transportation Research Part E: Logistics and Transportation Review, 139: 101965. https://doi.org/10.1016/j.tre.2020.101965
[43] Friedmann, H., Gröller, J. (2010). An approach to improve the Austrian Radon Potential Map by Bayesian statistics. Journal of Environmental Radioactivity, 101(10): 804-808. https://doi.org/10.1016/j.jenvrad.2009.11.008
[44] Wang, H., Liu, Z., Wang, X., Graham, T., Wang, J. (2021). An analysis of factors affecting the severity of marine accidents. Reliability Engineering & System Safety, 210: 107513. https://doi.org/10.1016/j.ress.2021.107513
[45] Cao, Y., Wang, X., Wang, Y., Fan, S., Wang, H., Yang, Z., Liu, Z., Wang, J., Shi, R. (2023). Analysis of factors affecting the severity of marine accidents using a data-driven Bayesian network. Ocean Engineering, 269: 113563. https://doi.org/10.1016/j.oceaneng.2022.113563
[46] Yang, Z., Yang, Z., Yin, J. (2018). Realising advanced risk-based port state control inspection using data-driven Bayesian networks. Transportation Research Part A: Policy and Practice, 110: 38-56. https://doi.org/10.1016/j.tra.2018.01.033
[47] IMO. (2018). Revised guidelines for formal safety assessment (FSA) for use in the imo rule-making process. London.
[48] Pristrom, S., Yang, Z., Wang, J., Yan, X. (2016). A novel flexible model for piracy and robbery assessment of merchant ship operations. Reliability Engineering & System Safety, 155: 196-211. https://doi.org/10.1016/j.ress.2016.07.001
[49] Fan, S., Blanco-Davis, E., Yang, Z., Zhang, J., Yan, X. (2020). Incorporation of human factors into maritime accident analysis using a data-driven Bayesian network. Reliability Engineering & System Safety, 203: 107070. https://doi.org/10.1016/j.ress.2020.107070
[50] Alyami, H., Yang, Z., Riahi, R., Bonsall, S., Wang, J. (2019). Advanced uncertainty modelling for container port risk analysis. Accident Analysis & Prevention, 123: 411-421. https://doi.org/10.1016/j.aap.2016.08.007
[51] Sevgili, C., Fiskin, R., Cakir, E. (2022). A data-driven Bayesian Network model for oil spill occurrence prediction using tankship accidents. Journal of Cleaner Production, 370: 133478. https://doi.org/10.1016/j.jclepro.2022.133478
[52] Kayiran, B., Yazir, D., Aslan, B. (2023). Data-driven Bayesian network approach to maritime accidents involved by dry bulk carriers in Turkish search and rescue areas. Regional Studies in Marine Science, 67: 103193. https://doi.org/10.1016/j.rsma.2023.103193
[53] Ma, X., Fan, S., Blanco-Davis, E., Shi, G., Yang, Z. (2024). Bulk carrier accident severity analysis in Australian waters using a data-driven Bayesian network. Ocean Engineering, 310: 118605. https://doi.org/10.1016/j.oceaneng.2024.118605
[54] Ma, L., Ma, X., Chen, L. (2024). A data-driven Bayesian network model for pattern recognition of maritime accidents: A case study of Liaoning Sea area. Process Safety and Environmental Protection, 189: 115-133. https://doi.org/10.1016/j.psep.2024.06.019
[55] Cakir, E., Sevgili, C., Fiskin, R. (2021). An analysis of severity of oil spill caused by vessel accidents. Transportation Research Part D: Transport and Environment, 90: 102662. https://doi.org/10.1016/j.trd.2020.102662
[56] Cao, Y., Wang, X., Wang, Y., Fan, S., Wang, H., Yang, Z., Liu, Z., Wang, J., Shi, R. (2023). Analysis of factors affecting the severity of marine accidents using a data-driven Bayesian network. Ocean Engineering, 269: 113563. https://doi.org/10.1016/j.oceaneng.2022.113563
[57] Liao, S., Weng, J., Zhang, Z., Li, Z., Li, F. (2023). Probabilistic modeling of maritime accident scenarios leveraging bayesian network techniques. Journal of Marine Science and Engineering, 11(8): 1513. https://doi.org/10.3390/jmse11081513
[58] Li, H., Zhou, K., Zhang, C., Bashir, M., Yang, Z. (2024). Dynamic evolution of maritime accidents: Comparative analysis through data-driven Bayesian networks. Ocean Engineering, 303: 117736. https://doi.org/10.1016/j.oceaneng.2024.117736