Siswanto![]() | Sukarman
| Sukarman![]() | Dodi Mulyadi*
| Dodi Mulyadi*![]() | Khoirudin
| Khoirudin![]() | Rizki Aulia Nanda
| Rizki Aulia Nanda![]() | Amri Abdulah
| Amri Abdulah![]() | Apang Djafar Shieddieque
| Apang Djafar Shieddieque![]() | Singgih Dwi Prasetyo
| Singgih Dwi Prasetyo![]()
© 2024 The authors. This article is published by IIETA and is licensed under the CC BY 4.0 license (http://creativecommons.org/licenses/by/4.0/).
OPEN ACCESS
This study delves into enhancing tungsten inert gas (TIG) welding using SUS 304 material to support small-scale industries. SUS 304 is a widely used material in household equipment and house fences, where TIG welding techniques are commonly employed, albeit with varying weld quality. The primary objective is to achieve the maximum tensile shear load (TS load) by applying response surface methodology (RSM). The study incorporates three input parameters: welding current, gas flow rate, and electrode diameter. Additionally, the research evaluates the impact of these parameters on hardness values measured across the welding zone, heat-affected zone, and base metal. This research endeavors to significantly advance welding techniques for thin stainless-steel materials, mainly focusing on SUS 304 stainless steel. The selection of SUS 304 (JIS G 4305) material, with a thickness of 1 mm, is based on its corrosion-resistant properties, commonly applied in domestic appliances and food industry applications requiring food-grade materials. The Stahlweld TIG 160 inverter welding machine, operating at a voltage of 220 V/50 Hz, was selected and configured for the study. The maximum TS-load results were achieved during the 12th iteration, registering a magnitude of 1393.00 kgf. Conversely, the highest hardness levels were observed across all welding regions, gradually diminishing in the heat-affected zone (HAZ) and reaching its lowest point in the base metal. The findings of this study align with the attainment of the eighth objective of the Sustainable Development Goals (SDGs), contributing to the advancement of sustainable industrial practices.
Box-Behnken, response surface methodology, SUS 304, TIG welding, tensile load strength
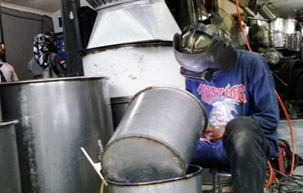
Improving the quality of household appliances crafted from stainless-steel SUS 304 underscores the importance of enhancing joining processes, notably TIG welding. Despite the widespread use of SUS 304, a comprehensive understanding of how TIG welding parameters influence its tensile strength still needs to be discovered. This research holds relevance as it promises critical insights into the production processes, aiming to yield more robust and durable household appliances. By elucidating the correlation between welding parameters and material strength, this study substantially enhances the design and performance of household appliances, aligning them more closely with consumer needs. Figure 1 provides an illustrative example of the application of TIG welding in this context.
Numerous studies within the modern industry of TIG welding highlight efforts by researchers to optimize TIG welding process parameters, employing robotic technology to enhance welding precision across various steel types [1]. Ahmad and Alam [2] employed Response Surface Methodology (RSM) to optimize TIG welding parameters to enhance joint quality. Samiuddin et al. [3] explored TIG welding parameters on aluminum alloys through mechanical and microstructural characterization. Meanwhile, Nurisna and Setiawan [4] assessed filler effects in TIG welding between carbon steel and 316L stainless steel, focusing on their impact on mechanical properties. Widyianto et al. [5] investigated mechanical properties, welding positions, and characteristics of Orbital Pulse Current Gas Tungsten Arc Welding (PC-GTAW) on AISI 304L stainless steel pipes, utilizing TIG technology. Shrivas et al. [6] explored TIG welding parameters to enhance weld strength, while Sirohi et al. [7] investigated autonomous TIG welding methods on Alloy 617 and AISI 304H steel for Advanced Ultra-Supercritical (AUSC) applications, emphasizing mechanical properties and microstructure.
The literature investigates different TIG welding parameters on the tensile strength and hardness of SUS 304 material. SUS 304 stainless steel is widely used in various household appliances due to its excellent corrosion resistance, durability, and aesthetic appeal. Typical applications include kitchen sinks, cookware, and home appliance components, where the material's performance directly impacts product quality and longevity. Given its extensive use, understanding the welding strength of SUS 304 steel is of paramount importance. Welding is a critical process in fabricating these appliances, and the integrity of weld joints determines the overall reliability and safety of the final product [8]. Despite having advantageous properties, SUS 304 stainless steel also presents complex challenges, particularly related to the mechanical properties of the resultant weld joints. Suboptimal welding techniques can lead to various defects, including cracking, porosity, and reduced tensile strength, which can adversely affect the structural integrity and longevity of the welded components. Therefore, a comprehensive investigation into the factors influencing the welding strength of SUS 304 stainless steel is critical [9].
The primary research objective is to elucidate the influence of Tungsten Inert Gas (TIG) welding parameters, including current, voltage, and electrode type, on the mechanical properties of SUS 304 material. By enhancing the understanding of these parameters' effects on tensile strength, this study aims to provide crucial insights for optimizing the manufacturing processes. This study aims to systematically investigate the effects of varying input parameters on the tensile strength of SUS 304 stainless steel using Response Surface Methodology (RSM) [10]. The experimental design incorporates three critical parameters: welding current, gas flow rate, and tungsten diameter, each varied at three levels. The focus on welding thin stainless-steel materials is expected to affect industries manufacturing stainless steel components for household appliances significantly. Data analysis was performed using statistical methods to evaluate the results' significance and ensure the findings' reliability and reproducibility. By employing techniques such as analysis of variance (ANOVA) and regression analysis, we were able to discern the relationships between the welding parameters and the resultant mechanical properties [7].
Figure 1. TIG welding application on panhandles [11]
2.1 Material
The material used in this study was SUS 304 stainless steel, which was chosen for its widespread application in household appliances. The chemical composition of the steel was confirmed through spectrographic analysis to ensure consistency with standard specifications. SUS 304 stainless steel has a thickness of 1 mm, which was primarily driven by its corrosion resistance properties, rendering it a popular choice for household utensils and applications within the food industry. Given the stringent requirements for food-grade materials, utilizing such materials is imperative [12]. The chemical composition of SUS 304 material, as per the JIS G 4305 standard, includes carbon (C) with a maximum limit of ≤ 0.08%, silicon (Si) with a maximum limit of ≤ 1.00%, manganese (Mn) with a maximum limit of ≤ 2.00%, phosphorus (P) with a maximum limit of ≤ 0.045%, sulfur (S) with a maximum limit of ≤ 0.030%, nickel (Ni) within a range of 8.00–10.50%, and chromium (Cr) within a range of 18.00–20.00%. Meanwhile, the mechanical properties of SUS 304 material comply with the JIS G 4305 standard, as detailed in Table 1 [13].
Table 1. The mechanical properties of SUS 304
|
Specification |
Proof Stress (N/mm2) |
Tensile Strength (N/mm2) |
Elongation (%) |
|
JIS G 4305 |
≥ 205 |
≥ 520 |
≥40 |
|
Test Report |
210 |
540 |
42 |
TIG welding employs WT20 tungsten electrodes by the ANSI/AWS A5.12M-98 ISO 6848 standards. Luoyang Jiangchi Metal Material Co., Ltd. produces tungsten electrodes in sizes of 1.6, 2.4, and 3.2 mm. These electrodes, resembling SUS 304, are readily available in the market [13, 14]. The composition of tungsten electrodes includes ThO2 dioxide and impurities, with percentages ranging from 1.70% to 2.20% and less than 0.20%, respectively [14]. The material preparation process involves utilizing a Q01-1.5x1320 (52*) foot shear machine at the Karawang UBP Laboratory to execute the shearing process. The cutting process necessitates the application of force, determined by Eq. (1) [15].
$F_s=R_m . S . L$ (1)
where, Fs is donated for the force shearing minimum (N), Rm is donated for tensile strength (MPa), and L is donated for the length of the material to be sheared (mm).
2.2 Tensile load test and welding design
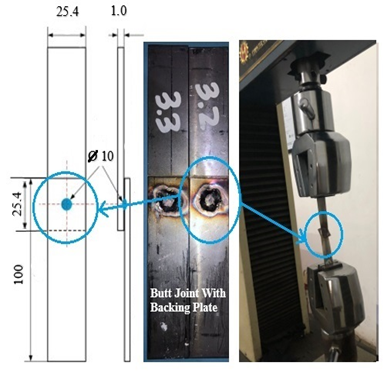
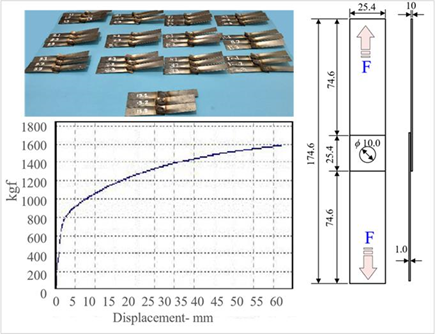
The design of TIG welding processes suggests the integration of supplementary support plates in welded joints to optimize shear and tensile stress distributions. Pressure plate joints should also be precisely calibrated to conform to established engineering standards. These modifications enhance the welds' structural integrity by ensuring that the stress states are within acceptable limits and that the joints meet the requisite performance criteria. The connection design has been meticulously prepared based on the specifications outlined in Figure 2 [16-18]. The welding design involves joining the support plate and the main plate by creating a welding area at a drilled hole with a diameter of 10.0 mm. Figure 2 illustrates the connection design and the data collection process for the research test samples. The Hung Ta HT-9102 50KN 380 Volt universal testing machine will conduct tensile testing on the research samples. The testing will be performed at a speed of 40 mm/minute, as depicted in Figure 2. The tensile testing machine was set and calibrated in kilograms-force (kgf). The stainless steel, chosen as per the JIS G 4305 reference standard, was precisely cut based on the design depicted in Figure 3.
Figure 2. TS-load testing and TIG welding design (all dimensions in millimeters)
2.3 TIG welding parameters and Box-Behnken parameter design
The experimental design for this study was structured to systematically investigate the effects of various welding parameters on the mechanical properties of SUS 304 stainless steel weld joints. Several experimental studies have utilized the RSM approach for process optimization, spanning multiple welding processes such as resistance spot welding [17, 19, 20] , laser welding [21], friction stir welding [22], TIG welding, and laser optimization hybrid [10]. Additionally, the effectiveness of the RSM method was chosen and demonstrated in optimizing research areas such as bio-jet oil [23], biodiesel processing [24], S-EDM [25], and machining processes [26].
The selection of RSM for this study builds upon previous research, aiming to investigate how changes in input parameters affect the tensile strength of SUS 304 material during TIG welding. The parameters utilized are controlled and listed in Table 2. These incorporate three input variables with three levels of control, resulting in thirteen experiments, as outlined in Table 3.
Table 2. The RSM Box-Behnken parameters
|
Code |
TIG-Welding Parameter |
Symbol |
Units |
Minimum |
Maximum |
|
A |
Welding current |
I |
A, ampere |
50 |
60 |
|
B |
Gas Flow rate |
$\dot{Vg}$ |
LPM |
12 |
18 |
|
C |
Electrode Diameter |
DE |
mm |
1.6 |
3.2 |
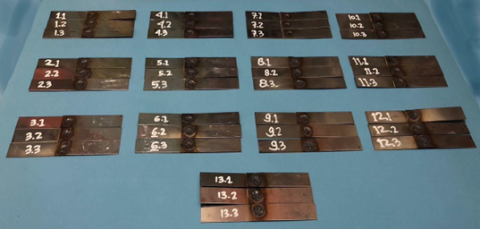
Figure 3. TIG welding coupon: 39-unit sample from 13 iterations of SUS 304 steel sheets
Table 3. TIG Welding sample Box-Behnken design parameters and identifications
|
Run No. |
Welding Current (A) |
Gas Flow Rate (LPM) |
Electrode Diameter (mm) |
Sample Identification |
||
|
TS Loads 1 |
TS Loads 1 |
TS Loads 1 |
||||
|
1 |
50 |
15 |
1.6 |
S-1.1 |
S-1.2 |
S-1.3 |
|
2 |
55 |
12 |
1.6 |
S-2.1 |
S-2.2 |
S-2.3 |
|
3 |
55 |
18 |
3.2 |
S-3.1 |
S-3.2 |
S-3.3 |
|
4 |
55 |
15 |
2.4 |
S-4.1 |
S-4.2 |
S-4.3 |
|
5 |
60 |
15 |
3.2 |
S-5.1 |
S-5.2 |
S-5.3 |
|
6 |
55 |
12 |
3.2 |
S-6.1 |
S-6.2 |
S-6.3 |
|
7 |
60 |
18 |
2.4 |
S-7.1 |
S-7.2 |
S-7.3 |
|
8 |
50 |
12 |
2.4 |
S-8.1 |
S-8.2 |
S-8.3 |
|
9 |
50 |
15 |
3.2 |
S-9.1 |
S-9.2 |
S-9.3 |
|
10 |
55 |
18 |
1.6 |
S-10.1 |
S-10.2 |
S-10.3 |
|
11 |
60 |
15 |
1.6 |
S-11.1 |
S-11.2 |
S-11.3 |
|
12 |
60 |
12 |
2.4 |
S-12.1 |
S-12.2 |
S-12.3 |
|
13 |
50 |
18 |
2.4 |
S-13.1 |
S-13.2 |
S-13.3 |
The Stahl weld TIG 160 welding inverter is selected and configured to operate at a voltage of 220 V with a frequency of 50 Hz. It provides a current range of approximately 10 to 160 amperes. Welders possessing a minimum of 5G certification are required to execute the welding procedure in strict adherence to safety protocols. The chosen input variables comprise the flow rate of argon gas, the electric current, and the diameter of the tungsten electrode. The TS load is selected and discussed as the output parameters for comprehensive investigation and experimentation. Employing Box-Behnken design parameters in Response Surface Methodology (RSM) facilitates the testing of system reactions to changes in process factors.
The TS load test sample is repeated thrice at each level, resulting in 39 samples, as illustrated in Figure 3. The objective is to regulate input parameters using the RSM approach, employing statistical software specified in Table 3.
2.4 The response surfaces and the contour plots
In the RSM approach, response surface and contour plots are essential graphical representations in statistical analysis, particularly within experimental design, optimization, and regression analysis contexts [27]. Response surfaces elucidate the correlation between two or more variables tailored to the specific area of investigation [28]. Analyzing experimental results and conducting surface response analysis makes the correlation between process variables and the measured response apparent. This comprehension aids in determining optimal conditions to achieve superior welding results. The outcomes of this research have the potential to significantly impact the advancement of more effective welding techniques within the industrial sector [10, 29].
Contour lines or variations in color gradients illustrate fluctuations in the magnitude of the response variable resulting from a combination of different independent variables. This study possesses the capacity to provide valuable insights into the optimal parameters for enhancing the quality of TIG welding by scrutinizing the variables influencing the process [30]. Typically, these plots aid in identifying the most favorable regions or desired outcomes based on specific criteria or limitations.
2.5 The evaluation of hardness in the welding and heat-affected zones
Hardness evaluation aims to assess the effect of TIG welding process parameters on the material's hardness, which is affected by the heat produced during welding. The objective is to gain insight into the consequences of heat during TIG welding and how this affects metal joints, explicitly focusing on steel and stainless steel [31]. Hardness testing is performed to evaluate the effects of welding on multiple regions, including the heat-affected zone (HAZ), the welding location, and the base metal.
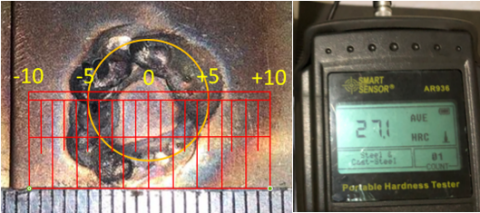
The AR936 Portable Hardness Tester determines the hardness by traversing the welding area, HAZ, and non-HAZ regions at 2.5 mm intervals, beginning at the circle's center within distinct heat-affected zone (HAZ) regions. The location of the welding area is approximately 5 mm radially from the center of the circle. On the other hand, the Heat Affected Zone (HAZ) is bounded by 8 to 10 mm and 0 to 2 mm from the center of the circle. Figure 4 Comprehensively depicts the welding site and the hardness measurement instrument, including specific details.
Figure 4. Hardness test of TIG welding samples
3.1 TS-load analysis
The test results presented in the table reveal variations in the performance of the welding process across different parameter combinations. The welding current ranged from 50 to 60 A, with the highest average TS-load observed in run eight at a welding current of 50 A. Gas flow rates varied from 12 to 18 LPM, with run 7 featuring a gas flow rate of 18 LPM, exhibiting the lowest average TS-load. Electrode diameters ranged from 1.6 to 3.2 mm. The TS-load average of TS Loads S1, TS Loads S2, and TS Loads S3 demonstrate variation with each iteration, with the fourth run showing the highest average stress test load. Despite run 4 having the highest average TS-load, the peak TS-load was achieved during the 12th iteration of the 3rd sample, specifically with sample code S-12.3. This condition occurred when welding current parameters were 60 A, a gas flow rate of 12 LPM, and an electrode diameter of 2.4 mm. These findings provide insights into the impact of parameter variations, including welding current, gas flow rate, and electrode diameter, on weld quality. Further investigation may employ S/N ratio analysis and ANOVA to identify the optimal parameter combination that meets the established criteria.
This work utilizes TS-load analysis to assess the impact of input parameters on TS-load. They present the outcomes of the TS-load experiment performed on SUS 304 using TIG welding in Table 4. Iteration S-12.3 achieved a maximum tensile strength load of 1581 kgf. These experiments involved manipulating variables to uncover this information. The data mentioned was obtained and evaluated by configuring the welding current parameters to 60A, the gas flow rate to 12 LPM, and the electrode diameter to 2.4 mm. The highest TS-load test results can be found in Table 4 and Figure 5.
Multiple linear regressions were conducted using statistical software to determine the average TS load. Examining the specific aims and capabilities of the chosen statistical software to enhance the comprehension and construction of linear regression models is advisable. The linear regression equation comprises three variables: A represents the welding current, B signifies the gas flow rate, and C denotes the electrode diameter. Therefore, Eq. (2) is the linear regression model for representing the TS load.
$TS-load$ $mean=15613+440 A+463 B+1224 C$ (2)
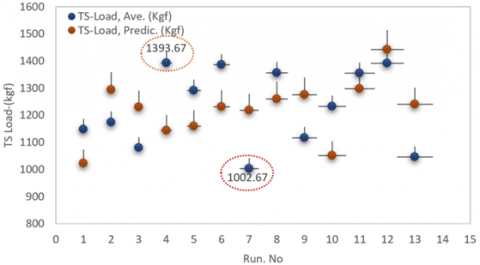
This investigation also analyzed the average value of Tensile Strength (TS) Loads, derived as the average of TS Loads S1, TS Loads S2, and TS Loads S3 within each experimental trial. The results reveal that the optimal average TS value of 1393.67 kgf is achieved by utilizing specific parameters: a welding current set at 55A, a gas flow rate set at 15 LPM, and an electrode diameter set at 2.4 mm. It signifies attaining the most efficient welding performance under these specified conditions. Conversely, when employing a welding current of 55A, a gas flow rate of 15 LPM, and an electrode diameter of 2.4 mm, the average TS value diminishes to a minimum of 1002.67 kgf. This observation implies the possible presence of suboptimal welding conditions.
TS-load is a crucial parameter for distinguishing between the average and predicted TS-load values using the provided data during calculations. The justification for this differentiation is outlined below. The highest average TS-load value indicates a 0% discrepancy between the actual and predicted values, signifying an exact expected value. Conversely, the minimum average TS-load data reveals an approximate 10.5% discrepancy in percentage, suggesting that the expected value exceeds the average TS-load value. The percentage difference reflects the degree of dissimilarity between the predicted value and the average TS-load value while indicating whether the prediction tends to be greater or lesser than the average value. This disparity in presentation can be utilized to determine the precision or accuracy of a forecasting method or model concerning the anticipated average value. Figure 6 illustrates the results of comparing the projected TS load with the average value.
3.2 The response surfaces and the contour plots analysis
Utilizing response surfaces and contour plots is crucial for analyzing and determining the optimal welding parameters necessary to attain the desired average value of TS-load in the welding process. The correlation between welding current, gas flow rate, and electrode diameter in the welding process is evident in Figure 7. The observational findings indicate that the average TS-load value rises as the welding current and gas flow rate increase, decreasing as the electrode diameter increases. The contour plot in Figure 7 visually represents the average TS-load value through its lines. Greener hues are used in contour plots to convey supplementary data, whereas darker shades indicate higher average TS-load values.
Table 4. TS-load experiment result and visual examinations
|
Run No. |
Welding Current (A) |
Gas Flow Rate (LPM) |
Electrode Diameter (mm) |
TS-Load (kgf) |
TS-Load, Ave. (kgf) |
Failure Mode Analysis |
||
|
TS Loads 1 |
TS Loads 1 |
TS Loads 1 |
||||||
|
1 |
50 |
15 |
1.6 |
1438 |
1034 |
972 |
1148.00 |
Pull out |
|
2 |
55 |
12 |
1.6 |
1109 |
1239 |
1176 |
1174.67 |
Pull out |
|
3 |
55 |
18 |
3.2 |
1080 |
1079 |
1081 |
1080.00 |
Pull out |
|
4 |
55 |
15 |
2.4 |
1193 |
1455 |
1533 |
1393.67 |
Pull out |
|
5 |
60 |
15 |
3.2 |
1292 |
1292 |
1292 |
1292.00 |
Pull out |
|
6 |
55 |
12 |
3.2 |
1497 |
1445 |
1218 |
1386.67 |
Pull out |
|
7 |
60 |
18 |
2.4 |
960 |
1122 |
926 |
1002.67 |
Pull out |
|
8 |
50 |
12 |
2.4 |
1293 |
1474 |
1304 |
1357.00 |
Pull out |
|
9 |
50 |
15 |
3.2 |
1079 |
999 |
1273 |
1117.00 |
Pull out |
|
10 |
55 |
18 |
1.6 |
1204 |
1255 |
1240 |
1233.00 |
Pull out |
|
11 |
60 |
15 |
1.6 |
1392 |
1357 |
1316 |
1355.00 |
Pull out |
|
12 |
60 |
12 |
2.4 |
1289 |
1306 |
1581 |
1392.00 |
Pull out |
|
13 |
50 |
18 |
2.4 |
1257 |
945 |
935 |
1045.67 |
Pull out |
Figure 5. The highest TS-load: run No. S-12.3
Figure 6. TS load experiment vs predictions
Figure 7. RSM Box-Behnken analysis: (a) surface and (b) contour plot
Elevating the welding current and gas flow rate has demonstrated a direct correlation with augmenting the heat transferred to the welded material, enhancing the weld's strength. In contrast, a larger electrode diameter causes reduced weld penetration, resulting in decreased weld strength.
The contour plots offer valuable guidance for determining the optimal welding parameters to attain the desired average TS-load value [32]. Augmenting the welding current and gas flow rate to enhance weld strength is advisable. Conversely, if the primary objective is to achieve deeper weld penetration, it is advisable to decrease the diameter of the electrode [33]. The data indicates that the welding parameters of a current of 55A, a gas flow rate of 15 LPM, and an electrode diameter of 2.4 mm resulted in the highest average TS-load value of 1393.67 kgf. While these TS-load values indicate a considerable weld strength, it is crucial to remember that other factors, such as material quality and welding technique, influence overall weld strength.
3.3 ANOVA evaluations
ANOVA identified significant welding parameters affecting the average tensile strength load. Results indicate that welding current notably influences outcomes, with substantial variations at 50 A, 55 A, and 60 A. In contrast, gas flow variations remain near the average TS load. Electrode diameter variations (1.6 mm, 2.4 mm, and 3.2 mm) significantly impact the average TS load. These critical findings assist in determining optimal welding parameters, as shown in Table 5. Further investigation or larger-scale experiments may be needed to fully understand these variables' interconnections and improve welding process parameters. ANOVA determined that gas flow rate and welding current significantly impact the TS load, with about 99% of overall parameters influenced by these factors. This observation aligns with prior studies [6, 8].
3.4 Hardness analysis
The hardness test results indicate that increasing the welding current leads to an elevation in the HRC at specific locations. However, the relationship between gas flow rate and electrode diameter exhibits no noticeable pattern. At multiple stages of the welding procedure, variations in hardness are detected and measured. Figure 8 illustrates the hardness measurements of nine points acquired from thirteen samples welded using TIG welding. The 6th iteration achieved its peak hardness of approximately 51.3 HRC at positions +5 mm and -5 mm. The results from each iteration indicate that the areas with the highest hardness are found and detected at distances of +5 mm and -5 mm from the centerlines. This phenomenon is logical since the two locations you specified receive the highest heat during TIG welding. The base metal experiences a decrease in hardness as it changes into the heat-affected zone (HAZ). Similar phenomena were reported in prior research [7] and [34], consistent with the present study's findings.
Statistical validation is necessary to determine the three variables that affect the hardness of SUS 304 steel after TIG welding. We employ Eq. (3) and the Pearson correlation method to examine the correlation between all parameters [35].
$r=\frac{n\left(\sum x y\right)-\left(\sum x\right)\left(\sum y\right)}{\sqrt{\left[n\left(\sum x^2\right)-\left(\sum x\right)^2\right]\left[n\left(\sum y^2\right)-\left(\sum y\right)^2\right]}}$ (3)
where, n is the number of data pairs, x is the value of the first variable, and y is the value of the second variable. ∑xy is the sum of the results of multiplying each pair of data x and y. of all values of the second variable. ∑x2 is the sum of the squares of each value of the first variable, and ∑y2 is the sum of the squares of each value of the second variable.
Figure 9 Illustrates the experimental Pearson correlation between distance welding currents. The strength and direction of the relationship between two continuous variables are quantified by Pearson correlation [36, 37]. Analyzing the correlation between the magnitude of the electric current and the hardness of the weld is possible with this coefficient. An electric current-hardness relationship is strongly positive, as indicated by a Pearson correlation of nearly 1, signifying that the hardness of TIG welds increases directly with the electric current. Conversely, a Pearson correlation coefficient approaching -1 represents an inverse association between hardness and electric current, where hardness decreases as electric current increases.
Table 5. ANOVA statistical linear model
|
Parameter Input |
DF |
Adj. SS |
Adj. MS |
F-Value |
P-Value |
% Contributions |
|
Welding current |
1 |
3,029 |
3,029 |
0.25 |
0.654 |
40% |
|
Gas flow rate |
1 |
4,450 |
4,450 |
0.36 |
0.59 |
59% |
|
Electrode diameter |
1 |
26 |
26 |
0 |
0.966 |
1% |
Figure 8. The hardness result examination of TIG welding SUS 304 material
Figure 9. Pearson correlation of welding current with hardness
Applying the Pearson correlation coefficient involves examining the relationship between welding hardness and electric current in TIG welding, with values ranging from -1 to 1 [38]. A positive correlation close to 1 indicates a strong positive association, where hardness increases proportionally with electric current. A coefficient approaching -1 signifies an inverse relationship, meaning hardness decreases as electric current increases. A coefficient close to zero indicates no linear relationship, suggesting that electric current may not significantly impact hardness.
The hardness of materials, including weld zones, heat-affected zones (HAZ), and base metals, is influenced by factors like cooling rates, chemical composition, and peak temperatures during welding processes [39]. Higher cooling rates lead to higher HAZ hardness, while martensite formation increases HAZ hardness compared to base metal. Chemical composition, including carbon, manganese, nickel, niobium, and molybdenum, affects HAZ hardness differently at varying peak temperatures. The microstructure and hardness distribution in HAZ of materials like T250 maraging steel also vary across different zones.
The effectiveness of the TIG welding procedure in SUS 304 can be affected by various parameter combinations, such as electrode diameter, gas flow rate, and welding current. Examining the TS load to ascertain these parameters' impact on weld strength constituted an evaluation. They employ the subsequent parameters of a gas flow rate of 15 LPM, an electrode diameter of 2.4 mm, and a welding current of 55 A, the highest TS load of 1533 kgf was achieved. According to the statistical analysis, variations in the welding current significantly impact the welding results. The statistical analysis results indicate that the welding current gas flow rate fluctuations have an insignificant effect. The TS load data exhibits a considerable resemblance to a normal distribution, enabling the application of suitable statistical techniques. The hardness tests indicate that an increase in welding current generally leads to a corresponding increase in hardness. However, the impact of gas flow rate and electrode diameter must be more consistent. Additional recommendations necessitate thorough examination and rigorous statistical analysis to authenticate the results while considering supplementary variables such as the welding materials utilized and the surrounding environmental conditions.
The Box-Behnken Response Surface Methodology (RSM) is a crucial technique for optimizing TIG welding operational variables, TS load, and surface hardness after processing. Future research should explore cultural values, methodologies, and demographic characteristics to develop a more comprehensive conceptual framework for practical instruction in teaching speech acts in English as a Foreign Language (EFL) contexts.
The author expresses gratitude to all individuals who have provided support and motivation during this endeavor, with particular recognition to supervisors for their guidance and encouragement in completing this final assignment and parents and wives whose steadfast prayers have fortified him. Moreover, sincere appreciation is expressed to peers in Mechanical Engineering for their support and constructive criticism. In conclusion, thank the entire Buana Perjuangan University Karawang LAB Team for providing the essential resources and conducive environment to accomplish this culminating project.
[1] Reddy, G.N., VenkataRamana, M. (2018). Optimization of process parameters in welding of dissimilar steels using robot TIG welding. In International Conference on Recent Advances in Materials, Mechanical and Civil Engineering, Hyderabad, India, p. 012096. https://doi.org/10.1088/1757-899X/330/1/012096
[2] Ahmad, A., Alam, S. (2019). Parametric optimization of TIG welding using Response Surface Methodology. Materials Today: Proceedings, 18: 3071-3079. https://doi.org/10.1016/j.matpr.2019.07.179
[3] Samiuddin, M., Li, J.L., Taimoor, M., Siddiqui, M.N., Siddiqui, S.U., Xiong, J.T. (2021). Investigation on the process parameters of TIG-welded aluminum alloy through mechanical and microstructural characterization. Defence Technology, 17(4): 1234-1248. https://doi.org/10.1016/j.dt.2020.06.012
[4] Nurisna, Z., Setiawan, E. (2020). Pengaruh filler pada pengelasan tig baja karbon dan stainless steel 316L terhadap sifat mekanik. Quantum Teknika: Jurnal Teknik Mesin Terapan, 1(2): 95-99. https://doi.org/10.18196/jqt.010214
[5] Widyianto, A., Baskoro, A.S., Kiswanto, G. (2022). Investigation on weld characteristic, welding position, microstructure, and mechanical properties in orbital pulse current gas tungsten arc welding of AISI 304L stainless steel pipe. International Journal of Technology, 13(3): 473-483. https://doi.org/10.14716/ijtech.v13i3.3134
[6] Shrivas, S.P., Vaidya, S.K., Khandelwal, A.K., Vishvakarma, A.K. (2020). Investigation of TIG welding parameters to improve strength. Materials Today: Proceedings, 26: 1897-1902. https://doi.org/10.1016/j.matpr.2020.02.416
[7] Sirohi, S., Kumar, A., Pandey, S.M., Purohit, P., Fydrych, D., Kumar, S., Pandey, C. (2023). Dissimilar autogenous TIG joint of Alloy 617 and AISI 304H steel for AUSC application. Heliyon, 9(9). https://doi.org/10.1016/j.heliyon.2023.e19945
[8] Amar, A., Sukarman, S., Khoirudin, K., Mulyadi, D., Basit, A., Suhara, A., Shieddieque, A.D., Cahyo, T.D. (2024). Enhancing TIG welding parameters for direct tensile load (DT-load) on various steel thicknesses. Jurnal Polimesin, 22(1): 112-119. http://doi.org/10.30811/jpl.v22i1.4892
[9] Xie, Y., Cai, Y., Zhang, X., Luo, Z. (2018). Characterization of keyhole gas tungsten arc welded AISI 430 steel and joint performance optimization. The International Journal of Advanced Manufacturing Technology, 99: 347-361. https://doi.org/10.1007/s00170-018-2257-6
[10] Ragavendran, M., Chandrasekhar, N., Ravikumar, R., Saxena, R., Vasudevan, M., Bhaduri, A.K. (2017). Optimization of hybrid laser–TIG welding of 316LN steel using response surface methodology (RSM). Optics and Lasers in Engineering, 94: 27-36. https://doi.org/10.1016/j.optlaseng.2017.02.015
[11] Suryadharma, D. (2018). Industri penggorengan raksasa asal “gang dag deg dog” bandung tembus pasar luar negeri. Kompasiana Beyond Blogging.
[12] Badan Pengawas Obat Dan Makanan (2019). Perubahan Atas Peraturan Badan Pengawas Obat Dan Makanan Nomor 25 Tahun 2019 Tentang Pedoman Cara Pembuatan Kosmetika Yang Baik.
[13] Japanese Standards Association. (2012). Japanese Industrial Standard JIS G 4305: Cold-Rolled Stainless Steel Plate, Sheet and Strip.
[14] ANSI/AWS A5.12/A5.12M-98. (1998). Specification for Tungsten and Tungsten-Alloy Electrodes for Arc Welding and Cutting.
[15] Krinninger, M., Steinlehner, F., Opritescu, D., Golle, R., Volk, W. (2017). On the influence of different parameters on the characteristic cutting surface when shear cutting aluminum. Procedia CIRP, 63: 230-235. https://doi.org/10.1016/j.procir.2017.03.156
[16] Sukarman, S., Abdulah, A., Shieddieque, A.D., Rahdiana, N., Khoirudin, K. (2021). Optimization of the resistance spot welding process of secc-af and sgcc galvanized steel sheet using the taguchi method. Sinergi, 25(3): 319-328. http://doi.org/10.22441/sinergi.2021.3.9
[17] Sukarman, S., Triyono, T., Kristiawan, B., Amir, A., Fazrin, N., Suhara, A., Azizah, R.L., Mucharom, F. (2023). Tensile shear load in resistance spot welding of dissimilar metals: An optimization study using response surface methodology. Mechanical Engineering for Society and Industry, 3(2): 66-77. https://doi.org/10.31603/mesi.9606
[18] Boiler, A.S.M.E. (1998). ASME Boiler and Pressure Vessel Code: An International Code. New York: American Society of Mechanical Engineers.
[19] Cao, X., Li, Z., Zhou, X., Luo, Z. (2021). Modeling and optimization of resistance spot welded aluminum to Al-Si coated boron steel using response surface methodology and genetic algorithm. Measurement, 171: 108766. https://doi.org/10.1016/j.measurement.2020.108766
[20] Mulyadi, D., Amir, A., Budiansyah, A.C., Sukarman, S., Khoirudin, K., Wibowo, L.A., Kumbarasari, S. (2024). The Box-Behnken response surface methodology approach to optimize tensile strength load in resistance spot welding using SPCC-SD steel. Jurnal Teknik Mesin Mechanical Xplore, 4(2): 47-60. https://doi.org/10.36805/jtmmx.v4i2.6090
[21] Heydari, H., Akbari, M. (2020). Investigating the effect of process parameters on the temperature field and mechanical properties in pulsed laser welding of Ti6Al4V alloy sheet using response surface methodology. Infrared Physics & Technology, 106: 103267. https://doi.org/10.1016/j.infrared.2020.103267
[22] Al-Sabur, R. (2021). Tensile strength prediction of aluminium alloys welded by FSW using response surface methodology–Comparative review. Materials Today: Proceedings, 45: 4504-4510. https://doi.org/10.1016/j.matpr.2020.12.1001
[23] Siswanto, A.P., Yulianto, M.E., Handayani, D., Faisal, M.M., Wardani, O.K., Kuvshinov, D. (2022). Response surface methodology for synthesis of bio-jet fuel from waste cooking oil using agitated ozone treatment. Materials Today: Proceedings, 63: S346-S348. https://doi.org/10.1016/j.matpr.2022.03.274
[24] Kolakoti, A., Setiyo, M., Waluyo, B. (2021). Biodiesel production from waste cooking oil: Characterization, modeling and optimization. Mechanical Engineering for Society and Industry, 1(1): 22-30. https://doi.org/10.31603/mesi.5320
[25] Selvarajan, L., Manohar, M., Udhaya Kumar, A., Dhinakaran, P. (2017). Modelling and experimental investigation of process parameters in EDM of Si3N4-TiN composites using GRA-RSM. Journal of Mechanical Science and Technology, 31: 111-122. https://doi.org/10.1007/s12206-016-1009-5
[26] Balasubramanian, P., Senthilvelan, T. (2014). Optimization of machining parameters in EDM process using cast and sintered copper electrodes. Procedia Materials Science, 6: 1292-1302. https://doi.org/10.1016/j.mspro.2014.07.108
[27] Arjmandi, H., Amiri, P., Pour, M.S. (2020). Geometric optimization of a double pipe heat exchanger with combined vortex generator and twisted tape: A CFD and response surface methodology (RSM) study. Thermal Science and Engineering Progress, 18: 100514. https://doi.org/10.1016/j.tsep.2020.100514
[28] Mathews, P.G. (2004). Design of Experiments with MINITAB. Quality Press, pp. 205-205.
[29] Ribeiro, R., Romão, E.L., Luz, E., Gomes, J.H., Costa, S. (2020). Optimization of the resistance spot welding process of 22MnB5-galvannealed steel using response surface methodology and global criterion method based on principal components analysis. Metals, 10(10): 1338. https://doi.org/10.3390/met10101338
[30] Ahmad, A., Alam, S. (2019). Integration of RSM with grey based Taguchi method for optimization of pulsed TIG welding process parameters. Materials Today: Proceedings, 18: 5114-5127. https://doi.org/10.1016/j.matpr.2019.07.508
[31] Lee, S.H. (2019). A hot cracking on dissimilar metal weld between A106Gr. B and A312 TP316L with buttering ERNiCr-3. Metals, 9(5): 533. https://doi.org/10.3390/met9050533
[32] Singh, N.K., Singh, Y. (2019). Experimental investigation and modeling of surface finish in argon-assisted electrical discharge machining using dimensional analysis. Arabian Journal for Science and Engineering, 44(6): 5839-5850. https://doi.org/10.1007/s13369-019-03738-5
[33] Muthu, P. (2019). Optimization of the process parameters of resistance spot welding of AISI 316l sheets using Taguchi method. Mechanics & Mechanical Engineering, 23(1). https://doi.org/10.2478/mme-2019-0009
[34] Datta, R., Mukerjee, D., Jha, S., Narasimhan, K., Veeraraghavan, R. (2002). Weldability characteristics of shielded metal arc welded high strength quenched and tempered plates. Journal of Materials Engineering and Performance, 11: 5-10. https://doi.org/10.1007/s11665-002-0001-7
[35] Sukarman, Kristiawan, B., Khoirudin, Abdulah, A., Enoki, K., Wijayanta, A.T. (2024). Characterization of TiO2 nanoparticles for nanomaterial applications: Crystallite size, microstrain and phase analysis using multiple techniques. Nano-Structures & Nano-Objects, 38: 101168. https://doi.org/10.1016/j.nanoso.2024.101168
[36] Kotu, V., Deshpande, B. (2018). Classification. Data Science: Concepts and Practice. Morgan Kaufmann, pp. 65-163.
[37] King, A.P., Eckersley, R. (2019). Descriptive statistics II: Bivariate and multivariate statistics. In Statistics for Biomedical Engineers and Scientists, Academic Press, pp. 23-56.
[38] Nettleton, D. (2014). Selection of variables and factor derivation. In Commercial Data Mining: Processing, Analysis and Modeling for Predictive Analytics Projects. Elsevier, pp. 79-104.
[39] Oliveira, J.P., Ponder, K., Brizes, E., Abke, T., Edwards, P., Ramirez, A.J. (2019). Combining resistance spot welding and friction element welding for dissimilar joining of aluminum to high strength steels. Journal of Materials Processing Technology, 273: 116192. https://doi.org/10.1016/j.jmatprotec.2019.04.018