Osmalina Nur Rahma*![]() | Khusnul Ain
| Khusnul Ain![]() | Alfian Pramudita Putra
| Alfian Pramudita Putra![]() | Riries Rulaningtyas
| Riries Rulaningtyas![]() | Nita Lutfiyah
| Nita Lutfiyah![]() | Khouliya Zalda
| Khouliya Zalda![]() | Nafisa Rahmatul Laili Alami
| Nafisa Rahmatul Laili Alami![]() | Rifai Chai
| Rifai Chai![]()
© 2024 The authors. This article is published by IIETA and is licensed under the CC BY 4.0 license (http://creativecommons.org/licenses/by/4.0/).
OPEN ACCESS
Amputation is sometimes utilized to overcome tissue death in human limbs. Prostheses offer individuals an effective solution for restoring their quality of life. The development of prosthetic control systems using EEG-acquired movement imagery signals is ongoing. This technology has proven a viable option due to its easy controllability by an individual's thought patterns. This study aimed to discover distinguishing features between imagery movement and grasping and opening hand movements. To this end, the proposed method is a classification using Long-Short Term Memory Network (LSTM) with various feature combinations of mean, standard deviation, variance, RMS, skewness, kurtosis, and PSD at alpha rhythm. Data were acquired from three healthy subjects using the Emotiv Epoc+Headset. The classification results showed that applying skewness and kurtosis features yielded an accuracy range of 73.52% to 100% for each subject's data. On the other hand, combining kurtosis and Power Spectrum Density (PSD) features resulted in 84.9% accuracy for the subjects' combined data. This result shows great potential in supporting the development of prosthetic control to improve the quality of life of an amputee.
amputation, imagery movement, skewness, kurtosis, alpha rhythm, Long-Short Term Memory Network
Amputation is a follow-up action taken when tissue death occurs in an individual's limbs as a result of an accident, fall, or case of Diabetes Mellitus. Amputation can affect all aspects of the sufferer's life, especially in aspects of daily motor movements. The prevalence of people in the world who experienced amputation in 2017 was 57.7 million people with the biggest cause being falls, followed by traffic and mechanical accidents [1]. According to data from the Central Bureau of Statistics (BPS) in 2020, as many as 22.5 million people in Indonesia experienced disabilities, with 16% of sufferers having difficulty using their hands [2]. In addition, the increasing cases of Diabetes Mellitus in Indonesia have also increased the number of people undergoing amputation due to complications in the patient's peripheral arteries [3]. This statement suggests that there is a growing demand for hand prosthetics.
The use of prostheses for amputee sufferers is one way to make it easier for sufferers to carry out daily activities and improve their quality of life. Several studies have been conducted to develop control methods for prostheses, such as myokine-metric [4], mechanomyography [5], EMG [6], speech recognition [7], EOG [8], and EEG [9]. These studies aim to improve the convenience and comfort of prosthetic users. EEG has gained widespread development among the several methods of controlling prostheses due to its high temporal resolution signals, non-invasive nature, and ease of installation [10]. However, EEG has several shortcomings, including low signal latency, the influence of skull thickness on the information obtained, and susceptibility to background disturbances [11].
The research currently being developed is regarding the classification of imagery movements which can be used to help develop control systems for prostheses. Imagery movement is a mental simulation where a person imagines motor movements without having to move their body parts directly [12]. The activated regions of the brain include the primary motor cortex, premotor cortex, somatosensory cortex, parietal cortex, and cerebellar cortex [13]. Signal processing steps, such as pre-processing, feature extraction, and classification, are necessary to extract the utmost information from the imagery movement signal. Several classifications have been carried out, including using Linear Discriminant Analysis (LDA) and Support Vector Machine (SVM) which achieved an accuracy of 83% [14], Extreme Learning Machine (ELM) with an accuracy of 85% [15], CNN with an accuracy of 84% [16], and Long-Short Term Memory Network (LSTM) with an accuracy of 96.6% [17].
In recent years, Artificial Neural Network (ANN) algorithms have begun to be widely developed in EEG research. This is because ANN can classify data that is non-linear. A Recurrent Neural Network (RNN) is known as a reliable algorithm for processing sequential data, such as language, dialogue, video, and audio [18]. However, RNN has limitations in processing data that require long-term memory and tend to experience vanishing gradients. Therefore, in 1997 the LSTM algorithm was developed by Greff et al. [19].
The EEG signal utilized for prosthesis control is imagery movement. Imagery movement refers to the state in which a person imagines themselves executing a motor movement without physically carrying it out. The activated regions of the brain include the primary motor cortex, premotor cortex, somatosensory cortex, parietal cortex, and cerebellar cortex [13]. Signal processing steps, such as pre-processing, feature extraction, and classification, are necessary to extract the utmost information from the imagery movement signal. Several studies have been conducted on the classification of signals for imagery movement using methods such as Linear Discriminant Analysis (LDA) and Support Vector Machine (SVM) [14], Extreme Learning Machine (ELM) [15], Convolutional Neural Network (CNN) [16], and Long-Short Term Memory Network (LSTM). The LSTM method achieved the highest accuracy of 96.6% [17].
The LSTM algorithm is a neural network algorithm developed from the Recurrent Neural Network (RNN) algorithm that can learn sequential data with long-term dependencies in time series [16]. Therefore, utilizing the LSTM method to classify imagery movement signals can be an explorative option. Several feature extraction methods have been used to classify imagery movement signals accurately. Wang extracted features by decomposing frequency bands and calculating entropy values in each band, resulting in a 96.6% accuracy rate [17]. The difference in accuracy can be caused by feature extraction carried out before classification. Zhang identified six features, including skewness, kurtosis, zero-crossing, amplitude spectrum density, Power Spectrum Density (PSD), and power in each frequency band, achieving an accuracy rate of 98.3% [20].
Thus, the proposed method in this research involves classifying hand opening and grasping imagery movements utilizing the LSTM approach with several statistical feature combinations from the alpha frequency band. This study aims to determine the most appropriate feature combination in discriminating between different types of imagery movements. The imagery movements of grasping and opening the hand were chosen because these movements are basic in daily activities. Thus, it is hoped that this research can increase accuracy in controlling the prosthetic hand so that it can improve the quality of life of an amputee.
2.1 Participants
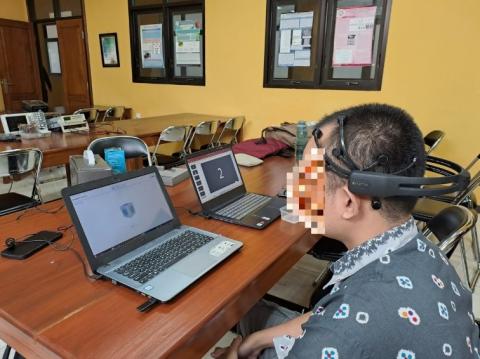
Experiments were conducted on three participants aged between 18 and 30 years without any history of neurological disorders. Before participation, each subject provided informed consent and completed the Movement Imagery Questionnaire-3 (MIQ-3) to assess their movement imagery capabilities [21]. The MIQ-3 consists of 12 questions, each using a Likert rating scale from 1 (most difficult to imagine) to 7 (easiest to imagine). The average value will be calculated by summing up the assessment results for each question. After completing the questionnaire, the subject sits facing a computer screen that displays a simulation of imagery movement training during data acquisition, as shown in Figure 1.
Figure 1. An experimental setup for data acquisition
2.2 Data acquisition
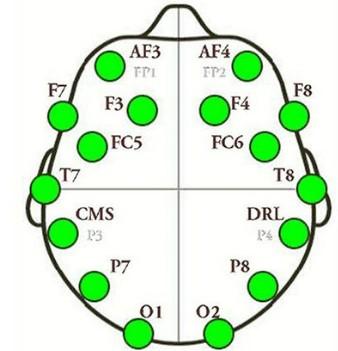
Data acquisition was performed using the Emotiv Epoc+ Headset EEG device, which has a fixed electrode arrangement for easy attachment to different subjects. The device has a sampling frequency of 128 Hz and 14 channels (AF3, F7, F3, FC5, T7, P7, O1, O2, P8, T8, FC6, F4, F8, AF4). It utilizes a 10-20 type montage with the electrode locations shown in Figure 2.
Figure 2. Emotiv Epoc+Headset montage [22]
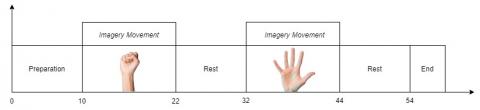
Subjects trained their imagery movement skills by simulating the motion of a cube on the EmotivPRO software. Once the training results met the minimum limit, grasping and opening imagery movement data was acquired for 54 seconds using OpenViBE software. Details of the movement’s timeline are shown in Figure 3. Each subject underwent data acquisition 10 to 15 times.
Figure 3. Experimental timeline for each session
2.3 Pre-processing
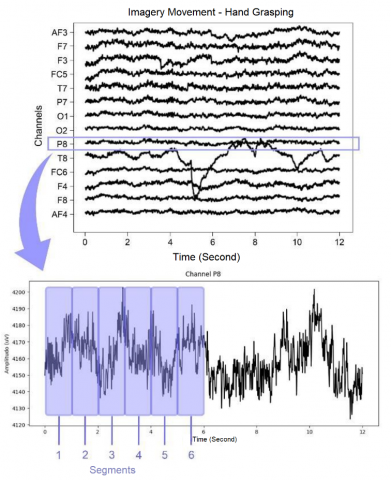
All movement imagery data is processed using the Python programming language. In addition, the collected data undergoes pre-processing, which begins with separating the different hand movements, namely opening and grasping, for 12 seconds. Each imagery movement signal then undergoes signal filtering using a Butterworth IIR Bandpass Filter Order 5 with a cut-off frequency of 8-13 Hz. Butterworth filters are frequently used in biosignal processing because they have smooth passband characteristics and initial attenuation without ripple [23]. The signal is filtered to obtain signals in the alpha frequency band while removing noise artifacts. Signals in the alpha frequency band were selected due to the dominant appearance of alpha and beta rhythms in the brain during imagery movement activities, particularly in the sensorimotor and parietal cortex areas [24]. The filtered data is segmented every second during processing, resulting in 12 segments for each input. Figure 4 illustrates the segmentation process applied to hand-grasping imagery movement data.
Figure 4. Illustration of the segmentation process occurring every second
2.4 Feature extraction
Feature extraction is performed on imagery movement data with alpha rhythm and has gone through the segmentation process. Each data segment yields seven statistical features: mean, standard deviation, variance, root mean square (RMS), skewness, kurtosis, and power spectral density (PSD) as calculated using Eq. (1) to Eq. (7). The resulting total features are 98, representing 14 channels × 7 features per subject.
Mean $\left( {\bar{x}} \right)=\frac{1}{N}\underset{i=1}{\overset{N}{\mathop \sum }}\,{{x}_{i}}$ (1)
Standard deviation $\left( \sigma \right)=\sqrt{\frac{{{({{x}_{i}}-\bar{x})}^{2}}}{N}}$ (2)
Variance (${{\sigma }^{2}})=\frac{{{({{x}_{i}}-\bar{x})}^{2}}}{N}$ (3)
Root Mean Square $\left( RMS \right)=\sqrt{\frac{1}{N}\mathop{\int }_{0}^{N}x_{i}^{2}dx}$ (4)
Skewness $\left( S \right)=\frac{\frac{1}{N}\mathop{\sum }_{i=1}^{N}{{({{x}_{i}}-\bar{x})}^{2}}}{{{(\frac{1}{N-1}\mathop{\sum }_{i=1}^{N}{{({{x}_{i}}-\bar{x})}^{2}})}^{3/2}}}$ (5)
Kurtosis $\left( K \right)=\frac{\frac{1}{N}\mathop{\sum }_{i=1}^{N}{{({{x}_{i}}-\bar{x})}^{2}}}{{{(\frac{1}{N-1}\mathop{\sum }_{i=1}^{N}{{({{x}_{i}}-\bar{x})}^{2}})}^{2}}}-3$ (6)
Power Spectral Density$\left( {{S}_{xn}}\left( \omega \right) \right)=\underset{T\to \infty }{\mathop{\lim }}\,E\left[ {{\left| \hat{X}\left( \omega \right) \right|}^{2}} \right]$ (7)
where, N is the total data, xi$~$is the i-data input and $\hat{X}\left( \omega \right)$ is input in frequency domain.
In order to determine the appropriate feature type for a given type of imagery movement, a Pearson correlation value is calculated within a range of -1 to 1. A positive correlation indicates a directly proportional relationship, while a negative correlation shows an inversely proportional relationship. A value closer to 0 indicates a weaker correlation between variables. Based on Asuero's research on interpreting correlation values, a correlation value of at least 0.3 must be achieved for features to be deemed relevant in the feature variation [25].
2.5 LSTM algorithm and data analysis
The feature extraction data is split into 70% training and 30% test data before inputting into the LSTM. Labels 0 and 1 represent the hand opening and grasping classes, respectively. Since LSTM works with 3-dimensional input data, the original 2-dimensional data representing features × segments was reshaped using Numpy's reshape function into a 3-dimensional format representing samples × timesteps × features. The number of timesteps used is 12, representing the number of segments in each dataset.
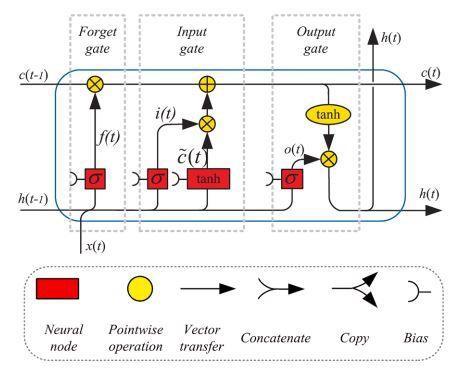
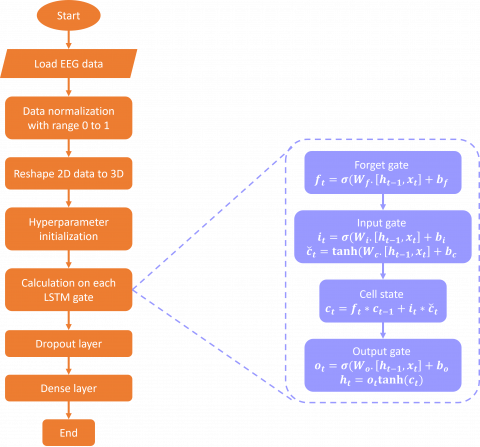
The LSTM algorithm is a type of neural network algorithm that evolved from RNN. In the LSTM architecture (Figure 5), there are cell states (ct-1 and ct) that play the role of storing information during the classification process in LSTM. Information will be updated through several gates in the LSTM and combined in the cell state. The classification process in LSTM starts from processing information at the forget gate. Forget gate (ft) plays the role of selecting input data and discarding data that is not needed [26]. Following the combination of input data from the forget gate and the input gate within the cell state, the output gate releases the classification result data [27]. The results of the classification process are fed into the Dropout Layer to prevent overfitting, followed by the Dense Layer for interpreting the results. The LSTM algorithm utilized in this study is presented in Figure 6.
The classification was performed with an epoch of 100 and a batch size 64. Since the Neural Network algorithm is stochastic, the classification process on each input training data is repeated ten times, and the accuracy value is calculated from the average of all training. Afterward, the test data is classified, and the performance of the LSTM model is evaluated. Classification results are evaluated using the confusion matrix. The positive label is represented by the hand-grasping class (label 1), and the negative label is represented by the hand-opening class (label 0).
The evaluation metrics are accuracy, precision, and Kappa score. Accuracy measures the rate of correctness of the classification results to the total amount of data. Precision measures the reliability degree of the model in classifying data labeled as "positive." The Kappa Score measures the classification consistency.
Figure 5. LSTM architecture [28]
Figure 6. LSTM algorithm
3.1 Subjects
The MIQ-3 assessment of the three subjects yielded results between 5.16 and 6.58 on a Likert scale of 1 to 7. These outcomes suggest that the subjects have exceptional imagery movement ability. The data set obtained from the participants consisted of 78 data points detailed in Table 1.
Table 1. Collected data from each subject
|
Subjects |
Imagery Movement Class |
Data Amount of Each Subject |
|
|
Hand Open |
Hand Close |
||
|
1 |
10 |
10 |
240 |
|
2 |
15 |
15 |
360 |
|
3 |
14 |
14 |
336 |
|
Total |
39 |
39 |
78 |
The data acquisition results were then subjected to pre-processing, which involved signal filtering to obtain the alpha rhythm and segmentation to enhance the number of machine learning inputs. Segmentation occurs every second for each movement type, resulting in 936 data points from the three subjects after the segmentation process. Refer to Table 2 for a breakdown of data amounts by subject.
Table 2. Collected data after segmentation
|
Subjects |
Imagery Movement Class |
Data Amount of Each Subject |
|
|
Hand Open |
Hand Close |
||
|
1 |
120 |
120 |
240 |
|
2 |
180 |
180 |
360 |
|
3 |
168 |
168 |
336 |
|
Data From All Subjects |
936 |
||
3.2 Feature extraction and correlation
Features were extracted from all EEG channels, resulting in 98 features represented in the table columns. Table 3 presents the feature extraction results for the three subjects. Pearson correlation can be utilized to calculate the correlation coefficient between each feature and the type of imagery movement based on the obtained feature extraction results. The correlation calculation aims to identify features related to the type of imagery movement. Table 4 presents the correlation analysis results for each feature and its association with the type of imagery movement.
Table 3. Feature extraction results
|
Data |
Mean-AF3 |
Mean-F7 |
Mean-F3 |
$\cdots $ |
|
0 |
0.1499E+15 |
0.1367E+15 |
0.2057E+15 |
$\cdots $ |
|
1 |
-0.054E+14 |
-0.055E+14 |
-0.057E+13 |
$\cdots $ |
|
2 |
0.047E+14 |
0.009E+13 |
-0.004E+13 |
$\cdots $ |
|
3 |
0.002E+13 |
0.057E+14 |
0.120E+15 |
$\cdots $ |
|
4 |
-0.036E+14 |
-0.037E+14 |
-0.096E+13 |
$\cdots $ |
|
$\vdots $ |
$\vdots $ |
$\vdots $ |
$\vdots $ |
$\cdots $ |
|
933 |
0.143E+16 |
0.056E+16 |
0.155E+15 |
$\cdots $ |
|
934 |
-0.085E+15 |
-0.033E+16 |
-0.122E+16 |
$\cdots $ |
|
935 |
0.039E+16 |
-0.062E+16 |
0.026E+16 |
$\cdots $ |
Table 4. Correlation coefficient between each feature towards imagery movement types
|
Variable |
Correlation Coefficient |
|||
|
Subject 1 |
Subject 2 |
Subject 3 |
All Subjects |
|
|
Mean |
-0.004 |
0.005 |
-0.005 |
-0.000 |
|
Std. Deviation |
-0.110 |
-0.180 |
-0.027 |
-0.084 |
|
Variance |
-0.098 |
-0.078 |
0.056 |
-0.002 |
|
RMS |
-0.110 |
-0.180 |
-0.027 |
-0.084 |
|
Skewness |
-0.093 |
-0.430 |
0.210 |
-0.055 |
|
Kurtosis |
-0.420 |
-0.690 |
0.580 |
-0.160 |
|
PSD |
-0.420 |
-0.120 |
0.055 |
-0.001 |
Features were selected based on a minimum correlation value of ±0.3 and included in the low correlation category based on the correlation interpretation results [25]. The calculations reveal that Subject 1 exhibits low correlation values on the kurtosis and PSD features. Subject 2 displays a low correlation value on the skewness feature and a moderate correlation value on the kurtosis feature. Additionally, Subject 3 demonstrates a medium correlation value on the kurtosis feature. When the information from the three subjects was aggregated, the feature calculation showed a notably low value. This occurrence is influenced by individual differences in brain conditions, which may result from variations in a person's learning process during a task [29] and brain topography, which may affect signal conductivity [30]. Following the correlation calculation, the Skewness, Kurtosis, and PSD features were chosen to be combined. However, it is necessary to validate the relationship between the features and the type of imagery movement using the LSTM algorithm.
3.3 7-feature classification
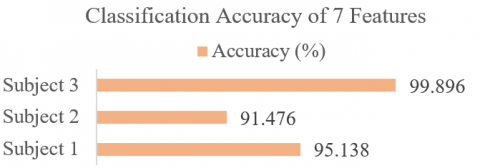
After the feature extraction results are obtained, the data proceeds to the classification stage utilizing the LSTM algorithm. Classification is performed on each subject's data using seven features. The rationale for subject-by-subject classification is to account for differences in individual's brain condition, as detailed in Section 3.2. The accuracy value of the 7-feature classification on each subject is presented in Figure 7.
Figure 7. Classification accuracy of 7 features
Figure 8. Classification accuracy of each feature
The classification results demonstrate varying accuracy among each subject. Subject 3 exhibits the highest accuracy compared to the other two subjects. This result is due to differences in hair thickness, with Subject 3 having the thinnest hair. The Emotiv Epoc+Headset device employs wet electrodes that require moistening with saline liquid. The electrode surface dries quicker as the subject's hair thickens, resulting in a decline in electrode conductivity.
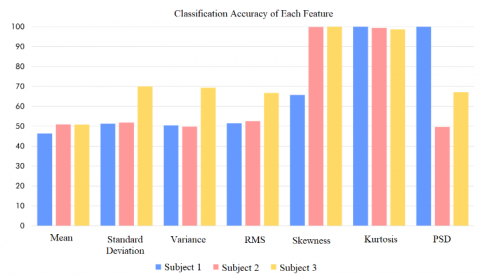
A classification was conducted using each feature on each subject to determine the distinguished characteristics of imagery movement types. Figure 8 displays the accuracy graph for each feature on each subject. The skewness, kurtosis, and PSD features exhibit significant graphs across all three subjects compared to other features.
Table 5 displays detailed accuracy values for each feature. Subject 1 has high accuracy values for the kurtosis and PSD features, while subjects 2 and 3 have high accuracy values for the skewness and kurtosis features. As a result, calculating the average accuracy of the skewness, kurtosis, and PSD features in all three subjects yields a higher value than the other features. This finding aligns with the correlation value calculations in Subsection 3.2, which demonstrate that skewness, kurtosis, and PSD features play a role in differentiating between types of imagery movement.
Table 5. Detailed accuracy values from each feature classification
|
Feature |
Accuracy (%) |
Accuracy Average (%) |
||
|
Subject 1 |
Subject 2 |
Subject 3 |
||
|
Mean |
46.83 |
50.94 |
50.83 |
49.38 |
|
Std. Deviation |
51.25 |
51.87 |
49.79 |
57.71 |
|
Variance |
50.42 |
49.79 |
69.38 |
56.04 |
|
RMS |
51.53 |
52.50 |
66.77 |
56.93 |
|
Skewness |
65.69 |
99.89 |
100.00 |
87.97 |
|
Kurtosis |
100.00 |
99.38 |
98.65 |
99.34 |
|
PSD |
100.00 |
49.69 |
67.08 |
72.26 |
3.4 Selected feature classification
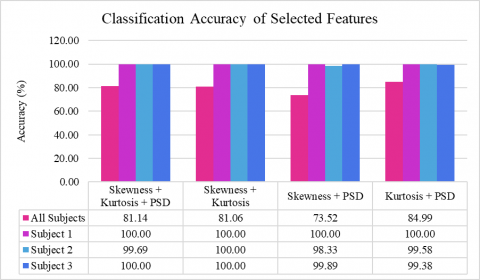
Feature variation is carried out to determine the most compelling feature combination for distinguishing between types of imagery movement. The classification results and correlation calculations reveal that a combination of skewness, kurtosis, and PSD features is suitable for classification purposes. Figure 9 presents the classification results for the various feature combinations.
Figure 9. Classification accuracy of selected feature combinations
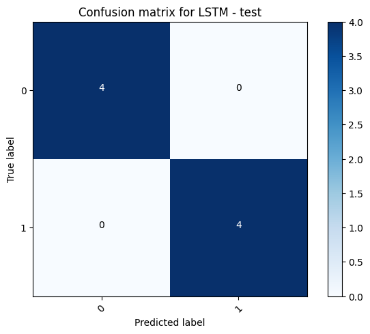
In addition to accuracy, precision and Kappa score metrics are also used to evaluate the classification results. These metrics can be analyzed from the confusion matrix of the test data. The confusion matrix of the classification using skewness and kurtosis features with each subject's input data is shown in Figure 10(a)-(c).
(a)
(b)
(c)
Figure 10. Test data confusion matrix with skewness and kurtosis input: (a) Subject 1; (b) Subject 2; (c) Subject 3
According to the findings illustrated in Figure 10, the combination of skewness and kurtosis features after being classified by using LSTM in each subject displays a 100% accuracy rate. Skewness and kurtosis are statistical features used to determine signal distribution and peaks [31]. These findings suggest that the two classes of imagery movements have different signal shapes. Meanwhile, the combination of kurtosis and PSD features yielded the highest accuracy value (84.99%) in the combined subject data. These features demonstrate signal shape and power variations among subjects engaging in different types of imagery movements.
The precision value for all three subjects was 1, with a Kappa score of 1 out of a possible range of 0 to 1. These results could be because the data used for testing on each subject was collected on the same day from the same subject. As a result, the machine learning model could easily classify the data.
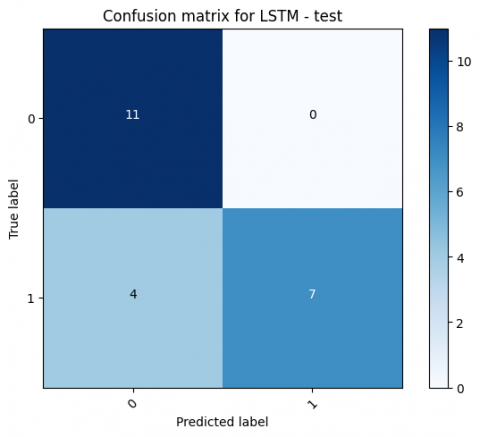
The precision and Kappa score values were calculated for the classification of combined subject data with kurtosis and PSD feature inputs. The confusion matrix of the classification results is presented in Figure 11, which reveals a precision value of 1 and a Kappa score of 0.64. Interestingly, the precision value for all feature combinations is also 1, as the majority of misclassification involves the label "Grasping" being classified as "Opening".
Figure 11. Test data confusion matrix with kurtosis and PSD input on merged data
Achieving 100% accuracy on each subject's data is irrelevant to the real world [32]. To double-check the performance of the machine learning models when the accuracy reaches 100%, the k-cross validation method can be used. The principle of the k-cross validation method involves dividing data into training and validation data, repeated K times with different combinations of training and test data [33]. Therefore, this research used the k-cross validation method with K=5.
Table 6 shows an accuracy value obtained in the range of 61.91% - 100.00%. This shows that the LSTM model can classify movement imagery quite well repeatedly with different input data.
Based on the results of the classification that was carried out with a variety of features, it was found that combining the test data of the three participants caused a decrease in accuracy values. This can be caused because the topography of each human brain is different, which can affect the performance of the nerves in the brain when carrying out an action [34, 35]. A person's learning ability to understand a task also causes variability between subjects [36]. Therefore, many methods have begun to be developed to overcome this in BCI development to minimize adjustment time before data acquisition.
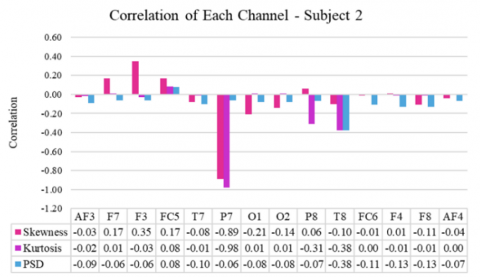
Apart from differences in brain topography and learning processes for individual, classification results are also influenced by the area of brain activation when performing imagery movements. According to Fakhruzzaman et al. [37], certain areas are activated in the brain during imagery movements. To explore this, a correlation of the seven features was carried out with the type of movement in each EEG channel in each participant's data, as in Figure 12.
Table 6. Classification accuracy of k-cross validation (k=5)
|
All Subjects |
||||||
|
Feature |
Fold 1 |
Fold 2 |
Fold 3 |
Fold 4 |
Fold 5 |
Average |
|
Kurtosis + PSD |
85.94 |
98.96 |
82.81 |
67.77 |
77.77 |
82.65 |
|
Skewness + PSD |
74.47 |
61.46 |
63.54 |
62.22 |
59.44 |
64.22 |
|
Skewness + Kurtosis |
83.85 |
57.29 |
62.5 |
86.66 |
71.66 |
72.39 |
|
Skewness + Kurtosis + PSD |
57.81 |
90.62 |
68.75 |
69.99 |
92.22 |
75.87 |
|
Subject 1 |
||||||
|
Feature |
Fold 1 |
Fold 2 |
Fold 3 |
Fold 4 |
Fold 5 |
Average |
|
Kurtosis + PSD |
100.00 |
100.00 |
95.83 |
75.00 |
100.00 |
94.16 |
|
Skewness + PSD |
95.83 |
100.00 |
75.00 |
75.00 |
100.00 |
89.16 |
|
Skewness + Kurtosis |
70.83 |
75.00 |
95.83 |
100 |
100.00 |
88.33 |
|
Skewness + Kurtosis + PSD |
100.00 |
100.00 |
70.83 |
93.75 |
75.00 |
87.91 |
|
Subject 2 |
||||||
|
Fitur |
Fold 1 |
Fold 2 |
Fold 3 |
Fold 4 |
Fold 5 |
Average |
|
Kurtosis + PSD |
86.11 |
100.00 |
100.00 |
97.22 |
81.94 |
93.05 |
|
Skewness + PSD |
79.16 |
87.50 |
95.83 |
80.55 |
75.00 |
83.60 |
|
Skewness + Kurtosis |
100.00 |
83.33 |
83.33 |
100.00 |
100.00 |
93.33 |
|
Skewness + Kurtosis + PSD |
83.33 |
83.33 |
100.00 |
100.00 |
100.00 |
93.33 |
|
Subject 3 |
||||||
|
Fitur |
Fold 1 |
Fold 2 |
Fold 3 |
Fold 4 |
Fold 5 |
Average |
|
Kurtosis + PSD |
100.00 |
79.16 |
95.83 |
100.00 |
78.33 |
90.66 |
|
Skewness + PSD |
100.00 |
95.83 |
81.94 |
60.00 |
64.99 |
80.55 |
|
Skewness + Kurtosis |
93.05 |
83.33 |
100.00 |
80.00 |
94.99 |
90.27 |
|
Skewness + Kurtosis + PSD |
83.33 |
100.00 |
83.33 |
100.00 |
89.99 |
91.33 |
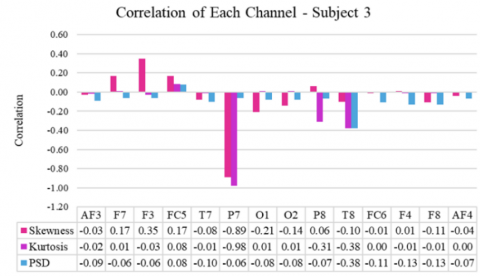
Figure 12. Correlation calculation results for each channel on each subject
Based on the results of the correlation calculations that have been carried out, the minimum limit for the correlation level for each channel that is considered dominant is ±0.50. Figure 12 shows the results of correlation calculations on Subject 1 data, where channel F3, channel P7, and channel O1 have a moderate level of correlation. Subject 2 shows that the correlation value above 0.5 is on channel P7 with a high level of correlation. The calculation results on Subject 3 data show that correlation values above 0.5 are found in channel P7 with a moderate level of correlation and channel F8 with a high level of correlation. From the three participants, a fairly high correlation was found in the P7 channel or the parietal area of the left hemisphere. According to Jiang et al, the parietal area is activated when participants carry out internal imagery movements or imagine themselves making movements from a first-person perspective [38].
Based on the analysis results in Figure 12, it can be seen that the use of multiple channels in EEG data acquisition does not always produce good classification accuracy. Thus, it is necessary to reduce channels based on the type of EEG signal being acquired. Besides being able to increase the accuracy of classification results, channel reduction can also reduce the computational load so that signal processing can be more efficient. Consider incorporating time intervals during data collection, multiplying data, and utilizing the k-cross validation method for analysis. This suggestion is expected to improve the classification of different types of imagery movements. Besides, it could reduce the computational work due to the complexity. Moreover, it will be beneficial for the real-time implementation in the future.
The classification of imagery movement using the LSTM method with various features produces different accuracy levels. For each subject's data, the combination of skewness and kurtosis features exhibits favorable classification outcomes, with a precision level of 1, a Kappa score of 1, and an accuracy rate of 73.52%-100%. The combination of kurtosis and PSD features in the combined data of the three subjects demonstrated promising classification results, yielding an accuracy percentage of 84.9%, a precision level of 1, and a Kappa score of 0.64.
Further research methods are needed to improve the system's ability to classify types of imagery movement. It is recommended to implement time intervals during data collection to increase data variation and enable the classification of more complex data, which became our limitation in this study. Sampling subjects with thin hair characteristics can also facilitate the data collection process. Additionally, the selection channel may be advantageous for appraising LSTM models and reducing the computational work for real-time applications in the future.
The research was funded by Faculty of Science and Technology, Universitas Airlangga (Grant No.: 1901/UN3.1.8/PT/2023).
[1] McDonald, C.L., Westcott-McCoy, S., Weaver, M.R., Haagsma, J., Kartin, D. (2021). Global prevalence of traumatic non-fatal limb amputation. Prosthetics and Orthotics International, 45(2): 105-114. https://doi.org/10.1177/0309364620972258
[2] Staf Ahli Menteri Bidang Sosial dan Penanggulangan Kemiskinan, Kementrian PPN/Bappenas, "Kajian Disabilitas, Tinjauan Peningkatan Akses dan Taraf Hidup Penyandang Disabilitas Indonesia: Aspek Sosio-Ekonomi dan Yuridis," Staf Ahli Menteri Bidang Sosial dan Penanggulangan Kemiskinan, Kementrian PPN/Bappenas, Jakarta, 2021.
[3] Purwanti, L.E. (2014). Hubungan motivasi dengan efikasi diri pasien dm tipe 2 dalam melakukan perawatan kaki di wilayah kerja puskesmas ponorogo utara. Gaster, 11(1): 68-77. https://doi.org/10.30787/gaster.v11i1.71
[4] Heath, G.H. (2003). Control of proportional grasping using a myokinemetric signal. Technology and Disability, 15(2): 73-83. https://doi.org/10.3233/TAD-2003-15203
[5] Silva, J., Heim, W., Chau, T. (2005). A self-contained, mechanomyography-driven externally powered prosthesis. Archives of Physical Medicine and Rehabilitation, 86(10): 2066-2070. https://doi.org/10.1016/j.apmr.2005.03.034
[6] Artemiadis, P.K., Kyriakopoulos, K.J. (2010). EMG-based control of a robot arm using low-dimensional embeddings. IEEE Transactions on Robotics, 26(2): 393-398. https://doi.org/10.1109/TRO.2009.2039378
[7] Fan, B.H., Li, K.Y. (2010). The speech control system of intelligent robot prosthesis. In 2010 Second WRI Global Congress on Intelligent Systems, Wuhan, China, pp. 407-409. https://doi.org/10.1109/GCIS.2010.69
[8] Duvinage, M., Castermans, T., Dutoit, T. (2011). Control of a lower limb active prosthesis with eye movement sequences. In 2011 IEEE Symposium on Computational Intelligence, Cognitive Algorithms, Mind, and Brain (CCMB), Paris, France, pp. 1-7. https://doi.org/10.1109/CCMB.2011.5952116
[9] Looned, R., Webb, J., Xiao, Z.G., Menon, C. (2014). Assisting drinking with an affordable BCI-controlled wearable robot and electrical stimulation: A preliminary investigation. Journal of Neuroengineering and Rehabilitation, 11: 1-13. https://doi.org/10.1186/1743-0003-11-51
[10] Kokate, P., Pancholi, S., Joshi, A.M. (2021). Classification of upper arm movements from EEG signals using machine learning with ICA analysis. arXiv preprint arXiv:2107.08514. https://arxiv.org/abs/2107.08514
[11] Nsugbe, E. (2021). Brain-machine and muscle-machine bio-sensing methods for gesture intent acquisition in upper-limb prosthesis control: A review. Journal of Medical Engineering & Technology, 45(2): 115-128. https://doi.org/10.1080/03091902.2020.1854357
[12] Hall, J.E. (2011). Guyton and Hall Textbook of Medical Physiology. http://avaxho.me/blogs/ChrisRedfield.
[13] Mulder, T. (2007). Motor imagery and action observation: cognitive tools for rehabilitation. Journal of Neural Transmission, 114: 1265-1278. https://doi.org/10.1007/s00702-007-0763-z
[14] Suwannarat, A., Pan-Ngum, S., Israsena, P. (2018). Comparison of EEG measurement of upper limb movement in motor imagery training system. Biomedical Engineering Online, 17: 1-22. https://doi.org/10.1186/s12938-018-0534-0
[15] Pranoto, F.C.P., Widodo, A.W., Rahman, M.A. (2019). Klasifikasi sinyal otak motor imagery menggunakan extreme learning machine dan discrete fourier transform. Jurnal Pengembangan Teknologi Informasi dan Ilmu Komputer, 3(3): 2215-2224.
[16] Tayeb, Z., Fedjaev, J., Ghaboosi, N., Richter, C., Everding, L., Qu, X., Conradt, J. (2019). Validating deep neural networks for online decoding of motor imagery movements from EEG signals. Sensors, 19(1): 210. https://doi.org/10.3390/s19010210
[17] Wang, P., Wang, M., Zhou, Y., Xu, Z., Zhang, D. (2022). Multiband decomposition and spectral discriminative analysis for motor imagery BCI via deep neural network. Frontiers of Computer Science, 16: 1-13. https://doi.org/10.1007/s11704-021-0587-2
[18] Uyulan, C. (2020). Development of LSTM&CNN based hybrid deep learning model to classify motor imagery tasks. bioRxiv, 2020-09. https://doi.org/10.1101/2020.09.20.305300
[19] Greff, K., Srivastava, R.K., Koutník, J., Steunebrink, B. R., Schmidhuber, J. (2016). LSTM: A search space odyssey. IEEE Transactions on Neural Networks and Learning Systems, 28(10): 2222-2232. https://doi.org/10.1109/TNNLS.2016.2582924
[20] Zhang, G., Davoodnia, V., Sepas-Moghaddam, A., Zhang, Y., Etemad, A. (2019). Classification of hand movements from EEG using a deep attention-based LSTM network. IEEE Sensors Journal, 20(6): 3113-3122. https://doi.org/10.1109/JSEN.2019.2956998
[21] Williams, S.E., Cumming, J., Ntoumanis, N., Nordin-Bates, S.M., Ramsey, R., Hall, C. (2012). Further validation and development of the movement imagery questionnaire. Journal of Sport and Exercise Psychology, 34(5): 621-646.
[22] EMOTIV. (2018). Epoc+User Manual. https://emotiv.gitbook.io/epoc-user-manual/, accessed on 15 October 2022.
[23] Semmlow, J. (2018). Circuits, Signals, and Systems for Bioengineers. New York: Elsevier.
[24] Edelman, B.J., Baxter, B., He, B. (2015). EEG source imaging enhances the decoding of complex right-hand motor imagery tasks. IEEE Transactions on Biomedical Engineering, 63(1): 4-14. https://doi.org/10.1109/TBME.2015.2467312
[25] Asuero, A.G., Sayago, A., González, A.G. (2006). The correlation coefficient: An overview. Critical Reviews in Analytical Chemistry, 36(1): 41-59. https://doi.org/10.1080/10408340500526766
[26] Aldi, M.W.P., Jondri, J., Aditsania, A. (2018). Analisis dan implementasi long short term memory neural network untuk prediksi harga bitcoin. eProceedings of Engineering, 5(2).
[27] Olah, C. (2015). Understanding LSTM networks. http://colah.github.io/posts/2015-08-Understanding-LSTMs/, accessed on 16 October 2022.
[28] Yu, Y., Si, X., Hu, C., Zhang, J. (2019). A review of recurrent neural networks: LSTM cells and network architectures. Neural Computation, 31(7): 1235-1270. https://doi.org/10.1162/neco_a_01199
[29] Herzfeld, D.J., Shadmehr, R. (2014). Motor variability is not noise, but grist for the learning mill. Nature Neuroscience, 17(2): 149-150.
[30] Antonakakis, M., Schrader, S., Aydin, Ü., Khan, A., Gross, J., Zervakis, M., Wolters, C.H. (2020). Inter-subject variability of skull conductivity and thickness in calibrated realistic head models. Neuroimage, 223: 117353. https://doi.org/10.1016/j.neuroimage.2020.117353
[31] Mudhiganti, R.P. (2012). A comparative analysis of feature extraction techniques for EEG signals from alzheimer patients. University of Texas, Texas. http://hdl.handle.net/10950/65.
[32] Dietterich, T.G. (1998). Approximate statistical tests for comparing supervised classification learning algorithms. Neural Computation, 10(7): 1895-1923. https://doi.org/10.1162/089976698300017197
[33] Arlot, S., Celisse, A. (2010). A survey of cross-validation procedures for model selection. Statistics Surveys, 4: 40-79. https://doi.org/10.1214/09-SS054
[34] Smith, S., Duff, E., Groves, A., Nichols, T.E., Jbabdi, S., Westlye, L.T., Douaud, G. (2019). Structural variability in the human brain reflects fine-grained functional architecture at the population level. Journal of Neuroscience, 39(31): 6136-6149. https://doi.org/10.1523/JNEUROSCI.2912-18.2019
[35] Seghier, M.L., Price, C.J. (2018). Interpreting and utilising intersubject variability in brain function. Trends in Cognitive Sciences, 22(6): 517-530. https://doi.org/10.1016/j.tics.2018.03.003
[36] Herzfeld, D.J., Shadmehr, R. (2014). Motor variability is not noise, but grist for the learning mill. Nature Neuroscience, 17(2): 149-150. https://doi.org/10.1038/nn.3633
[37] Fakhruzzaman, M.N., Riksakomara, E., Suryotrisongko, H. (2015). EEG wave identification in human brain with Emotiv EPOC for motor imagery. Procedia Computer Science, 72: 269-276. https://doi.org/10.1016/j.procs.2015.12.140
[38] Jiang, D., Edwards, M.G., Mullins, P., Callow, N. (2015). The neural substrates for the different modalities of movement imagery. Brain and Cognition, 97: 22-31. https://doi.org/10.1016/j.bandc.2015.04.005