Mattakoyya Aharonu![]() | R Lokesh Kumar*
| R Lokesh Kumar*![]()
©2024 The authors. This article is published by IIETA and is licensed under the CC BY 4.0 license (http://creativecommons.org/licenses/by/4.0/).
OPEN ACCESS
Lung cancer, recognized as one of the most lethal malignancies globally, manifests predominantly as lung adenocarcinoma (LUAD) within the broader classification of non-small cell lung cancer (NSCLC). The imperative for accurate and prompt diagnosis to facilitate efficacious treatment underscores the significance of advancements in diagnostic methodologies. This study introduces a convolutional neural network (CNN) framework tailored for the interpretation of bioinformatics datasets, specifically focusing on the classification of lung adenocarcinoma. Emphasizing the integration of gene-based biomarker informatics, this approach endeavors to mitigate hierarchical discrepancies inherent within similarity indices encountered during dataset processing. Through the utilization of three gene expression datasets—GSE118370, GSE85841, and GSE32863—sourced from the Gene Expression Omnibus (GEO), key features indicative of lung adenocarcinoma were meticulously analyzed. This methodology not only facilitates the precise categorization of data samples into lung adenocarcinoma but also enhances the reliability of the findings. The implementation of this CNN framework on the specified datasets yielded a classification accuracy of 93.32% and a precision of 94.56%, thereby surpassing the performance metrics of existing techniques. This research underscores the potential of integrating CNNs with bioinformatics for the refined classification of lung adenocarcinoma, heralding a significant step forward in the precise identification of this prevalent form of lung cancer.
adenocarcinoma categorization, non-small cell lung cancer (NSCLC), bioinformatics, classification, convolutional neural network (CNN), lung adenocarcinoma
Lung cancer is the leading cause of death in the world. The American Cancer Society (ACS) predicts that in 2023, there will be 238,340 new cases of lung cancer, and 127,070 people will die from the disease, or about 20% of all cancer-related deaths. The most common types of lung cancer are small-cell lung cancer (SCLC) and non-small-cell lung cancer (NSCLC). About 80% to 85% of lung cancers are NSCLC, and 15% to 20% of all lung cancers are SCLC [1]. Lung adenocarcinoma is a subtype of NSCLC, with more than 40% of reported cancers being positive in the lungs. Adenocarcinoma [2] is an organ-lining cancer caused by the stomach, lungs, and liver. The scenario of adenocarcinoma in the lungs is termed a critical cancer [3]. The epidemiology of this cancer is influenced by a number of factors, including genetic predispositions, environmental contaminants, and tobacco use. Furthermore, new developments, such as an increasing frequency among non-smokers, emphasize the necessity of a sophisticated comprehension of risk variables in order to properly customize screening and preventative measures. This is primarily caused by smoking habits [4]. Lung adenocarcinoma's high prevalence, intricate biology, and difficult diagnostic environment make it a major challenge in contemporary oncology. A full knowledge of its underlying biology and epidemiology is necessary to improve early detection and treatment efficacy. Lung adenocarcinoma is a very challenging malignancy due to its histological variation and molecular heterogeneity. EGFR, KRAS, and ALK are only a few of the numerous genetic disorders associated with the tumor, which often originates in the tissues around the lung's margins. Given that the illness is more aggressive due to the intricate connections between these hereditary factors, accurate diagnosis and targeted therapy are essential for improving patient outcomes [5]. For the purpose of classifying cancers based on gene expression data, several supervised and unsupervised machine learning techniques, as well as deep learning approaches, have been developed. The research objectives from various research labs have proposed novel approaches and methodologies. The researchers have primarily used biomedical datasets and image archives for computation and validation. With the advancement of datasets and validation techniques, the process of genomic bioinformatics dataset further provided reliable support in providing reliable decision-making.
The advancement of bioinformatics and the representation of genomic sequence via open datasets and standards such as GSE118370, GSE85841, and GSE32863. The process of creating genomic sequences is interdependent on representing and providing a futuristic learning approach. The major research challenge is to blend the genomic sequence with computational techniques and the environment. The process of computation includes machine learning and neural networking-based alignments of bioinformatics tools for improving decision-making capabilities. In this research article, a focus is shifted to bioinformatics-based computation of lung adenocarcinoma classification and categorization. The research motivation is to assure and implement the progression of dataset dimensionality mapping via bio-makers and attribute-based patterns. The proposed technique assures that the medical dataset will retain its originality and compute the digitalized sequence of patterns and information, thus choosing CNN over other potential machine learning algorithms for feature extraction and classification [6]. Comparative analysis is shown Table 1.
The article discusses an introduction and literature in the early sections, followed by problem statement discussion and methodology in sections 3 and 4.
The mathematical model is discussed in Section 5 on attribute mapping and coordination via CNN for categorization and decision-making.
The article is concluded with a dedicated results and outcome discussion in sections 8 and 9, respectively.
Table 1. Differences between machine learning and CNN
|
Feature |
Machine Learning |
CNN |
|
Feature extraction and representation |
Feature vectors used in machine learning are application-specific and manually produced. These traits are complicated and challenging to model. |
CNNs are able to identify the optimum pattern for improving identification accuracy by learning attributes from raw data. |
|
Diversity and Generalization |
Data with tags was used for machine learning. In order to concentrate on feature selection, employ dimensionality reduction techniques. |
It is possible to extract complicated attributes from complex data using CNN. |
|
Variations in the Temporal and Spatial Dimensions of Activities |
Handcrafted elements are inadequate and unsuited for addressing inter-class links and variability in machine learning environments. |
Hierarchical features and translational invariant features can be used to solve handcrafted characteristics with intra-class variability. |
|
Training and Execution Time of the Model |
Smaller data sets can be used for classical training to help train the model and save computing power and space |
A large number of datasets like gene Expression data are used for CNN in order to prevent overfitting. A graphics processing unit is used to accelerate it (GPU). It's also used to expedite calculations. |
Adenocarcinoma lung cancer is critical and sensitive; the symptoms and validation records are minimal, and hence various researchers have proposed multiple techniques and methodologies for upgrading the decision-making capabilities.
The basics of adenocarcinoma and artifacts are discussed in the study of reference [7]. The process of diagnosing and consulting on sensitive diseases has changed from time to time. With modern-day technological tools in the biomedical field, the process of biomarkers and bio-maker labels plays a vital role. The early stages of detection, diagnosis, and treatment of lung cancer can be a boon for patients [8]. There are various types and classification patterns of lung cancers, as discussed in the studies of reference [9, 10].
According to a study in China, tobacco is the source of an epidemic scenario of lung cancer cases increasing [11]. These cancer patients are diagnosed at a late stage, and hence the treatment options are vivid and hypothetical in the process of training and understanding the patient's behavior. Various researchers have proposed and validated studies on genome sequencing and its impact on the biological reasons for cancer. The study [12] discusses the landscape priorities and impact of adenocarcinoma in eastern Asia and the geopolitical countries associated with it. The studies in references [13, 14] are associated with the knowledge-sharing system creation and distribution for patient early detection and diagnosis. These studies have now been subjected to modern approaches to lung cancer diagnosis and interoperation.
The terminology of machine learning approaches includes neural networking framework-based computation. The process includes larger neural network (NN) datasets and streams. These datasets are termed MOTIF [15], or a sequence of repeated patterns in bioinformatics datasets. The inclusion improves the interpretation ratio and diagnosis strength for lung cancer classification and prediction. The primary objective is to provide a novel mining technique for attribute extraction, as discussed in the studies of reference [16, 17]. These approaches assure the progression of technological development towards computational technologies [18], and hence the bio-marking labels and datasets are degenerate into a standard and computed for reliable decision-making.
The process of biomarker identification and classification is derived from multiple representative datasets, such as the carcinoma identification and marking of labels with highlighting parameters. Chen and Dhahbi [19] discuss a novel technique for collective classification and managing the labels of biomarkers. Further, the process of lung adenocarcinoma is processed and validated using gene representation datasets [20]. The technique includes a checkpoint and immune screening approach for gene labeling. This improves the scope of classification and categorizing cancer [21-23].
The further improvisation is reported by Sadhwani et al. [24] using histopathology images of the tumor. These images are a collective representation of a multi-dimensional model of datasets.
The processing and classification of lung adenocarcinoma is derived and optimized using the aligned technique of osteoporosis identification [25].
The technique is derived from NN-based artificial immune system extraction. The technique typically includes a matrix of ratio labeling in the datasets to map attribute ratios and generate a bioinformatics dataset representation. Further, this data processing logic [26] can be implemented and acquired for lung adenocarcinoma bioinformatics dataset generation. The inclusive approaches to cancer identification are supported by Hong et al. [27, 28]. World Health Organization (WHO) reports and standards. Employing de-identified Hematoxylin and Eosin (H&E)-stained whole slide pictures, a deep learning system was created to classify histologic patterns in lung adenocarcinoma and predict TMB status [29]. aimed to assess the International Association for the Study of Lung Cancer's (IASLC) grade system's prognostic value for invasive lung adenocarcinoma [30]. used a CNN and soft-voting as the decision function to find solid, micropapillary, acinar, and cribriform growth patterns, as well as areas that aren't tumors, to help figure out how big the growth patterns are [31]. To investigate the classification and risk assessment of lung adenocarcinoma [32].
Lung adenocarcinoma-based lung cancer prediction is a major research challenge. The process of classifying and categorizing the datasets is an unstructured process of extracting features and attribute values. The primary datasets (Dx) are extracted from a medical dataset repository with typical medical notations and representations. These representations cannot be used as a row dataset element for training a model. Hence, the primary objective of dataset digitalization is to provide a reliable backup and restoration point for arbitrary datasets.
The featured parameters, attributes, and features of NSCLC’ datasets are the primary source of digitalization and processing. The datasets are initially customized and aligned with basic medical parameters and computation values. Hence, a novel framework is required to classify and categorize adenocarcinoma lung cancer based on bioinformatics datasets. The biomarkers represent values of gene expression and dataset labels for customized processing.
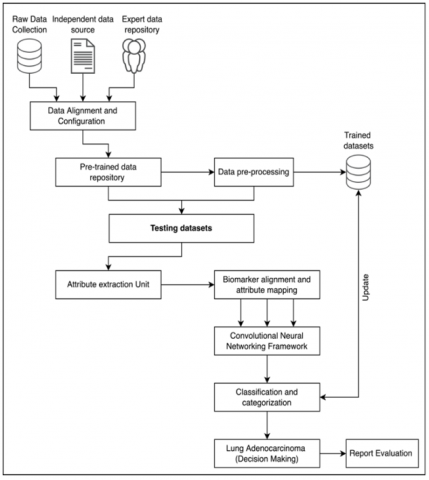
Figure 1. Proposed system architecture
The proposed technique was designed and developed based on multi-source dataset collection and calibration. The purpose is to provide multi-dimensional data collection via multiple participants, such as raw-data repositories, independent data sources, and expert’s data repositories.
These datasets are calibrated and aligned during the data preprocessing session. The preprocessing ensures the pre-trained data repository is cleared and configured with *.csv formats for further processing. The data preprocessing unit assures the data is intact and free from ambiguous elements and objects. The pre-processing data is primarily stored in trained datasets. On the first iteration, the trained dataset is pre-processed data, and on successful iterations, the process is expanded to update the trained datasets in the proposed framework. The testing datasets are then extended to process testing datasets for attribute extractions, as shown in Figure 1.
The attribute extraction and mapping assure that the data attributes from the primary pre-trained data are filtered and processed. The attributes are further mapped to the biomarker labels and parameters. The process of biomarker label attributes is classified and clustered via a dedicated CNN framework. The CNN provides a classification matrix for processing and categorizing based on thresholding parameters of gene-sequential datasets. The lung adenocarcinoma is classified, and decision-making is provided. The decision-making is classified and provided in processing under eHealth record creation and customizations for expert’s consultation.
The lung cancer datasets are processed and trained from the GEO database. The GEO database is a widely used repository for high-throughput gene expression data, including microarray and RNA-Seq data.
Three datasets (GSE118370, GSE85841, and GSE32863), which contain the gene expression data of 144 total samples, including 72 lung adenocarcinoma samples and 72 normal samples, were obtained from the gene expression omnibus (http://www.ncbi.nlm.nih.gov/geo/), and 80% of the datasets were used for training and 20% were used for testing. The GEO accession number refers to a specific dataset deposited in the GEO database. However, without additional information or context about GSE118370, GSE85841, and GSE32863, such as the publication associated with the dataset or any available metadata, the lung cancer datasets are processed and trained from the GEO database. The GEO provides a bioinformatics pattern of digitalized datasets with interfacing labels $\left(l_e\right)$ for highlighted biomarkers of gene expressions. The primary objective of gene representation and mapping is focused on the initial stage of gene alignment and preprocessing.
Consider the incoming dataset variables of $\operatorname{GEO}$ as $\left(D_X\right)$ with multiple sub variants as $\left(D_{X 1}, D_{X 2}, D_{X 3} \ldots\right)$ and $\left(\forall D_{X i} \Rightarrow \sum D_X\right)$. Hence the representation factor of $\left(D_X\right)$ can be synchronized with label parameters $\left(l_e\right)$ as $\left(\exists D_X \in l_e\right)$ with each label value is indexed and customized for attribute extraction. The extracted values of attributes (a) represent $\cdot$ series of pattern functions as shown in Eq. (1).
$P=\frac{\delta}{\delta \beta}\left(\sum\left(D_X\right)^{l_e} \times \Delta a_i\right)$ (1)
where, $(\beta)$ the propagating function is the values of input parameters such that, the $\left(\Delta a_i\right)$ attributes are marked with reference to $(\beta)$ and $\left(D_X\right)$ dataset variants. The variant of pattern $(P)$ is extracted in the early processing phase. The values of ( $\left.P \in \Delta a_i\right)$ and hence the dependency is evaluated as $\left(\forall D_X \Rightarrow \sum l_e\right)$ with processing parameters, the extraction of attributes is achieved and optimized.
According to Eq. (1), the parameters of pattern functions are extracted and evaluated. The resulting paradigm needs to develop an inter-dependent attribute set $\left(I_a\right)$. The $\left(I_a\right)$ operates on functional parameters of biomarker labels $\left(B_l\right)$ with $\left(\forall B_l \in D_X\right)$ and $\left(B_l \subseteq \Delta a_i\right)$. The representation of biomarker labels is inbuilt with pre-trained GEO datasets. These datasets develop a series of ( $\left.B_l\right)$ dependencies as shown. in Eq. (2).
$B_l=\varepsilon\left(\Delta a_i \oplus \frac{\delta\left(B_l\right)}{\delta t}\right)^{e^{-\Delta D_X}}$ (2)
According to Eq. (2), the biomarker labels $\left(B_l\right)$ are represented with $\left(\varepsilon \Delta a_i\right)$ variables and associated with a series of $\left(B_l\right)$ iterations raised on the complement of initial processing datasets $\left(D_X\right)$. This assures the data pattern is independent and extracted as series of $\left(B_l\right)$. The extracted attributes from the biomedical markers $\left(B_l\right)$ are based on computational function $\left(C_F\right)$ with interdependent attribute parameters. The $\left(C_F\right)$ is dependent on secondary $\left(I_a\right)$ parameters as $\left(I_a\right)^{|}$ and represented in Eq.(3).
$C_F=\prod_{i=1}^{\infty}\left(B_l\right)_i \times e^{\left(I_a\right)^{|}}$ (3)
$\therefore C_F=\prod_{i=1}^{\infty}\left(B_l\right)_i \times\left\{e^{\left(I_a \cup D_X\right)_i-\left(I_a\right)^{|}}\right\}$ (4)
$\therefore C_F=\prod_{i=1}^{\infty}\left(B_l\right)_i \times \frac{1}{\left\{e^{\left(I_a \cup D_X\right)_i-\left(I_a\right)^{|}}\right\}} \cup\left[\Delta a_i \oplus e^{\Delta D_X}\right]$ (5)
According to Eq. (4), the representation of extracted attributes is filtered and cross-validated with reference to the initial dataset $\left(D_X\right)$ and fragmented attribute values $\left(I_a\right)$. The process of alignment and representation of computational functions $\left(C_F\right)$ is extracted from Eq. (5). The attribution informatics is cross-validated and structured in $\left(\Delta a_i\right)$ based on attribute parameters. The aligned attributes from $\left(C_F\right)$ are further processed to compute and develop a bio-marking attribute mapping function. Consider a bio-marking attribute label as $(\gamma)$ 'with processing attributes, the fundamental parameters of $\left(D_X\right)$ under computational function $\left(C_F\right)$ is validated as $\left(C_F \subseteq \gamma\right)$ and $\left(\gamma \in B_l\right)$ under coordination operations.
Technically, the functional parameters such as $\left(f_1, f_2, f_3 \ldots.\right)$ are extracted and blended with a supporting $\cdot$ paradigm to frame bio-marking labels via attribute mapping. Consider the label of size $\left(R_X\right)$ is fragmented parameters are also termed features and feature matrix of bio-informatics datasets.
Consider that the computation function $\left(C_F\right)$ is re-calibrated and framed with constant labels, typically fixed to compute or alert the change of gene-sequence $\left(G_S\right)$ as $\left(G_{S 1}, G_{S 2}, G_{S 3} \ldots \ldots ..\right)$. These segmentations are intercorrelated and mapped with static or constant labels as shown in Eq. (6), where $\cdot(\lambda)$ is the gene-static label.
$G_S=\left\{\left(G_{S 1}, \lambda_1\right),\left(G_{S 2}, \lambda_2\right),\left(G_{S 3}, \lambda_3\right) \ldots \ldots \ldots\right\}$ (6)
The series from Eq. (6) can be re-aligned as $\sum\left(G_{s i}, \lambda_i\right)$ for a given segment of gene-code. Typically, the fragmented codes and alignment ratio of $\left[G_S \in C_F\right]$ where $\left[\forall C_F \subseteq D_X\right]$ and $\left[G_S \notin D_X\right]$ in the inter-association spectrum.
The extracted gene matrix $\left(\sum G_{S i} \lambda_i\right)$ is functionally based on rational elements. The process of element is defined under segmented genome attribute coordination mapping and filtering. The process of alignment and filter value coordination is subjected to computational function summarization $\left[\sum C_F\right]$, as shown in Eq. (7).
$\sum C_F=\prod_{i=1}^{\infty}\left(\Delta B_l\right)_i \oplus\left\{\sum_{j=1}^n \sum_{k=j+1}^{n-1} \frac{\delta\left(G_S\right)_j}{\delta t} \oplus \frac{\delta\left(\lambda_k\right)}{\delta t}\right\} e^{-I_a}$ (7)
$\begin{gathered}\therefore \sum C_F= e^{-I_a} \int_0^{\infty}\left(\Delta B_l\right)_i \cup\left\{\sum_{j=1}^n \sum_{k=j+1}^{n-1} \frac{\delta\left(G_S\right)_j}{\delta t} \oplus \frac{\delta\left(\lambda_k\right)}{\delta t}\right\}\end{gathered}$ (8)
Thus, according to Eq. (7), the fragmented values of gene sequence $\left(G_S\right)_j$ are associated with a static gene label $\left(\lambda_k\right)$. The association is termed as $\Delta\left(G_{S i} \lambda_i\right)$ with $(j, k)$ are not an identical sequence iteration term. Typically, the functional attributes of $\left(\lambda_k \in G_{S i}\right)$ are under an ideal scenario of $(k \cong j)$ and vise-versa. Typically, the fragmented attribute set, denoted as setbacks of the $\left(\sum I_a\right)$ attributes, is mapped, and the corresponding sequence is turned as shown in Eq. (8), accordingly.
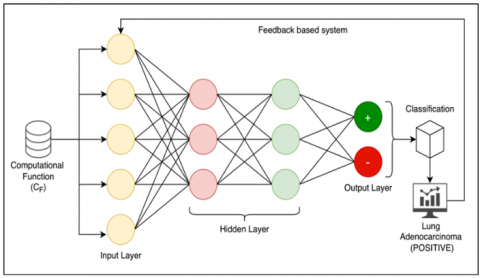
Figure 2. CNN framework of proposed classification model
The CNN-based gene classification includes a summarized computation of gene attribute classification via $\left(\sum C_F\right)$ function. The classification process is demonstrated in Figure 2. Convolutional filters 32 are used by each convolutional layer to extract information from the input, and the filter size is 3 . Non-linearity is added to the model via ReLU (Rectified Linear Unit) activation functions. Feature maps with max pooling size 2 have smaller spatial dimensions. flatten them into a $1 \mathrm{D}$ vector. At the end, fully connected layers carry out the actual categorization. Sigmoid activation is used in the last layer for binary classification. The experiment results show that it is possible to get the highest accurate categorization performance with a learning rate of 0.001 and ata division ratio of $80 \%$ training and $20 \%$ testing According to the computational function $\left(\Sigma C_F\right)$, feedbackbased learning is conducted to eliminate false positive and true negative predictions. The CNN framework reflects the classification of the dataset via positive and negative values at the end of iterations. Technically, the classified datasets are now ready for final decision-making and support.
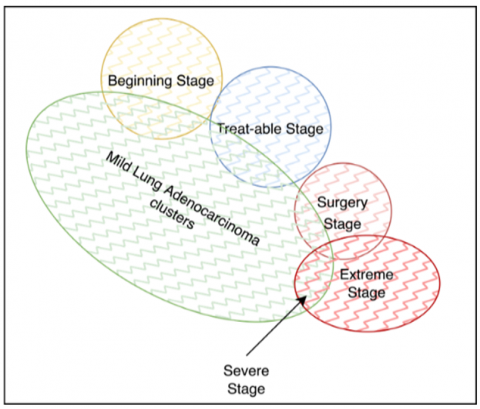
The extracted dataset values for lung adenocarcinoma, positive and negative, are validated. The positive datasets are processed to form clusters based on the disease’s complications. The lung adenocarcinomas are clustered into mild, severe, and extreme clusters, with the primary mild cluster being sub-categorized into the beginning stage, treatable stage, and surgery stage. The cluster representation is shown in Figure 3.
Figure 3. Clustering representation for lung adenocarcinoma classification
The cluster values of each cluster are represented based on thresholding ratio of gene segments and fragments. These segmented clusters are represented as $(\Sigma C)$ and hence the categorization of clusters $\left(C_Z\right)$ is represented as Eq. (9).
$C_Z=\left\{\sum_{i=1}^n \frac{\delta(C)_i}{\delta t} \times \Delta C_F\right\}$ (9)
$\begin{gathered}\therefore C_Z= e^{-\Delta D_X}\left\{\prod_{i=1}^{\infty} \sum_{j=i+1}^n\left(\frac{\delta(C)_i \oplus \delta\left(B_l\right)_j}{\delta\left(G_{S i}, \lambda_j\right)}\right) \cap\left(\Delta C_{F(i, j)}\right)\right\}\end{gathered}$ (10)
According to Eq. (9) and Eq. (10), the classified data indexes the clusters and hence results in oriented constraints according to cluster values $\left(C_i\right)$ and $\left(\sum C_Z\right)$. These functional variables are further correlated and mapped with $\left(G_S, \lambda\right)$ paradigm as shown in Eq. (10). The outcomes of $\left(\sum C_Z\right)$ in Eq. (10) assures the capabilities of classifying and categorizing lung cancer-based adenocarcinomas.
The validation of $\left(\sum C_Z\right)$ is real-time and has secured a higher order of accuracy, precision, F1 score and performance ability. The process of categorizing assures the users (experts) to analyze the current case-study with an existing trained sample set and provide a reliable conclusion on decisionmaking.
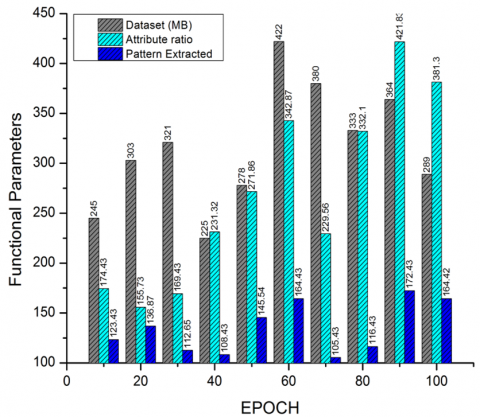
The proposed system is designed and validated for lung adenocarcinoma classification and processing from dual data sources, i.e., the data archives of pre-trained repositories and a genome bio-informatics dataset. The attribution is processed as shown in Figure 4, with reference to the dataset (MB). The relevance of information from gene-bioinformatics is extracted and computed. The computation is processed based on the attribute ratio and the resultant pattern of lung adenocarcinoma via a raw dataset (DX). The pattern extraction ratio projects the intensity of extracting and mapping the adenocarcinoma patterns in bioinformatics files.
Figure 4. Pattern extraction and evaluation from adenocarcinoma datasets
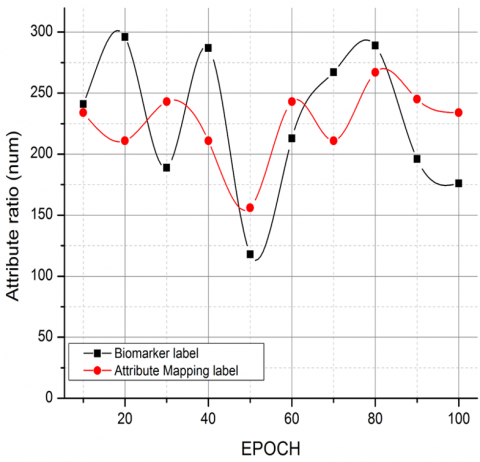
Figure 5. Comparative analysis on biomarker labels v/s attribute mapping label
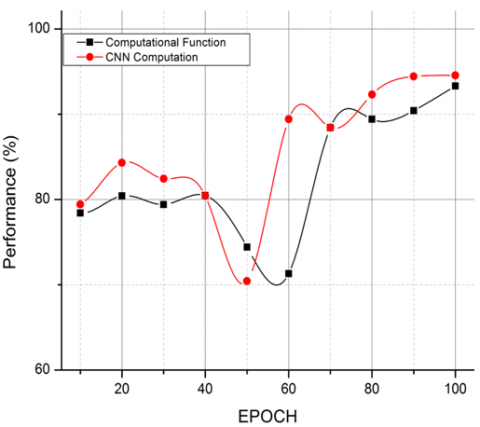
Figure 6. Comparative analysis on CF v/s CNN computations
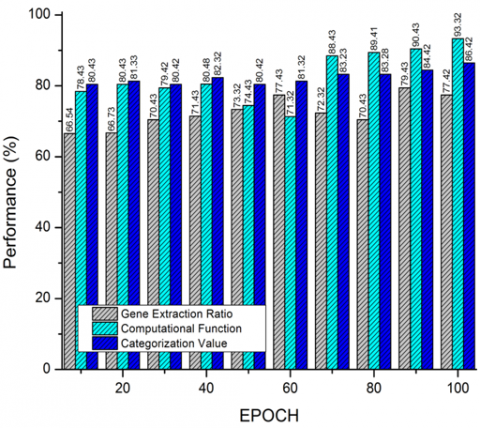
Figure 7. Performance computation of proposed system
The comparative analysis is carried out with respect to biomarkers and attribute mapping labels for feature and pattern mapping. The process of comparison is to demonstrate that the extracted attribute labels are accurate and progressive compared to the bioinformatics labels in genomic representation as per the GSE118370, GSE85841, and GSE32863 dataset standards as shown in Figure 5. The relevance is further expanded and validated in Figure 6, with the CNN framework vs. the computation function $\left(C_F\right)$.
The accordance of the computation function is depen on genomic sequences, whereas the CNN computatio bound with respect to the attribute-labeled datasets $\left(D_X\right)$
Table 2. Tabulation of attribute mapping label extraction from dataset (DX)
|
EPOCH |
Dataset (MB) |
Attribute Ratio |
Pattern Extracted |
Biomarker Label |
Attribute Mapping Label |
|
10 |
245 |
174.43 |
123.43 |
241 |
234 |
|
20 |
303 |
155.73 |
136.87 |
296 |
211 |
|
30 |
321 |
169.43 |
112.65 |
189 |
243 |
|
40 |
225 |
231.32 |
108.43 |
287 |
211 |
|
50 |
278 |
271.86 |
145.54 |
118 |
156 |
|
60 |
422 |
342.87 |
164.43 |
213 |
243 |
|
70 |
380 |
229.56 |
105.43 |
267 |
211 |
|
80 |
333 |
332.1 |
116.43 |
289 |
267 |
|
90 |
364 |
421.83 |
172.43 |
196 |
245 |
|
100 |
289 |
381.3 |
164.42 |
176 |
234 |
Table 3. Performance evaluation of CF, CNN and Categorization value estimation
|
EPOCH |
Computational Function |
CNN Computation |
Gene Extraction Ratio |
Categorization Value |
|
10 |
78.43 |
79.43 |
66.54 |
80.43 |
|
20 |
80.43 |
84.32 |
66.73 |
81.33 |
|
30 |
79.42 |
82.43 |
70.43 |
80.42 |
|
40 |
80.48 |
80.43 |
71.43 |
82.32 |
|
50 |
74.43 |
70.43 |
73.32 |
80.42 |
|
60 |
71.32 |
89.43 |
77.43 |
81.32 |
|
70 |
88.43 |
88.43 |
72.32 |
83.23 |
|
80 |
89.41 |
92.32 |
70.43 |
83.28 |
|
90 |
90.43 |
94.43 |
79.43 |
84.42 |
|
100 |
93.32 |
94.56 |
77.42 |
86.42 |
Table 4. To provide a reliable support for accuracy and performance of the proposed system
|
Reference |
Methodology |
Accuracy |
|
[3] |
artificial neural network |
90.27 |
|
[4] |
Deep neural network [four hidden layers, with the ReLU] |
74.44 |
|
[5] |
artificial neural network and K-Nearest Neighbors (KNN) |
82.8. and 92.6 |
|
[19] |
Random Forest |
90 |
|
[24] |
Machine Learning approaches |
71.0 |
|
[26] |
Grading system |
67 |
|
[30] |
CNNs |
89.24 |
|
[31] |
EMV-3D-CNN |
92.9 |
|
[32] |
multi-view knowledge-based collaborative (MV-KBC) deep model |
91.60% |
|
[33] |
Support vector machine and XGBoost |
79.7 |
|
Proposed Methodology |
CNN |
93.32 |
The comparison process of existing approaches with the proposed technique is defined and observed in Figure 7 and represented in Tables 2 and 3 accordingly. The process of gene extraction ratios from the calibrated system of attribute ratios is computed, and hence the gene representation is comparatively lower in computation function, thus improving the resultant variance of categorization values.
The computational approach is further discussed, as shown in Table 4, to provide reliable support for the accuracy and performance of the proposed system. The proposed CNN model is compared with machine learning approaches and deep learning approaches, and the accuracy of the proposed CNN is 93.32%. Among all the models, the proposed model performed well in terms of accuracy.
The proposed technique has computed and validated the GSE118370, GSE85841, and GSE32863 datasets of lung cancer-based adenocarcinoma classification. Typically, the proposed technique is based on attribute and biomarker mapping-based principles. The biomarker labels have assured the computation of larger bioinformatics data to assign a dynamic labeling pattern. The proposed technique has been re-aligned and mapped based on computational function via the CNN framework. The technique has generated clusters of adenocarcinomas based on classification results and outcomes. The technique further extends the categorization of positive adenocarcinoma-based thresholding functions on severity and decision-making. The proposed technique has outperformed the existing approaches with an accuracy of 93.32%. Some features in the gene expression data might not be useful in classifying cancers that lead to misclassification, and by setting initial hyperparameters, hyperparameters dropped, so tuning hyperparameters got the best accuracy. By facilitating early cancer susceptibility identification and diagnosis among men and women, the developed approach can guide early intervention decisions and ultimately increase survival rates. In the near future, the technique can be developed for dynamic pattern classification and attribute mapping.
[1] Wolf, A.M., Oeffinger, K.C., Shih, T.Y.C., et al. (2024). Screening for lung cancer: 2023 guideline update from the American Cancer Society. CA: A Cancer Journal for Clinicians, 74(1): 50-81. https://doi.org/10.3322/caac.21811
[2] Myers, D.J., Wallen, J.M. (2022). Lung Adenocarcinoma. Stat Pearls Publishing.
[3] Park, S., Shin, B., Sang Shim, W., Choi, Y., Kang, K., Kang, K. (2019). Wx: A neural network-based feature selection algorithm for transcriptomic data. Scientific Reports, 9(1): 10500. https://doi.org/10.1038/s41598-019-47016-8
[4] Lai, Y.H., Chen, W.N., Hsu, T.C., Lin, C., Tsao, Y., Wu, S. (2020). Overall survival prediction of non-small cell lung cancer by integrating microarray and clinical data with deep learning. Scientific Reports, 10(1): 4679. https://doi.org/10.1038/s41598-020-61588-w
[5] Mohammed, M., Mwambi, H., Mboya, I.B., Elbashir, M. K., Omolo, B. (2021). A stacking ensemble deep learning approach to cancer type classification based on TCGA data. Scientific Reports, 11(1): 15626. https://doi.org/10.1038/s41598-021-95128-x
[6] Gupta, S., Gupta, M.K., Shabaz, M., Sharma, A. (2022). Deep learning techniques for cancer classification using microarray gene expression data. Frontiers in Physiology, 13: 952709. https://doi.org/10.3389/fphys.2022.952709
[7] Hutchinson, B.D., Shroff, G.S., Truong, M.T., Ko, J.P. (2019). Spectrum of lung adenocarcinoma. Seminars in Ultrasound, CT and MRI, 40(3): 255-264. https://doi.org/10.1053/j.sult.2018.11.009
[8] Rami-Porta, R., Call, S., Dooms, C., Obiols, C., Sánchez, M., Travis, W.D., Vollmer, I. (2018). Lung cancer staging: A concise update. European Respiratory Journal, 51(5): 1800190. https://doi.org/10.1183/13993003.00190-2018
[9] Ghimessy, A., Radeczky, P., Laszlo, V., et al. (2020). Current therapy of KRAS-mutant lung cancer. Cancer and Metastasis Reviews, 39: 1159-1177. https://doi.org/10.1007/s10555-020-09903-9
[10] Román, M., Baraibar, I., López, I., Nadal, E., Rolfo, C., Vicent, S., Gil-Bazo, I. (2018). KRAS oncogene in non-small cell lung cancer: Clinical perspectives on the treatment of an old target. Molecular cancer, 17: 1-14. https://doi.org/10.1186/s12943-018-0789-x
[11] Parascandola, M., Xiao, L. (2019). Tobacco and the lung cancer epidemic in China. Translational lung cancer research, 8(S): 21-30. https://doi.org/10.21037/tlcr.2019.03.12
[12] Chen, J., Yang, H., Teo, A.S.M., et al. (2020). Genomic landscape of lung adenocarcinoma in East Asians. Nature genetics, 52(2): 177-186. https://doi.org/10.1038/s41588-019-0569-6
[13] Ahmed, S.T., Sandhya, M., Sankar, S. (2019). A dynamic MooM dataset processing under TelMED protocol design for QoS improvisation of telemedicine environment. Journal of Medical Systems, 43(8): 257. https://doi.org/10.1007/s10916-019-1392-4
[14] Shih, D. J., Nayyar, N., Bihun, I., et al. (2020). Genomic characterization of human brain metastases identifies drivers of metastatic lung adenocarcinoma. Nature Genetics, 52(4): 371-377. https://doi.org/10.1038/s41588-020-0592-7
[15] Ahmed, S.T., Patil, K.K. (2016). An investigative study on motifs extracted features on real time big-data signals. In 2016 International Conference on Emerging Technological Trends (ICETT), Kollam, India, pp. 1-4. https://doi.org/10.1109/ICETT.2016.7873721
[16] Zhang, Y., Tseng, J.T.C., Lien, I.C., Li, F., Wu, W., Li, H. (2020). mRNAsi index: Machine learning in mining lung adenocarcinoma stem cell biomarkers. Genes, 11(3): 257. https://doi.org/10.3390/genes11030257
[17] Li, Y., Ge, D., Gu, J., Xu, F., Zhu, Q., Lu, C. (2019). A large cohort study identifying a novel prognosis prediction model for lung adenocarcinoma through machine learning strategies. BMC Cancer, 19: 1-14. https://doi.org/10.1186/s12885-019-6101-7
[18] Kanavati, F., Toyokawa, G., Momosaki, S., Rambeau, M., Kozuma, Y., Shoji, F., Yamazaki, K., Takeo, S., Iizuka, O., Tsuneki, M. (2020). Weakly-supervised learning for lung carcinoma classification using deep learning. Scientific Reports, 10(1): 9297. https://doi.org/10.1038/s41598-020-66333-x
[19] Chen, J.W., Dhahbi, J. (2021). Lung adenocarcinoma and lung squamous cell carcinoma cancer classification, biomarker identification, and gene expression analysis using overlapping feature selection methods. Scientific Reports, 11(1): 13323. https://doi.org/10.1038/s41598-021-92725-8
[20] Zhou, T., Yang, P., Tang, S., et al. (2021). Classification of lung adenocarcinoma based on immune checkpoint and screening of related genes. Journal of Oncology, 2021: 5512325. https://doi.org/10.1155/2021/5512325
[21] Xu, Z., Ren, H., Zhou, W., Liu, Z. (2022). ISANET: Non-small cell lung cancer classification and detection based on CNN and attention mechanism. Biomedical Signal Processing and Control, 77: 103773. https://doi.org/10.1016/j.bspc.2022.103773
[22] Denisenko, T.V., Budkevich, I.N., Zhivotovsky, B. (2018). Cell death-based treatment of lung adenocarcinoma. Cell Death & Disease, 9(2): 117. https://doi.org/10.1038/s41419-017-0063-y
[23] Xu, J.Y., Zhang, C., Wang, X., et al. (2020). Integrative proteomic characterization of human lung adenocarcinoma. Cell, 182(1): 245-261. https://doi.org/10.1016/j.cell.2020.05.043
[24] Sadhwani, A., Chang, H.W., Behrooz, A., Brown, T., Auvigne-Flament, I., Patel, H., Findlater, R., Velez, V., Tan, F., Tekiela, K., Wulczyn, E., Yi, E.S., Mermel, C.H., Hanks, D., Chen, P.C., Kulig, K., Batenchuk, C., Steiner, D.F., Cimermancic, P. (2021). Comparative analysis of machine learning approaches to classify tumor mutation burden in lung adenocarcinoma using histopathology images. Scientific Reports, 11(1): 16605. https://doi.org/10.1038/s41598-021-95747-4
[25] Periasamy, K., Periasamy, S., Velayutham, S., Zhang, Z., Ahmed, S.T., Jayapalan, A. (2022). A proactive model to predict osteoporosis: An artificial immune system approach. Expert Systems, 39(4): e12708. https://doi.org/10.1111/exsy.12708
[26] Moreira, A.L., Ocampo, P.S., Xia, Y., et al. (2020). A grading system for invasive pulmonary adenocarcinoma: a proposal from the International Association for the Study of Lung Cancer Pathology Committee. Journal of Thoracic Oncology, 15(10): 1599-1610. https://doi.org/10.1016/j.jtho.2020.06.001
[27] Hong, J.H., Park, S., Kim, H., Goo, J.M., Park, I.K., Kang, C.H., Kim, Y.T., Yoon, S.H. (2021). Volume and mass doubling time of lung adenocarcinoma according to WHO histologic classification. Korean Journal of Radiology, 22(3): 464-475. https://doi.org/10.3348/kjr.2020.0592
[28] Tsao, M. (2021). PL01. 05 The new WHO classification of lung tumors. Journal of Thoracic Oncology, 16(S3): 63-67. https://doi.org/10.1016/j.jtho.2021.01.005
[29] Yoshida, C., Yokomise, H., Ibuki, E., Go, T., Haba, R., Kadota, K. (2022). High-grade tumor classified by new system is a prognostic predictor in resected lung adenocarcinoma. General Thoracic and Cardiovascular Surgery, 70(5): 455-462. https://doi.org/10.1007/s11748-021-01758-3
[30] Gertych, A., Swiderska-Chadaj, Z., Ma, Z., Ing, N., Markiewicz, T., Cierniak, S., Salemi, H., Guzman, S., Walts, A.E., Knudsen, B.S. (2019). Convolutional neural networks can accurately distinguish four histologic growth patterns of lung adenocarcinoma in digital slides. Scientific Reports, 9(1): 1483. https://doi.org/10.1038/s41598-018-37638-9
[31] Zhou, J., Hu, B., Feng, W., Zhang, Z., Fu, X.T., Shao, H.D., Wang, H.S., Jin, L.Y., Ai, S.Y., Ji, Y. (2023). An ensemble deep learning model for risk stratification of invasive lung adenocarcinoma using thin-slice CT. NPJ Digital Medicine, 6(1): 119. https://doi.org/10.1038/s41746-023-00866-z
[32] Xie, Y., Xia, Y., Zhang, J., Song, Y., Feng, D., Fulham, M., Cai, W. (2018). Knowledge-based collaborative deep learning for benign-malignant lung nodule classification on chest CT. IEEE Transactions on Medical Imaging, 38(4): 991-1004. https://doi.org/10.1109/TMI.2018.2876510
[33] Nishio, M., Nishizawa, M., Sugiyama, O., Kojima, R., Yakami, M., Kuroda, T., Togashi, K. (2018). Computer-aided diagnosis of lung nodule using gradient tree boosting and Bayesian optimization. PloS One, 13(4): e0195875. https://doi.org/10.1371/journal.pone.0195875