Tao Hu![]() | Qianwen Fu*
| Qianwen Fu*![]() | Lei Chen
| Lei Chen![]() | Mengdi Shi
| Mengdi Shi![]()
© 2024 The authors. This article is published by IIETA and is licensed under the CC BY 4.0 license (http://creativecommons.org/licenses/by/4.0/).
OPEN ACCESS
In Building Information Modeling (BIM) system platforms, ensuring the fulfillment of users' functional and emotional needs alongside the achievement of design objectives remains paramount. Through multidimensional analysis employing methodologies such as questionnaire surveys and interviews within specific contexts, user requirements were identified. The utilization of the KANO model facilitated the categorization of these requirements, while Quality Function Deployment (QFD) was instrumental in translating them into concrete design elements. This process illuminated two pivotal factors in strategizing BIM system design: interface layout and color selection. The employment of the Sparrow Search Algorithm (SSA) enabled the identification of optimal layout configurations, and an enhanced Growing Neural Gas (GNG) clustering algorithm was applied to distill feature colors from source images of existing platforms. This led to the establishment of a color library tailored for interface design within BIM systems. Furthermore, a collection of sensory imagery vocabulary was amassed, and semantic differential analysis was applied to align color perceptions with specific vocabularies. Grey clustering analysis further facilitated the prediction of color schemes. By integrating these methodologies, a case study on a BIM system platform was conducted, leading to an interface design that demonstrably improved user interaction when compared to the original platform. This was evidenced by enhanced efficiency and a reduction in cognitive load, thereby affirming the effectiveness of the optimization strategies explored. The methods delineated herein offer valuable insights for the development of BIM system platforms, underscoring the significance of user experience (UX) considerations in the design process.
user experience (UX), Building Information Modeling (BIM), contextual design, design optimization
The emergence of BIM technology in recent years, driven by the convergence of economic and technological advancements, has significantly influenced the trajectory of digitization, intelligence infusion, and informatization within the context of the construction industry. Specifically, the inception of lightweight BIM technology has assumed a pivotal role in steering the exploration of intelligent collaborative management platforms tailored to the intricacies of railway construction [1-3]. The field of railway engineering is moving toward smarter, more information-based, and digitization methods. However, the current state of railway project development systems is hampered by many problems caused by limited time and technology. These problems have shown up as less-than-ideal collaborative operational efficacy, frequent breaks in information flow from beginning to end, lax management coordination mechanisms, and poor UX. Consequently, the existing state of railway construction platforms falls short of accommodating the profound user requisites that transcend surface-level demands [4, 5]. Present-day railway project management frameworks, predominantly oriented towards functional edifices, regrettably relegate the nuanced experiential aspects inherent to user-system interactions.
BIM technology use has been strongly encouraged by national policies and the Chinese construction industry. As a result, many researchers and practitioners have started to look into and use BIM technology's engineering platform throughout the whole project lifecycle. The demand for services from the BIM system platform has also been changing over time. It used to just be used for basic engineering management, but now there is more of an emphasis on good UX [6, 7]. Incorporating design into the realm of engineering construction services, whether in the form of products or services, can propel the development of engineering projects towards the establishment of a well-attuned and more refined service system [8, 9].
Presently, in the context of BIM platform design processes, research dedicated to the optimization of system platform UX remains relatively limited, lacking the establishment of comprehensive methodologies. Consequently, this study integrates the theoretical framework of contextual design into the preliminary phase of user research. By dissecting the pivotal influencing factors governing interactions between users and the BIM system platform, authentic user needs are unearthed. Consequently, useful design strategies are found, which make it easier for users to have better interactions within the BIM system platform by improving system architecture and user-machine interfaces. Ultimately, the feasibility of this research is substantiated through the construction of the BIM system platform, followed by a thorough assessment of feasibility and UX.
2.1 Analysis of experience design based on BIM contextual system
UX encapsulates an array of subjective perceptions established by users during their engagement with products [10-12]. Scholars have introduced the concept of contextual UX design in human-computer systems, which systematically elucidates elements of UX [13]. Emotional fluctuations within the human-computer context vary inherently; products signify the sensory and operational responses induced in users through product interaction, while environment pertains to the authentic setting, including virtual realms, within which users engage with products—encompassing societal, cultural, and natural dimensions. The fundamental attributes of UX chiefly manifest through the orchestrated relationship between the "human-product-environment" triad constituting the human-computer system.
Context is intrinsically linked with UX, as a context-based UX design encompasses a multitude of factors inherent in the interaction between users, products, and the environment [14]. Current research on UX predominantly emphasizes the inherent usability of products, yet UX itself is marked by subjectivity, ambiguity, and complexity. Focusing solely on product usability can inadvertently disregard the impact of users and their environment on the UX [15-17]. Hence, this study incorporates context into the design process based on UX elements, leveraging the mechanisms of context and UX.
As BIM technology evolves, its visual attributes find authentic application within the entirety of project management and construction processes. By amalgamating the distinctive features of BIM systems, pivotal contextual factors governing user interaction within the system platform can be extrapolated. Adopting a multifaceted contextual approach, this study delves into user requirements, conscientiously considering the interplay of human-machine-environment elements. The comprehensive spectrum of UX across diverse contexts is analyzed, facilitated by multidimensional investigative analyses. This approach effectively mines and assesses UX within the construction of the BIM system platform, rendering it more user-friendly and ultimately enhancing the overall UX.
Due to the user-centric nature of the UX, accurate evaluation is elusive. Hence, designers must engage in in-depth observation of the target audience during the research process. They should iteratively optimize through simulated user behaviors and anticipated subjective experiences. Context theory can be used to dig deeper into UX by revealing user pain points and needs in specific usage scenarios. This leads to a more accurate identification of target requirements.
2.2 Methods for uncovering user requirements
(1) KANO Model
The KANO model represents a pioneering technique that identifies user needs and expectations through preference classification technology [18, 19]. The KANO model discerns user needs and transcends their expectations [20, 21]. Shahin and Nourmohammadi [22] categorized three types of requirements that impact user satisfaction in distinct ways: 1. Basic Needs: These are qualities that users expect as a fundamental standard. Failing to meet these basic requirements would result in dissatisfaction. 2. Expected Needs: Once basic quality is met, users experience satisfaction. However, further quality enhancements beyond the basics can lead to even greater satisfaction, while their absence might cause dissatisfaction. 3. Excitement Needs: These needs exceed user expectations. Not meeting these needs would also lead to dissatisfaction.
(2) QFD Model
QFD serves as a potent tool in the product development process, acting as a bridge between user requirements and design elements. It transforms user needs into engineering design qualities aimed at satisfying user satisfaction [23-26]. It also stands as a crucial tool for enhancing time efficiency and resource conservation across all production phases, from design to production planning [27]. Liao and Wang [28] further stipulate that QFD prioritizes design requirements based on their significance, aiding in evaluating the impact of design requirement attributes on satisfying user expectations. QFD serves as an optimization approach requiring resource utilization and development.
Both of these methods—the KANO model and the QFD model—are very helpful for finding and ranking user needs. This makes it easier for design processes to match up with what users want, which improves the overall BIM system platform experience for users.
2.3 Visual interface optimization design
Optimizing interface layout is inherently a multi-objective optimization problem. Heuristic algorithms such as genetic algorithms, particle swarm algorithms, and ant colony algorithms have found application in numerous layout optimization studies [29-31]. However, these algorithms have their own strengths and weaknesses. Genetic algorithms can attain global optimal solutions but exhibit slower convergence speeds, weaker local search capabilities, and involve multiple control variables [32]. Swarm intelligence optimization algorithms, known for their operational ease and robustness, are widely used. Examples include particle swarm algorithms and ant colony algorithms. Particle Swarm Algorithms exhibit a strong dependence on parameter settings and can easily get trapped in local optima. Ant colony algorithms entail substantial computational overhead, slow convergence rates, and vulnerability to local optima. Worth exploring is the SSA [33, 34], inspired by sparrow foraging and anti-predation behavior. Liu and G. introduced the SSA [35], characterized by its simplicity, minimal control parameters, fast convergence, good stability, and robust global and local search capabilities. It demonstrates satisfactory performance in optimization problems, enhancing exploration and utilization of optimization search spaces.
Meng et al. [36] used standard benchmark test functions to look at six common swarm intelligence optimization algorithms and found that SSA completely beats the others. Therefore, this study employs the SSA to solve the established optimization objective function. By doing this, the strengths of SSA can be used to get quick and good solutions while also improving the visual interface within the BIM system platform.
To create emotionally responsive work environments through color scheme design and mitigate the psychological stress and negative emotions associated with prolonged work, it is imperative to cultivate work environments that cater to emotional needs [37, 38]. Traditional color expressions have often relied on designers' subjective experiences. However, with the advent of user-centric design philosophies, emphasis has shifted towards UX. Design now aims to accommodate individualized preferences, acknowledging that various combinations of colors can elicit distinct psychological and emotional responses.
In order to predict interface color schemes that align with intended imagery, the fusion of sensory engineering and human-centric design assists designers in crafting color designs that resonate with user requirements, thereby harmonizing the human-machine interface. Capturing color preferences within specific user groups and leveraging the regulatory function of color expression can alleviate visual fatigue, foster emotional interactions, and optimize the UX.
Efficient color utilization not only assists in accurately guiding user behavior judgments, thereby enhancing work efficiency, but also reduces cognitive load during user cognition processes, heightening the overall UX. Color adjustment, relative to other design components, incurs lower costs and yields rapid results. Thus, this study initiates personalized color scheme recommendations rooted in user cognitive psychology, underscoring the importance of individualized color choices in enhancing UX within the BIM system platform.
3.1 BIM task scenario analysis
3.1.1 Division of BIM system contextual factors
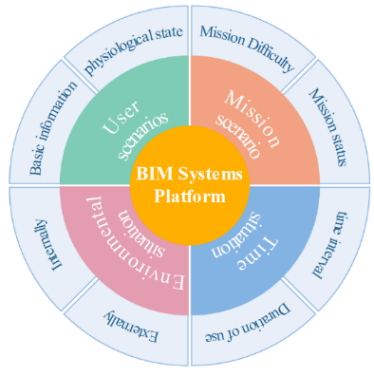
The division of contexts is primarily determined by the user's state and nature of engagement. This study, grounded in contextual theory, delves into the user-BIM platform interaction from the standpoint of UX. Consequently, the comprehensive contextual influencing factors encountered during user interaction with the system platform are categorized into four contextual factors: user, time, environment, and task. This division serves as the analytical framework for investigating UX issues in the context of the BIM system platform. The specific contextual classifications and division of contextual factors are illustrated in Figure 1.
Contextualized experience design strategies necessitate a departure from user contexts, involving the comprehensive analysis of internal factors such as emotions, cognitive levels, and motivations while also considering the multifaceted factors within the human-computer interaction process. By judiciously harnessing positive elements, users can more seamlessly, joyfully, and efficiently complete tasks. Users' perceptions of cognition, behavior, and emotional attitudes manifest diverse emotional changes throughout the same interaction process. Perceiving users' psychological attributes through external contexts is pivotal.
Figure 1. Contextual framework of BIM systems
Task scenario analysis encompasses the task a user is currently engaged in, along with associated behavioral activities and events, constituting a vital aspect of contextual analysis. Task scenarios encompass factors like task complexity, flow, the context during task execution, task objectives, and time duration for task completion. Only by meticulously considering all facets, from task initiation to culmination, can system architecture be optimized, enhancing user efficiency.
Environmental context within the BIM system platform primarily pertains to the equipment environment. In comparison, regarding environmental factors, the BIM system encompasses the physical environment in which users exist, including temporal and spatial components. This also incorporates various scenes within the system, ranging from virtual scenarios within railway construction processes to human-machine interaction interfaces within different subsystems.
Time context analysis, guided by cognitive load theory, correlates cognitive load with the time users employ. User behavior analysis, using time duration as a metric, reveals insights into user behavior. The duration of time partly indicates user efficiency during task execution and their emotional shifts. Information overload from data can heighten cognitive load, leading to a dip in user emotions.
Effectively integrating user, task, environmental, and time contextual factors can facilitate the development of a BIM system platform with enhanced UX, nurturing harmonious human-computer interactions, and bolstering user satisfaction.
3.1.2 Purpose and methodology of contextual research
Conducting contextual research analysis constitutes a pivotal facet within the user-centric design process. Contextual research, entailing the analysis of diverse situational variances, subjective experiential perceptions, and interactional behaviors of users, serves as a means of unearthing authentic user requisites. This information, subsequently, serves as the foundational basis for design, facilitating the provision of personalized services to users. In this paper, contextual theory is introduced into the realm of BIM system platform design, enabling the examination of the relationship between various situational factors and user demands. Furthermore, this approach allows for the synthesis of behavioral characteristics observed during the interaction between users and the BIM system platform. The research objectives are delineated as follows:
1. To elucidate the fundamental requirements of users utilizing the BIM platform.
2. To comprehend the issues encountered by users when employing existing platforms, thereby aggregating pain points.
3. To discern whether opportunities for optimization exist through an analysis of user interactions with the utilized BIM platform.
This paper primarily unfolds along three dimensions: questionnaire surveys, user interviews, and behavioral observation methods, as outlined in Table 1, encapsulating the particulars of the research.
(1) Questionnaire Survey
A questionnaire survey serves as a preparatory exercise for in-depth interviews with target users. It aids in gaining an initial understanding of user expectations when using the platform, marking the preliminary stage of research focused on comprehensive analysis and discovery of user requirements pertinent to the BIM platform. The survey designed in this paper predominantly employs online questionnaire distribution as the primary mode of data collection. The distributed survey pertains to aspects of UX related to platform design. From a quantitative perspective, it gathers data on user demographics, motivations for using the BIM platform, usage patterns, and learning behaviors. This preliminary survey aids in ascertaining the fundamental usage requirements of users regarding the BIM platform. Subsequently, the data from the survey is organized and analyzed to provide empirical support for user interviews and subsequent design directions.
(2) In-Depth User Interviews
In-depth user interviews refer to a communicative exchange between an interviewer and interviewee. Throughout this interaction, the interviewer judiciously manages and schedules the conversation, posing questions to elicit the interviewee's thoughts on the subject matter. The objective of these interviews is to obtain answers to specific questions. In this paper, the interviews primarily take the form of one-on-one, face-to-face interactions, ensuring that respondents can provide in-depth responses to questions. The interview questions follow a semi-structured format, allowing for spontaneous inquiries within the scope of the prepared questions. The interviews are conducted with typical users and, building upon the findings of the questionnaire survey, delve deeper into users' platform-specific needs. They aim to unearth more profound pain points, elucidate user expectations, and uncover latent demand points. Information about the interviewees and an overview of the research are presented in Tables 2 and 3, respectively.
The in-depth user interview profiles detail each respondent's experience with the existing BIM system platform, the problems they encountered, and their expectations for using the BIM system platform.
Table 1. Scenario research and analysis
|
Situational Analysis |
Method of Analysis |
Analyzed Content |
|
Subscriber |
Questionnaire, user interview |
Behaviour and user needs |
|
Mission |
Observation of Behaviour |
Difficulty of the task, problems during interaction |
|
Environment |
Case study, situational observation |
Views and problems with the visualization system, including the overall interface, use of colours |
|
Time |
Questionnaire, user interview |
What would be good advice for a long period of time |
Table 2. Respondent information of BIM management platform
|
Serial Number |
Subscriber |
Gender |
Age |
Occupation |
Utilization Frequency |
Experience of Use |
|
1 |
Mr Zhao |
male |
56 |
engineer |
middle |
general |
|
2 |
Mr Wang |
male |
33 |
technician |
seldom |
favourable |
|
3 |
Miss Chen |
female |
24 |
human resources |
many |
favourable |
|
4 |
Ms Lee |
female |
32 |
accountant |
many |
general |
|
5 |
Mr Zhang Mr Chen |
male |
47 |
project manager |
many |
favourable |
|
6 |
Ms Yu |
female |
29 |
budgeter |
many |
favourable |
Table 3. Overview of some interviewer research
|
Serial Number |
Participant in a Survey |
Experience |
|
1 |
Mr Wang |
The use of the existing platform is relatively general; it can complete the basic operational tasks. The basic platform modules are also available, but the completion of the functional tasks of the process is longer and the operation is more cumbersome. I hope to simplify the process and enhance the relevance of the relevant linkage function part. |
|
2 |
Ms Lee |
The sense of use is poor, the digital information in the system is too large, looking at the results of a message may take a long time, and the color scheme does not have a modern sense. I hope to be able to reduce the size of the amount of digital information so it is easier to catch the task objectives. |
|
3 |
Ms Zhou |
General sense of use, can meet the basic task operation, I hope to highlight the function area. |
(3) User Behavior Analysis
User behavior analysis is instrumental in reconstructing the authentic process of user-product interaction. Only with a comprehensive understanding of user behavior patterns and operational processes can issues within the user's operational journey be identified. By observing users' interactions within the management platform, a detailed analysis of issues encountered during the user's operational process can be conducted. This analysis is crucial for gaining insights into the practical challenges users face while utilizing the platform.
3.1.3 Contextual research analysis
Traditional UX often relies on singular evaluations, seldom considering multidimensional research for assessing UX. Through conversations with users of the BIM system platform, it has been observed that the UX can vary significantly based on different contexts, even within the same platform. Following a comprehensive investigation of the target users of the BIM platform, this research integrates questionnaire surveys, user interview content, and behavioral observations into contextually relevant categories. Information is then synthesized and analyzed to unearth the demands of BIM platform users during their usage.
(1) User Contextual Analysis
Based on contextual research, the acquired user contextual information is summarized and categorized, elucidating the issues that users encounter during their usage. Drawing from Maslow's Hierarchy of Needs theory, an organization and summarization of target users' needs are conducted, classifying them into five categories: cognitive capabilities, error avoidance, emotional connection, recognition and affirmation, and self-worth, as outlined in Table 4.
Table 4. Target user requirements analysis
|
Core Requirement |
Existing Problems |
Specific Needs and Points of Opportunity |
|
Cognitive Ability |
Interactive interface information is confusing |
Sorting out interface elements |
|
|
The interface contains a lot of numerical information |
Visual representation of information, graphical representation |
|
|
Colours of the interface are not easily distinguishable |
Adjustment of colour differentiation |
|
|
Incomplete grasp of the system's operating procedures |
Simplified operation |
|
Avoiding Mistakes |
Confusing information can easily lead to clicking errors |
Add distinction |
|
|
Unfamiliarity with shortcut keys when using visualization platforms |
Setting up shortcuts that are consistent with or similar to established software |
|
|
The longer the task takes to complete, the more loaded it is and the more likely it is to cause clicking errors |
Strategies for regulating cognitive load |
|
|
Functional modules of the subsystems are not clearly differentiated Lack of systematic guidelines |
Enhanced differentiation |
|
Emotional Link |
Negative psychology towards the system There will be emotional manifestations of task completion Mood changes due to environmental factors Less interaction with people in the platform and lack of security |
Combing system Simplify task flow and enhance ease of useSetting up a favourable environment Enhance the correlation between functions and modules |
|
Respectful Affirmation |
Lack of systematic feedback Lack of fluidity in the handover of work |
Adding fit-for-purpose dynamic feedback Sorting out task processes to enhance collaborative management |
|
Self-Esteem |
Unknown Not sure enough of their ability to do the job |
Increase mutual evaluation between links |
Table 5. Scenario requirements summary table
|
Situation Type |
Type of Requirement |
Requirements |
|
User Scenario |
Increase user awareness |
Optimize the layout of interface elements visual characterization |
|
|
|
Colour imagery design |
|
|
|
Simplified operational processes |
|
|
Avoiding mistakes |
Interface highlights functional personalized display Increase distinction visibility Setting mature shortcuts Regulating cognitive load |
|
|
Emotional link |
Increase communication between sessions Strengthening linkages |
|
|
Affirmation of respect |
Enhancing the collaborative nature of engineering links |
|
|
|
Addition of a feedback mechanism for mandates |
|
|
Self-esteem |
Add personalization |
|
Mission Scenario |
Mission Difficulty |
Strengthening guidance and direction |
|
|
|
Simplified operational processes |
|
|
|
Increase basic operation learning |
|
|
Complexity theory |
Strengthening the correlation between functions |
|
Time Scenario |
Duration of time |
Streamline user processes Reducing the difficulty of information |
|
|
Time dimension |
Different stages, different analyses |
|
Environments Scenario |
External environment |
Quiet environment |
|
|
Internal context |
Visualization system building |
|
|
Differences in equipment |
Designs with different emphases information privilege |
(2) Task Contextual Analysis
Building upon the insights gained from user interviews and behavioral observations, user task information is classified and summarized. The primary task activities of users are found to differ based on various stakeholders and professions, resulting in different task processes. Depending on user types, different contextual interaction processes emerge.
(3) Temporal Contextual Analysis
Temporal contextual analysis is twofold. Firstly, it involves an examination of the duration of platform usage. Longer usage periods lead to increased cognitive load and reduced efficiency for users. Thus, interface adjustments are necessary to modulate the cognitive load for users effectively. Secondly, it considers how user behaviors vary across different time dimensions. Early on, users require an understanding of basic platform operations and procedures. During usage, streamlining operational processes enhances user engagement. Following task completion, reinforcing system interaction feedback provides users with emotional resonance.
(4) Environmental Contextual Analysis
Research conducted during the early stages pertaining to the BIM system platform and device characteristics is categorized and summarized. It is noted that environmental context can significantly impact user emotions. A quiet and conducive environment tends to enhance user efficiency. In an internal context, where users engage in virtual interactions with the system, immersion is crucial. Enhancing the UX in a digital construction environment can involve both visual and auditory design considerations. Differentiating between PC and mobile platforms is essential; PC platforms emphasize task completion, while mobile platforms focus on user engagement.
3.1.4 Summary of user requirements for the BIM system platform
Building upon the contextual research conducted for the BIM system platform, a comprehensive understanding of user requirements within the context of BIM system usage has been derived. This understanding is based on contextual analyses encompassing users, tasks, time, and environment. The resulting user requirement model, as obtained from these analyses, serves as a foundational framework for subsequent design strategies. A detailed summary of these requirements is presented in Table 5.
3.2 Obtaining BIM system user requirements based on KANO-QFD
Building upon the user requirements summarized earlier using the contextual theory, design strategies are proposed based on contextual factors: users, tasks, environment, and time. A KANO-QFD model is employed to categorize and prioritize user requirements and transform them into design elements, thereby deriving relevant design strategies.
3.2.1 Requirement acquisition process
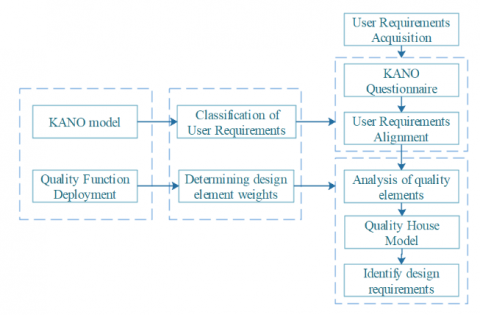
By combining the KANO model with QFD, the model's functionality can be effectively enhanced and refined, thereby improving its reliability. The application of the KANO-QFD model not only enables the precise analysis of user requirements but also helps in determining the correct service direction. This guides product design to align with user requirements, ensuring user satisfaction. In this paper, improvements to the BIM-based system platform are approached from the perspective of contextual analysis and user requirements. The process is illustrated in Figure 2.
Figure 2. User Requirements analysis flowchart
3.2.2 Clustering user requirement attributes based on the KANO model
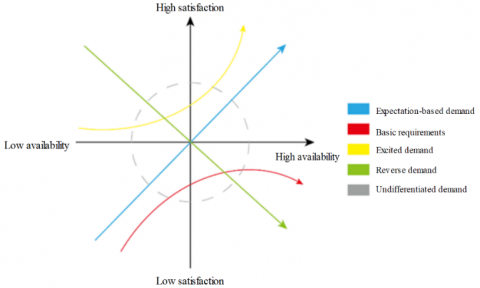
In user requirement analysis, the KANO model is a crucial method for categorizing and prioritizing user requirements. Grounded in the analysis of the impact on user satisfaction, Professor Kano has classified product quality attributes into five categories: Must-be Quality (M), One-dimensional Quality (O), Attractive Quality (A), Indifferent Quality (I), and Reverse Quality (R). This classification is based on the relationship between different types of quality characteristics and user satisfaction evaluations, as depicted in Figure 3.
Figure 3. KANO model
Combining the design requirements summarized in the previous section with user feedback, demand keywords were identified and selected. A KANO survey questionnaire was designed, and user evaluations were recorded for each requirement. Data were collected and analyzed, primarily through online KANO questionnaire surveys, resulting in a total of 96 valid responses. Statistical analysis was performed using SPSS, yielding a reliability coefficient of 0.827 for this research questionnaire. The analysis of demand evaluations is presented in Table 6.
3.2.3 Design objectives based on the QFD model
Utilizing the user requirements, functionalities are categorized based on the contextual factors of users, tasks, time, and environment. Specifically, 6 user requirements have been selected for further analysis, as presented in Table 7. These requirements are categorized within the dimensions of user context, task context, time context, and environmental context.
CS represents customer satisfaction, while CD represents customer dissatisfaction. Calculating CS and CD values helps reflect the average impact of each quality attribute on customer satisfaction. The results are presented in Table 8.
A relationship matrix between user requirements and design elements, indicating strong correlations, weak correlations, or no correlations, was generated based on user requirements. The QFD methodology was employed to calculate and construct the Quality House, as shown in Table 9. This matrix serves as a valuable tool for mapping the relationships between user needs and design features, facilitating the prioritization of design efforts.
Based on the output results from the Quality House, the prioritization of design requirements has been established. Combining these prioritized design requirements with the existing ones, the following design objectives have been determined: 1. Optimize Interface Layout Design; 2. Develop Color Scheme Design; 3. Refine Operational Workflow Design.
These objectives will guide the design efforts to ensure that user needs and expectations are met effectively.
Table 6. Statistical analysis of KANO questionnaire results
|
Situation Type |
Demand Point |
Demand KANO Attribute Ratio |
Categorization of Requirements |
||||
|
A |
O |
M |
I |
R |
|||
|
User Scenario |
Layout of interface elements |
65.4% |
19.7% |
11.1% |
3.8% |
0% |
A |
|
|
Colour scheme design |
60.48% |
15.81% |
20.41% |
3.57% |
0% |
A |
|
|
Visual characterization |
54.2% |
31.2% |
4.88% |
9.72% |
0% |
A |
|
|
Strengthening the collaborative nature of the link |
18.9% |
23.8% |
14.26% |
40.85% |
2.19% |
I |
|
|
Add interactive feedback |
13.43% |
29.4% |
46.9% |
10.27% |
0% |
M |
|
|
Add personalization |
37.74% |
21.7% |
5.88% |
37.98% |
15.7% |
I |
|
Mission Scenario |
Increased differentiation |
34.9% |
12.4% |
48.2% |
15.7% |
0% |
M |
|
|
Strengthening guidance and direction |
17.8% |
41.9% |
5.9% |
34.4% |
0% |
O |
|
|
Simplified operational processes |
38.9% |
24.7% |
20.2% |
9.7% |
6.5% |
A |
|
|
Setting similar shortcuts |
22.08% |
63.1% |
10.4% |
3.2% |
1.32% |
O |
|
|
Increased systematic learning |
3.85% |
18.65% |
20.5% |
46.3% |
10.7% |
I |
|
Time Scenario |
Regulating cognitive load |
52.8% |
19.86% |
20.6% |
16.8% |
0% |
A |
|
Environments Scenario |
Information privilege |
42.38% |
30.5% |
14.32% |
12.8% |
0% |
A |
|
|
Quiet environment |
10.3% |
8.9% |
20.7% |
56.9% |
3.2% |
I |
Table 7. Design elements and design requirements table
|
Serial Number |
Level 1 Design Elements |
Serial Number |
Secondary Design Elements |
Serial Number |
Design Requirements |
|
1 |
User Scenario |
C1 |
Interface layout optimization Optimization of colour schemes Visual characterization Strengthening the collaborative nature of the link Add personalization Add interactive feedback Increased differentiation |
C11 C12 C13 C14 C15 C16 C17 |
Layout conforms to visual perception Colour schemes to aid cognition Graphical representation of data Strengthening linkages Add custom settings Increase feedback response Enhancement showcase |
|
2 |
Mission Scenario |
C2 |
Simplified operational processes Setting similar shortcuts Strengthening guidance and direction |
C18 C19 C20 |
Enhanced process design Shortcut Key Setting steer |
|
3 |
Time Scenario |
C3 |
Regulating cognitive load Increased systematic learning |
C21 C22 |
Adjustment of the load Learn to operate the system |
|
4 |
Environments Scenario |
C4 |
Information privilege quiet environment |
C23 C24 |
Setting up permissions Quiet external environment |
Table 8. The relationship between quality of experience and the impact of user satisfaction
|
Level 1 Design Elements |
Secondary Design Elements |
Requirements Categorization |
CS |
CD |
|
User |
Interface layout |
A |
0.65 |
0.19 |
|
|
Colour scheme |
A |
0.62 |
0.24 |
|
|
Visual characterization |
A |
0.58 |
0.23 |
|
Task |
Setting similar shortcuts |
O |
0.43 |
0.45 |
|
Environment |
Quiet environment |
I |
0.47 |
0.24 |
|
Time |
Add interactive feedback |
M |
0.43 |
0.48 |
Table 9. Relationship matrix of need elements and functional requirements
|
Elements of Demand |
Functional Requirement |
||||||||||||
|
C1 |
C2 |
C3 |
C4 |
C5 |
C6 |
||||||||
|
User needs |
Significance |
C01 |
C02 |
C11 |
C12 |
C21 |
C22 |
C31 |
C32 |
C41 |
C42 |
C51 |
C52 |
|
U1 |
20.36 |
◇ |
△ ◇ |
□ |
|
◇ |
△ |
||||||
|
U2 |
17.28 |
△ □ |
△ |
◇ □ |
△ □ |
△ |
△ □ |
||||||
|
U3 |
14.44 |
△ |
◇ |
□ |
△ |
□ |
|
||||||
|
U4 |
12.36 |
◇ |
△ |
△ |
◇ |
△ |
◇ |
||||||
|
U5 |
10.50 |
□ |
|
□ △ |
◇ |
|
□ |
||||||
|
U6 |
9.80 |
|
◇ |
◇ |
□ |
△ |
◇ |
||||||
|
Weights Hj |
|
|
|
|
|
|
|||||||
|
Arrange in order |
10 6 |
3 1 |
9 8 |
5 12 |
7 2 |
11 4 |
|||||||
Note: ◇ indicates strong correlation, □ indicates medium correlation, and △ indicates weak correlation.
3.3 BIM system interface layout optimization based on user requirements
Step 1: Establish interface layout design principles. These principles should be user-centric, incorporating principles from cognitive load, ergonomics, and aesthetics. These principles are summarized and transformed into objective functions.
Step 2: Build the interface layout optimization model and employ the SSA to optimize the objective functions.
Step 3: Evaluate the usability of the proposed layout. Introduce eye-tracking measurements for usability assessment.
Table 10. Coding of the 12 layout elements and their importance and frequency of use
|
Elemental |
Designation |
Digital Factory |
Materials Management |
Quality Control |
Valuate |
Completion Information |
Change Design |
Credit rating |
Funds Management |
Contract Management |
Process |
Time Display |
|
Coding frequency |
d1 0 |
d2 0.8 |
d3 0.7 |
d4 0.7 |
d5 0.7 |
d6 0.7 |
d7 0.7 |
d8 0.7 |
d9 0.7 |
d10 0.3 |
d11 0.4 |
d12 0.2 |
|
Significance |
0.2 |
0.8 |
0.7 |
0.7 |
0.7 |
0.7 |
0.7 |
0.7 |
0.7 |
0.7 |
0.7 |
0.4 |
|
Sizes |
600,100 |
840,720 |
240,150 |
240,150 |
240,150 |
240,150 |
240,150 |
240,150 |
240,150 |
240,150 |
240,150 |
100,50 |
Table 11. 12 correlations between elements to be laid out
|
Coding |
d1 |
d2 |
d3 |
d4 |
d5 |
d6 |
d7 |
d8 |
d9 |
d10 |
d11 |
d12 |
|
d1 |
1 |
0.1 |
0.1 |
0.1 |
0.1 |
0.1 |
0.1 |
0.1 |
0.1 |
0.1 |
0.1 |
0.1 |
|
d2 |
0.1 |
1 |
0.4 |
0.4 |
0 |
0 |
0 |
0.7 |
0.7 |
0.7 |
0.7 |
0 |
|
d3 |
0.1 |
0.4 |
1 |
0.8 |
0.8 |
0.8 |
0.5 |
0.5 |
0.5 |
0.8 |
0.9 |
0 |
|
d4 |
0.1 |
0.4 |
0.8 |
1 |
0.1 |
0.8 |
0.8 |
0.9 |
0.9 |
0.7 |
0.6 |
0 |
|
d5 |
0.1 |
0 |
0.8 |
0.1 |
1 |
0.9 |
0.4 |
0.8 |
0.8 |
0.8 |
0.7 |
0 |
|
d6 |
0.1 |
0 |
0.8 |
0.8 |
0.9 |
1 |
0.9 |
0.8 |
0.9 |
0.3 |
0.2 |
0 |
|
d7 |
0.1 |
0 |
0.5 |
0.8 |
0.4 |
0.9 |
1 |
0.5 |
0.5 |
0.2 |
0.4 |
0 |
|
d8 |
0.1 |
0.7 |
0.5 |
0.9 |
0.8 |
0.8 |
0.5 |
1 |
0.8 |
0.7 |
0.9 |
0 |
|
d9 |
0.1 |
0.5 |
0.8 |
0.9 |
0.8 |
0.9 |
0.5 |
0.8 |
1 |
0.8 |
0.4 |
0 |
|
d10 |
0.1 |
0 |
0.5 |
0.1 |
0.7 |
0.5 |
0.4 |
0.5 |
0.2 |
1 |
0.5 |
0.5 |
|
d11 |
0.1 |
0.7 |
0.9 |
0 |
0.5 |
0.3 |
0.4 |
0.1 |
0.3 |
0.5 |
1 |
0.5 |
|
d12 |
0.1 |
0 |
0 |
0 |
0 |
0 |
0 |
0 |
0 |
0.5 |
0.5 |
1 |
Table 12. Calculated result coordinates
|
Pending Layout Element |
x Coordinate |
y Coordinate |
|
d1 |
25 |
24 |
|
d2 |
299.25 |
154.15 |
|
d3 |
25.39 |
162.13 |
|
d4 |
25.39 |
387.28 |
|
d5 |
25.39 |
614.43 |
|
d6 |
25.39 |
841.58 |
|
d7 |
1179.39 |
152.73 |
|
d8 |
1179.39 |
379.88 |
|
d9 |
1179.39 |
605.03 |
|
d10 |
1179.28 |
832.13 |
|
d11 |
300.57 |
890.13 |
|
d12 |
1301.02 |
24.13 |
Figure 4. Low fidelity map after layout optimization
The system platform interface is selected as the research subject. Initially, the information elements on the platform's homepage are encoded. These elements include: Digital Factory, Material Management, Quality Inspection, Work Valuation, Completion Data, Change Design, Credit Evaluation, Fund Management, Contract Management, Work Processes, Time Display, and System Name - totaling twelve elements for layout. Experts are invited to score decision elements, and elements are standardized, as shown in Table 10. 12 correlations between elements to be laid out as shown in Table 11.
By following the aforementioned steps, encoding, and employing the SSA for iterative optimization, the layout elements at the 20th iteration are presented in Table 12.
Combining the data, the layout optimization scheme obtained is shown in Figure 4.
3.4 Color scheme prediction based on user requirements
The mapping between image space and color space is not a one-to-one relationship. To make the color scheme align with color image semantics, the semantic analysis method is applied to address the complex mapping issue between color space and image space. The color image assessment design process is as follows:
Step 1: Extract feature colors from the existing platform using the improved GNG clustering algorithm to determine the colors for the color scheme, constructing a color scheme sample library.
Step 2: Gather sensory image adjectives for the BIM system platform and select representative samples and adjectives to construct the image space.
Step 3: Explore the relationship between image vocabulary and color samples through semantic differential methods, building a mapping model. Express sensory demands and expectations for colors through image vocabulary.
Step 4: Utilize gray clustering methods to categorize image vocabulary into three grayscale categories: "lively-neutral-lonely." This is used to predict the overall color scheme tendencies for the human-computer interface.
3.4.1 Establishing feature color groups
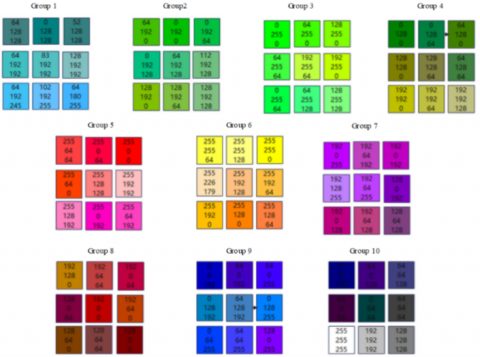
In this study, the improved GNG algorithm is used for clustering. Since input images are typically stored in 8-bit grayscale format, representing data within 256 grayscale levels, every color pixel falls within the range of 0-255. When inputting data into the improved GNG neural network, all color pixels are normalized to values between 0 and 1, which corresponds to the range of 0-255. The experimental steps are as follows: Search for color image semantics related to project management system platforms. Collect a large number of interface color design examples from online media. Invite 20 professionals, including teachers and graduate students specializing in design, to conduct preliminary screening of the collected samples. Ultimately, select 30 interface color samples with significant relevance to the target color image semantics for color clustering based on the adaptive GNG algorithm.
Through iterative optimization and the construction of a sample library using extracted feature color RGB values, a total of 90 colors are obtained. These colors are then grouped based on color similarity, resulting in 10 groups, as depicted in Figure 5.
Figure 5. Characteristic color grouping
3.4.2 Color image semantics analysis and semantic mapping model
Color semantic analysis can be expressed through antonymous forms. According to semantic classification, three common features are extracted for all color semantics in the sample library: evaluative, activity, and potential. The results obtained through semantic induction are shown in Table 13.
Color features can evoke emotions and associations in users. For example, green often conveys environmental consciousness, tranquility, and associations with nature, such as forests. Users can express their expectations and basic needs for colors through the derived image semantics words. Predicting a color scheme that aligns with user color image preferences during the early stages of color design can enhance user satisfaction with the system platform's color scheme.
The image vocabulary involved is obtained through the Semantic Differential method. Initially, 156 sensory words were collected through literature research and user interviews. Through group discussions and evaluations, negative words were removed and similar words were merged. The 18 most frequent image vocabulary words were selected, and antonymous pairs were created for each. The result is 18 sets of vocabulary related to the sensory image of the system platform, as shown in Table 14.
Table 13. Semantic categorization
|
Evaluative Factors |
Activity Factor |
Potential Factors |
|||
|
elegant |
pet |
warm |
dynamic |
heavy |
sticky |
|
common |
disagreeable |
chill |
static |
light |
light |
|
nice |
lovely |
restless |
proactive |
firm |
tight |
|
nasty |
bitter |
still |
negative |
tender |
slack |
|
cosy |
elegant |
inflated |
inspiring |
strong |
masculinisation |
|
uneven |
common |
contracted |
sluggish |
weak |
feminisation |
Table 14. Sensory imagery phrase
|
Serial Number |
Pair of Words |
Serial Number |
Pair of Words |
Serial Number |
Pair of Words |
|
N1 |
Simplicity - complexity |
N7 |
Fashion - tradition |
N13 |
Lively - lonely |
|
N2 |
Easy to use - hard to use |
N8 |
Durable - weak |
N14 |
Calm - dynamic |
|
N3 |
Technology - Classical |
N9 |
Beauty - ugliness |
N15 |
Friendship - resistance |
|
N4 |
Comfort - discomfort |
N10 |
Efficient - inefficient |
N16 |
Highbrow - lowbrow |
|
N5 |
Happy-unhappy |
N11 |
Coordination-disorder |
N17 |
Abundance - monotony |
|
N6 |
Intuitive - fuzzy |
N12 |
Easy to understand - hard to understand |
N18 |
Interesting - uninteresting |
Table 15. Color imagery evaluation score statistics
|
Colour Sample |
Sample 1 |
Sample 2 |
Sample 3 |
Sample 4 |
Sample 5 |
Sample 6 |
Sample 7 |
Sample 8 |
Sample 9 |
Sample 10 |
|
R |
0 |
64 |
128 |
192 |
255 |
255 |
128 |
128 |
64 |
64 |
|
G |
128 |
192 |
255 |
192 |
64 |
128 |
0 |
64 |
128 |
64 |
|
B |
128 |
128 |
128 |
128 |
0 |
0 |
192 |
64 |
192 |
128 |
|
Imagery score |
0.63 |
0.82 |
0.85 |
0.52 |
0.71 |
0.78 |
0.83 |
0.59 |
0.75 |
0.67 |
Color features have the ability to evoke emotions and associations in users.
Firstly, select one representative color sample from each of the 10 groups of similar color samples. Designate these selected colors as experimental samples and assign unique identifiers to each sample, Samplen, n=1,2,3,…,10.
In accordance with the field of Human-Computer Interaction (HCI), we extended invitations to a total of 30 participants possessing backgrounds in design, aged between 25±5 years, with normal or corrected-to-normal vision, Samplem, n=1,2,3,…,30.
Subsequently, employing the Semantic Differential Method, we constructed a five-point evaluation questionnaire to capture psychological variations across different dimensions. This questionnaire amalgamated ten representative color samples with carefully selected color-associated lexical terms. The color image assessments were positioned on a scale ranging form -2 to 2, with 0 signifying neutrality, -2 indicating discomfort, and 2 representing pleasure.
The experimental procedure involved the random presentation of the ten selected color samples on a computer screen to participants. Each participant was allotted a specific period for observing the color samples and providing semantic evaluations. These evaluations were quantitatively analyzed using the Likert scale.
Upon completion of the experiment, participant data encompassing assessments of color semantics were collected. After all participants had evaluated the ten prototypical color samples, the data underwent averaging, yielding the evaluation results as illustrated in Table 15.
3.4.3 Color image prediction based on grey clustering
The mapping relationship between monochromatic colors and color image semantics has been established through evaluations, as described earlier. However, typical color schemes in human-computer interfaces often involve the combination of multiple colors rather than a single color. To address this, this paper employs the Grey Clustering Method for color scheme prediction.
To begin, the set of color samples within the BIM system platform's color schemes is denoted as C=(1,2,…,n), while the collection of affective image vocabulary is represented as Y=(1,2,…,m). The clustering whitening coefficient for the third color scheme with respect to the fourth color image vocabulary is indicated as Coefficient fij. Consequently, this forms the color scheme matrix, denoted as Matrix A.
$A=\begin{matrix} \begin{matrix} 1 & 2 & \cdot \cdot \cdot & n \\\end{matrix} \\ \left[ \begin{matrix} {{d}_{11}} & {{d}_{22}} & \cdot \cdot \cdot & {{d}_{1n}} \\ {{d}_{21}} & {{d}_{22}} & \cdot \cdot \cdot & {{d}_{2n}} \\ \cdot \cdot \cdot & \cdot \cdot \cdot & \cdot \cdot \cdot & \cdot \cdot \cdot \\ {{d}_{m1}} & {{d}_{m2}} & \cdot \cdot \cdot & {{d}_{mn}} \\\end{matrix} \right]\begin{matrix} 1 \\ 2 \\ \cdot \cdot \cdot \\ m \\\end{matrix} \\\end{matrix}$ (1)
The calculation formula for determining the whitening weight function $I_j^e\left(f_{i j}\right)$ for color $j$ where color $f_{i j}$ is classified within group $\delta_i^e\left(\delta_i^e \subseteq(0,1]\right)$, and obtaining the clustering coefficient $\delta_i^e$ for the $i$ color scheme with respect to the $e$ semantic set can be expressed as follows:
$\delta_j^e=\sum_{j=1}^q I_j{ }^e\left(f_{i j}\right) g_j{ }^e$ (2)
In the provided context, where A represents the clustering weight, the calculation formula for $g_j{ }^e$ can be expressed as follows:
$g_j{ }^e=\frac{\varepsilon_j^e}{\sum_{j=1}^q \varepsilon_j^e}$ (3)
In the equation, $\varepsilon_j^e$ represents the threshold value for color j being a subclass of color e.
From the information provided, we can deduce that the clustering coefficient of the $i$ color scheme with respect to the e grayscale is denoted as $\delta_j^e$. By calculating these clustering coefficients, we obtain a vector $\delta_i=\left(\delta_1, \delta_2, \cdots, \delta_e\right)$ representing the color scheme's clustering effects on grayscale. The maximum value in this vector corresponds to the color scheme's image value.
To assign color scheme, color perception, and semantics, classifications are made based on different clustering indicators and the associated whitening values across e grayscales. This process is used for categorization. In this paper, the Grey Clustering Method is employed to associate the color sample set with grayscale image grayness, determining the gray membership function for whitening. This allows for vector calculations and categorization. A predictive model for color scheme images based on the BIM system platform is established, and a color scheme collection is constructed.
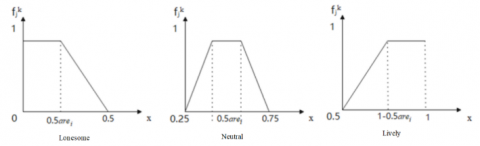
Therefore, assuming a ratio of color areas as arei, with color area ratio Q=(are1, are2, … aren), and are1+are2+…+ aren, we can establish the membership function for the semantic set described by the adjective "lively-lonely" as depicted in Figure 6. Typically, there are three levels of gray, and the semantic evaluation function is as follows:
Figure 6. Graph of the affiliation function of a semantic set
From Figure 7, it is evident that the semantic set is associated with two units along the horizontal axis. When converting the membership function of this semantic set into a whitening function, the threshold value A is defined as B. The whitening weight function (C) for color scheme effects on color image semantics is illustrated in the following diagram:
Figure 7. The whitening weight function of perceptual imagery
The color schemes from the BIM system platform, as shown in Figures 4-8, are obtained, and the mapping between color perception and color combinations is established through gray relationships in the color schemes. Various color schemes are presented to the participants for evaluation. When a specific color scheme is chosen, it implies that all the colors in that scheme are selected. Designers then assess and select the final color scheme.
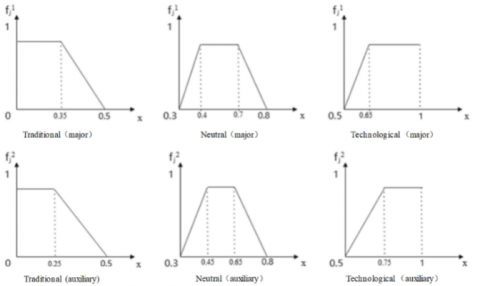
Figure 8. Whitening weight function
Using a specific railway system platform homepage as an example, color scheme prediction is carried out by applying the color scheme collection from Chapter Four to the platform for color design. The process begins with user interviews to ascertain the desired design style for the platform. Three image-associated terms are selected for evaluation. The term with the highest frequency, representing a technological theme, is extracted. In the color scheme collection, a corresponding representative color is selected. Grey clustering is then used to obtain the representative color scheme.
The color scheme is presented to participants in the form of images, consisting of three colors with an area ratio denoted as $T=\left(t_1, t_2, t_3\right)=(0.5,0.3,0.2)$ and a threshold set at 0.35. The whitening weight function is illustrated in Figure 8. Once the color scheme is obtained, it is applied to the color coordination of the BIM system platform.
This methodology ensures that the color scheme aligns with user expectations and the desired design style while incorporating representative colors from the color scheme collection and applying them effectively to the platform's color design.
4.1 Experimental design
The aforementioned process was used to construct the system interaction interface, employing Axure to build a human-computer interaction platform. This platform was utilized for UX optimization assessments. Physiological experiments were conducted using eye-tracking measurements in conjunction with subjective measurement scales for evaluation and analysis. Initially, 20 students with a background in design were selected to participate in platform operation experiments, where they performed tasks within the BIM platform. Subsequently, subjective evaluations were conducted using the NASA-TLX scale for the improved and optimized BIM intelligent project management platform.
Table 16. Comparison of results
|
Projects |
Option 1 |
Option 2 |
|
|
||
|
Length of time |
1.5472 |
1.432 |
|
Mental needs stamina requirement time requirement mission performance effort degree of frustration |
5.374 |
4.257 |
|
6.847 |
5.341 |
|
|
8 |
3.6 |
|
|
5.79 |
3.98 |
|
|
5.32 |
4.85 |
|
|
78.5 |
60.3 |
4.2 Data analysis
The designed solution was compared with the optimization methods presented in this paper. As shown in Table 16, option 1 represents the traditional approach, while option 2 is the optimized approach utilizing the methods described in this paper. Comparing eye-tracking annotation trajectory data revealed that users in solution two had shorter task search paths and quicker cognitive speeds. Furthermore, based on participant evaluations, solution two exhibited lower cognitive load values, indicating that this method enhances the efficiency of designers, improves their grasp of user requirements, and enhances the overall UX.
Research on UX in human-computer system interactions has gained increasing attention, but there is currently limited research on UX within BIM system platforms in China. This paper, guided by the concept of UX, introduces situational theory into system platform design. By combining situational theory with UX, multidimensional situational analyses are conducted to comprehensively uncover user requirements. This approach establishes a more comprehensive method for uncovering user needs, incorporating the KANO model and QFD House of Quality. It aligns with the user-centered design philosophy, resulting in more comprehensive design strategies for the UX. The derived design strategies are then used for further optimization, focusing on three aspects: system architecture, interface layout, and color scheme prediction. Integration of System Functionality: This involves conducting a correlation analysis based on system platform functionality. Cognitive Load Adjustment: Design strategies are formulated to adjust cognitive load, constructing a multi-objective optimization function. The SSA is used to seek optimal solutions, resulting in an optimized interface layout. Color Scheme Prediction: An improved GNG clustering algorithm is used to extract characteristic colors from existing system platform source images. This forms a color sample library, enabling the prediction of color schemes that are better suited for specific user groups based on the original platform's color schemes. Finally, the feasibility of the research is validated by constructing a BIM system platform and conducting a case study.
Scientific Research Project of Higher Education Department of Guizhou Province (Grant No.: Guizhou Teaching Technique [2022] 305); The Research Foundation for Advanced Talents supported by Guiyang University (Grant No.: GYU-KY-2024).
[1] Schiavi, B., Havard, V., Beddiar, K., Baudry, D. (2023). A VR training scenario editor for operation in construction based on BIM 4D and domain expert authoring. Smart and Sustainable Built Environment, 12(5): 1074-1089. https://doi.org/10.1108/SASBE-06-2022-0125
[2] Khalili, A. (2021). An XML-based approach for geo-semantic data exchange from BIM to VR applications. Automation in Construction, 121: 103425. https://doi.org/10.1016/j.autcon.2020.103425
[3] Samarasinghe, D.A.S., Piri, I.S. (2022). Assessing design buildability through virtual reality from the perspective of construction students. Built Environment Project and Asset Management, 12(5): 823-836. https://doi.org/10.1108/BEPAM-03-2021-0054
[4] Alizadehsalehi, S., Hadavi, A., Huang, J.C. (2021). Assessment of AEC students’ performance using BIM-into-VR. Applied Sciences, 11(7): 3225. https://doi.org/10.3390/app11073225
[5] Shahinmoghadam, M., Natephra, W., Motamedi, A. (2021). BIM-and IoT-based virtual reality tool for real-time thermal comfort assessment in building enclosures. Building and Environment, 199: 107905. https://doi.org/10.1016/j.buildenv.2021.107905
[6] Schiavi, B., Havard, V., Beddiar, K., Baudry, D. (2022). BIM data flow architecture with AR/VR technologies: Use cases in architecture, engineering and construction. Automation in Construction, 134: 104054. https://doi.org/10.1016/j.autcon.2021.104054
[7] Kamari, A., Paari, A., Torvund, H.Ø. (2020). Bim-enabled virtual reality (VR) for sustainability life cycle and cost assessment. Sustainability, 13(1): 249. https://doi.org/10.3390/su13010249
[8] O’Grady, T.M., Brajkovich, N., Minunno, R., Chong, H.Y., Morrison, G.M. (2021). Circular economy and virtual reality in advanced BIM-based prefabricated construction. Energies, 14(13): 4065. https://doi.org/10.3390/en14134065
[9] Kim, J.I., Li, S., Chen, X., Keung, C., Suh, M., Kim, T.W. (2021). Evaluation framework for BIM-based VR applications in design phase. Journal of Computational Design and Engineering, 8(3): 910-922. https://doi.org/10.1093/jcde/qwab022
[10] Lamon, E., De Franco, A., Peternel, L., Ajoudani, A. (2019). A capability-aware role allocation approach to industrial assembly tasks. IEEE Robotics and Automation Letters, 4(4): 3378-3385. https://doi.org/10.1109/LRA.2019.2926963
[11] Huang, J., Pham, D.T., Li, R., et al. (2021). An experimental human-robot collaborative disassembly cell. Computers & Industrial Engineering, 155: 107189. https://doi.org/10.1016/j.cie.2021.107189
[12] Zagermann, J., Hubenschmid, S., Balestrucci, P., et al. (2022). Complementary interfaces for visual computing. IT-Information Technology, 64(4-5): 145-154. https://doi.org/10.1515/itit-2022-0031
[13] Rasmussen, J., Vicente, K.J. (1989). Coping with human errors through system-design: Implications for ecological interface design. International Journal of Man-Machine Studies, 31(5): 517-534. https://doi.org/10.1016/0020-7373(89)90014-X
[14] Xia, W.D., Lee, G.H. (2005). Complexity of information systems development projects: Conceptualization and measurement development. Journal of Management Information Systems, 22(1): 45-83. https://doi.org/10.1080/07421222.2003.11045831
[15] Flood, A., Keegan, R.J. (2022). Cognitive resilience to psychological stress in military personnel. Frontiers in Psychology, 13: 809003. https://doi.org/10.3389/fpsyg.2022.809003
[16] Jin, W., Yao, Y., Ren, G., Zhao, X. (2022). Evaluation of integration information signage in transport hubs based on building information modeling and virtual reality technologies. Sustainability, 14(16): 9811. https://doi.org/10.3390/su14169811
[17] Astaneh Asl, B., Dossick, C.S. (2022). Immersive VR versus BIM for AEC team collaboration in remote 3d coordination processes. Buildings, 12(10): 1548. https://doi.org/10.3390/buildings12101548
[18] Sun, H., Guo, W., Wang, L., Rong, B. (2022). An analysis method of dynamic requirement change in product design. Computers & Industrial Engineering, 171: 108477. https://doi.org/10.1016/j.cie.2022.108477.
[19] Su, C., Min, X., Shi, Q., Chen, W.T., Wang, Z., Wang, S.H. (2022). Design method of the modeling safety protection of corrugated board production lines based on eye tracking and fuzzy Kano. Journal of Machine Design, 39(9): 148-154.
[20] Wang, W., Feng, R., Wei, T. (2022). Emotional design of epidemic prevention products based on fuzzy Kano model. Journal of Machine Design, 39(10): 140-146.
[21] Zhang, M., Sun, L., Wang, G.A., Li, Y., He, S. (2022). Using neutral sentiment reviews to improve customer requirement identification and product design strategies. International Journal of Production Economics, 254: 108641. https://doi.org/10.1016/j.ijpe.2022.108641
[22] Shahin, A., Nourmohammadi, A. (2023). Selecting new products by the revised ideal ratio: A Kano model approach. The TQM Journal, 35(7): 2052-2067. https://doi.org/10.1108/TQM-03-2022-0110.
[23] Siwiec, D., Pacana, A., Gazda, A. (2023). A new QFD-CE method for considering the concept of sustainable development and circular economy. Energies, 16(5): 2474. https://doi.org/10.3390/en16052474
[24] Yang, X., Zhang, J., Wang, Y., Zhang, Z. (2022). Construction of a product design model based on multi-scenario FBS-QFD. In International Conference on Mechanical Design and Simulation (MDS 2022), Wuhan, China, 12261: 418-425. https://doi.org/10.1117/12.2639054
[25] Xiao, J., Wang, X., Zhang, H. (2022). Coping with diversity ratings in prioritizing design requirements in quality function deployment: A consensus-based approach with minimum-maximum adjustments. Computers & Industrial Engineering, 163: 107799. https://doi.org/10.1016/j.cie.2021.107799
[26] Jin, X., Li, M., Liu, X., et al. (2022). Design research on gas turbine casing based on QFD and TRIZ. Journal of Engineering for Thermal Energy and Power, 37(5): 174-179.
[27] Fazeli, H.R., Peng, Q. (2023). Integrated approaches of BWM-QFD and FUCOM-QFD for improving weighting solution of design matrix. Journal of Intelligent Manufacturing, 34(3): 1003-1020. https://doi.org/10.1007/s10845-021-01832-w
[28] Liao, X., Wang, Z. (2022). Product innovation design method based on interval valued neutrosophic AHP/FAST/QFD. Journal of Machine Design, 39(8): 136-142.
[29] Mehlawat, M.K., Gupta, P., Mahajan, D. (2020). A multi-period multi-objective optimization framework for software enhancement and component evaluation, selection and integration. Information Sciences, 523: 91-110. https://doi.org/10.1016/j.ins.2020.02.076
[30] Li, X., Wu, X., Xu, S., Qing, S., Chang, P.C. (2019). A novel complex network community detection approach using discrete particle swarm optimization with particle diversity and mutation. Applied Soft Computing, 81: 105476. https://doi.org/10.1016/j.asoc.2019.05.003
[31] Ma, B., Lu, P., Zhang, L., et al. (2021). Enhanced sparrow search algorithm with mutation strategy for global optimization. IEEE Access, 9: 159218-159261. https://doi.org/10.1109/ACCESS.2021.3129255
[32] Kim, W.G., Lee, K.H. (2022). Evolutionary exploration of mechanical assemblies in VR. Mathematics, 10(8): 1232. https://doi.org/10.3390/math10081232
[33] Zhang, C., Ding, S. (2021). A stochastic configuration network based on chaotic sparrow search algorithm. Knowledge-Based Systems, 220: 106924. https://doi.org/10.1016/j.knosys.2021.106924
[34] Wang, G., Wang, X., Wang, Z., Ma, C., Song, Z. (2021). A VMD–CISSA–LSSVM based electricity load forecasting model. Mathematics, 10(1): 28. https://doi.org/10.3390/math10010028
[35] Liu, G., Shu, C., Liang, Z., Peng, B., Cheng, L. (2021). A modified sparrow search algorithm with application in 3d route planning for UAV. Sensors, 21(4): 1224. https://doi.org/10.3390/s21041224
[36] Meng, X.B., Gao, X.Z., Lu, L., Liu, Y., Zhang, H. (2016). A new bio-inspired optimisation algorithm: Bird swarm algorithm. Journal of Experimental & Theoretical Artificial Intelligence, 28(4): 673-687. https://doi.org/10.1080/0952813X.2015.1042530
[37] Nakahashi, R., Yamada, S. (2021). Balancing performance and human Autonomy with Implicit guidance agent. Frontiers in Artificial Intelligence, 4: 736321. https://doi.org/10.3389/frai.2021.736321
[38] Elix, B., Naikar, N. (2021). Designing for adaptation in workers' individual behaviors and collective structures with cognitive work analysis: Case study of the diagram of work organization possibilities. Human Factors, 63(2): 274-295. https://doi.org/10.1177/0018720819893510