Abdulkadir Albayrak
© 2022 IIETA. This article is published by IIETA and is licensed under the CC BY 4.0 license (http://creativecommons.org/licenses/by/4.0/).
OPEN ACCESS
COVID-19 is an infectious disease caused by a newly discovered coronavirus called SARS-CoV-2. There are two ways of contamination risk, namely spreading through droplets or aerosol-type spreading into the air with people's speech in crowded environments. The best way to prevent the spread of COVID-19 in a crowd public area is to follow social distance rules. Violation of the social distance is a common situation in areas where people frequently visit such as hospitals, schools and shopping centers. In this study, an artificial intelligence-based social distance determination study was developed in order to detect social distance violations in crowded areas. Within the scope of the study, a new dataset was proposed to determine social distance between pedestrians. The YOLOv3 algorithm, which is very successful in object detection, was compared with the SSD-MobileNET, which is considered to be a light weighted model, and the traditionally handcrafted methods Haar-like cascade and HOG methods. Inability to obtain depth information, which is one of the biggest problems encountered in monocular cameras, has been tried to be eliminated by perspective transformation. In this way, the social distance violation detected in specific area is notified by the system to the relevant people with a warning.
social distancing, pedestrian detection, COVID-19, artificial intelligence, deep learning
COVID-19 was first reported by China in December 2019 and the outbreak was announced as pandemic by Word Health Organization on 11 March 2020. It caused more than 1.6 million deaths worldwide since its official appearance World Health Organization [1]. The COVID-19 pandemic has led a huge economic impact across the world due to business interruptions and lockdowns in addition to its cultural, social, political and educational effect [2, 3]. Researchers from many countries of the world are continuing their vaccine and treatment studies for COVID-19. Although an exceptional progress has been made in vaccination studies, the duration of its protection, its applicability to people of all age groups and health conditions on a large scale are still discussed. For this reason, taking preventive measures has been the first priority of countries. Social distancing has been proven to be one of the most important precautions to be taken to prevent the spread of COVID-19 corona virus outbreak. It has a great impact on reducing mortality rates and improving quality of medical care for non-COVID-19 issues due to avoided overwhelming of hospital intensive care units. Although the economic cost of social distancing is a matter of debate [4], state of art on the effects of it reveals that these mentioned contributions of social distancing to healthcare system demonstrate economic benefits of it in the long term [5].
Lockdown in infectious diseases such as COVID-19 and monkeypox negatively affects the psychology of people due to deprivation of social life. In addition, it has negative socio-economic effects on governments. In this study, an image processing-based detection of social distance violations, especially in closed public areas, is proposed to minimize this negative effects. In the images obtained by using cameras located in public areas, the distance between people will be calculated and possible critical areas will be determined and violations will be minimized.
Surveillance cameras, which are already widely used at indoors and outdoors for security purposes, have a great potential to measure social distancing in real time and to make necessary warnings and arrangements. Motivated by this notion, this study presents a novel deep learning based approach for monitoring social distancing by analyzing surveillance video recordings. The proposed model utilizes the YOLOv3, which is an accurate and fast object detection framework, for pedestrian detection purpose. Obtained detection boxes are used for calculating the pairwise distance of people and extracting a heat map is extracted for visualizing movement patterns of them. The key points of the proposed system are given below:
– Pedestrian detection performance of YOLOv3 was compared with traditional shallow techniques including Histogram of Oriented Gradients (HOG), Haar-like cascade and SSD-MobileNET.
– Perspective transform was used to eliminate the effect of camera angle and location on the calculation of social distance.
– A novel generalizable social distance measurement and warning system that does not require camera calibration was developed which extracts and uses actual measurements regarding to the field of view.
– A new social distancing dataset including the ground truths of detection boxes for pedestrians and pairwise social distance measurements is prepared and presented for public usage.
The rest of the paper is structured as follows: The related work is presented in Section 2. The databases are introduced in Section 3. The material and methods are explained in Section 4. Experimental results and discussion are presented in Section 5 and 6, respectively. Finally, the paper is concluded with Section 7.
Visual detection of pedestrians is a crucial step for various types of applications such as smart transportation systems, person identification, fall detection and crowd analysis. Ansari et.al. classified pedestrian detection techniques into four main approaches as face feature based, motion feature based, body appearance and deep learning based methods [6]. Deep learning based methods including CNN, Fast R-CNN, Single Shot MultiBox Detector (SSD) and YOLO distinguished from others in terms of achieved high success rates and reliability [2].
Analysis of video recordings in terms of the motion characteristics of pedestrians is a research subject that has different application areas. There are some published works that concentrate on crowd analysis. Crowd counting is one of the open challenging issues due to collisions and illumination conditions [7]. HOG, Random Forest (RF) model and Convolutional Neural Network (CNN) based methods are frequently used for crowd counting [8].
Along with the emergence of COVID-19, very few studies on social distancing have been published recently. Basically, social distancing studies involve two main steps; pedestrian detection in the video and evaluating their locations in terms of their distance to each other.
Cristani et al. [9] presented a comprehensive overview about computer vision solutions to visual social distance estimation task elaborating scene geometry understanding, person detection, pose estimation and visual social distance characterization. Even though they do not present a new methodology regarding to social distance measurement methods, they pointed strong ethical and privacy concerns that need to be addressed and give a good perspective of social distancing problem.
Punn et al. [10] used YOLOv3 to detect pedestrians on video recordings and exploited Deep-sort technique for tracking the people. Pairwise L2 norm is computed based on the centroid coordinates and size of detected bounding boxes. Researchers determined a closeness threshold empirically in order to compute the number of social distance violations. They have tested their framework on Oxford Town Center dataset (OTC) [11]. They evaluated the performance of the system in terms of object detection success and compared Faster R-CNN, SSD and YOLO methods. They noted that as compared to Faster R-CNN and SSD, YOLOv3 provided best balance between Mean Average Precision (mAP), training time, and frame per second (FPS) score.
YOLO has been the choice of different researchers working on social distancing since it enables real time operations and provides accurate results [12, 13]. Human detection step followed by transforming detected person coordinates to bird’s eye view by using inverse homography transformation [12]. Pairwise distances between pedestrians are calculated by Euclidean distance. Authors exploited linear regression model in order to find maximum critical social density that can still ensure safe social distance. They verified the proposed method by using 3 different datasets; Oxford Town Center Dataset, Mall Dataset [14] and Train Station Dataset [15]. Critical density values of each dataset are calculated and evaluated. They compared the mAP values that are achieved by YOLOv4 and Faster R-CNN for each dataset and got very close success rates. Ahmed et al used videos that have overhead view perspective in order to monitor social distance. They reveal the positive affect of transfer learning in human detection task [12].
Landing AI designed a tool that help providing appropriate social distancing in workplaces [16]. An open-source pedestrian detection network based on the Faster R-CNN architecture is employed. Their methods involve a calibration step that estimates the scale factor of the bird’s eye view such as how many pixels correspond to 6 feet in real life. Developed tool highlight people on the frames who violet the social distance in red, and draw a line between them to emphasize violation.
Khandelwal et al. proposed a system that performs face mask detection and person detection in order to enhance safety of workforce [17]. Their face mask detection scheme combines face detection and mask detection models. MobileNetV2 is used as the core model for all detection models including person detection. They used inverse perspective transform to constitute the spatial relationship between the objects. Extracted transformation matrix is tested by taking a sample image in perspective view and measuring the dimension manually on ground.
In addition to the studies that analyzes the distances of the detection boxes, there are also some studies that use the lengths of human body parts as reference point. Aghaei et al. [18] detected people in the image using a human body-joint detector namely OpenPose [19]. They exploited homograph matrix to calculate the ground truths for pairwise inter-person distances and estimated the safe area with a radius r around all the detected people. The violation of social distance is than detected if determined safe area of a person overlaps with any others. The r distance is roughly estimated proportional to the pixel lengths of detected human body parts.
Table 1 provides a summary of the studies performed in the literature on human detection, crowd detection and social distance detection. Although there is no open access standard dataset in this area, the Oxford Town Center Dataset is generally preferred. In this proposed study, in addition to the OTC dataset, there is a dataset that we created within the scope of the study, in which each person is marked.
Table 1. Summary of human detection, crowd detection and social distance detection studies carried out in the literature
|
author |
year |
dataset |
method |
publication type |
task |
|
Ansari et al. |
2021 |
- |
- |
survey |
Human detection |
|
Alotaibi et al. |
2020 |
UCF-QNFR |
CNN |
research |
crowd analysis |
|
Cristani et al. |
2020 |
- |
- |
comprehensive overview |
social distancing |
|
Punn et al. |
2020 |
PASCAL-VOC MS-COCO |
YOLO and Deep sort techniques |
research |
Human detection |
|
Yang et al. |
2021 |
OTC |
Yolo |
research |
social distancing |
|
Landing |
2020 |
OTC |
Faster R-CNN |
app |
social distancing |
The Proposed social distance monitoring system is tested on two different datasets.
3.1 Pixabay Walking at Mall (PWM) dataset
The first dataset used in the study is a video recording that includes people walking in a mall. It is free for commercial usage and shared by pixabay.com [20]. The video consists of 341 image frames at 1920x1080 resolution. This is the first time that Pixabay Walking at Mall (PWM) video is used for social distancing task. Bounding box of each pedestrian is annotated manually. Generated dataset is novel since it includes pedestrian detection and distance measurement ground truths both. A sample image frame of the video and annotated pedestrian bounding boxes are demonstrated in Figure 1-a and Figure 1-b respectively.
The coordinates of each pedestrian in the image are stored in pascal/voc format. There are different approaches in the literature that concentrates on social distancing in order to transform the distances calculated in pixels to real world measurements such as using the lengths of detected body parts. In the PWM dataset, the floor surface is covered with identical tiles. In the proposed method, floor tiles are used as a relative evaluation reference since they are independent from camera location and angle.
Figure 1. (a) Sample image frame obtained from PWM dataset and (b) annotated of human with bounding boxes in the same frame
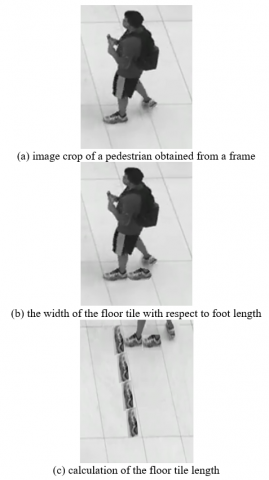
Figure 2. The floor tile length is calculated by referring to the foot of a pedestrian in the image crop
Dimensions of the floor tiles are calculated exploiting feet measure. In order to calculate the pixel length of 1 feet in 2D view, the shoe length of a person in a video frame (Figure 2-a) was used as a reference. The image segment that includes shoe is cropped and used for determining the approximate width (Figure 2-b) and length (Figure 2-c) of a floor tile. The width and the length of floor tile are calculated as 60 cm and 120 cm, respectively.
3.2 Oxford Town Center (OTC) dataset
The other dataset which is used as an alternative to the generated PWM dataset is Oxford Town Center dataset. Oxford Town Center dataset involves a 4.59 minutes long video recording. Each image frame is at 1280x720 pixels resolution. A sample image frame from the dataset is given in Figure 3.
Figure 3. Sample image frame obtained from OTC dataset
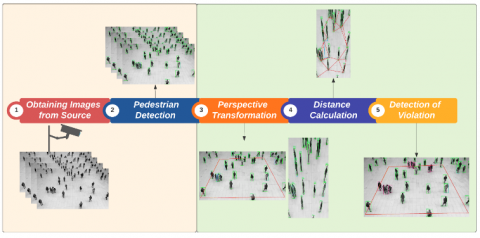
In this section we illustrate the proposed method for social distancing detection in detail. A flowchart of the architecture is given in Figure 4.
Figure 4. The flowchart of the proposed study
The proposed social distance monitoring system is composed of five main steps. At the first step, images of a wide area in mall center are acquired by a fixed camera. The second step involves the detection of pedestrians with a high success which is crucial for reliable social distance calculation. Traditional hand-crafted methods and deep learning methodologies which have a proven success are employed and their results are compared within the context of this study. In order to perform human detection task, Haar Cascade and Histogram of Oriented Gradient (HOG) which are traditional methods used in the literature are applied in addition to two different deep learning algorithms SSD Mobile Net and YOLO V3 [21-24]. SSD Mobile Net is preferred due to its high performance on mobile devices thanks to its speed and memory efficiency. On the other hand, YOLO V3 became popular among other pedestrian detection frameworks because of its high success rates [25]. After human detection step, a certain area of interest so called counting area which is independent of camera resolution and localization is determined in the images in order to calculate the real pair-wise distance of pedestrians. Counting area must be measurable without any calibration requirements. At the third step, perspective transformation is applied to images which have depth information object on a two dimensional bird-view surface [26]. It is essential to protect depth information while performing the perspective transformation. In this way, the interpretation of the depth information in the monochrome camera and the calculation of the real distance between pedestrians can be more stable. In order to perform perspective transformation, x and y coordinates of the corners of a rectangular shaped transformation area from which is wanted to gather information by changing the perspective are required.
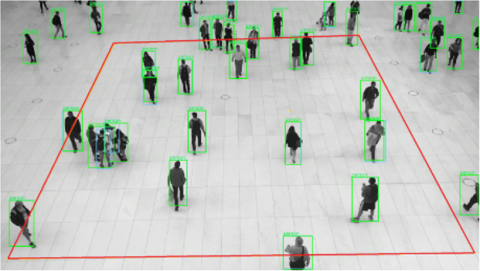
Figure 5. Counting area of PWM dataset
The proposed social distance monitoring algorithm is applied on PWM and Oxford Town Center datasets. In PWM dataset floor tiles are used as reference in determining counting area. Therefore, corners of the determined counting area are used as transformation area coordinates. An area on the ground surface which is at a length of 10 floor tiles (10x120 cm) and a width of 24 floor tiles (24x60 cm) is determined as counting area. Counting area of PWM dataset is given in Figure 5.
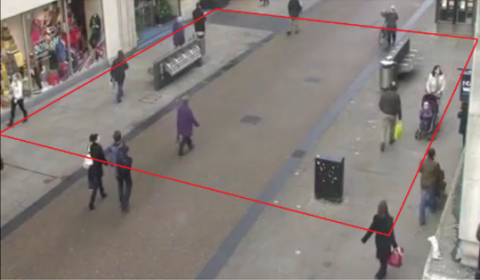
In the Oxford Town Center dataset, the width and a certain length of the street is chosen as the counting area. Determined counting area is given in Figure 6.
Figure 6. Counting area of OTC dataset
After performing the perspective transformation, the pairwise distances of detected humans are calculated by Euclidean distance at the fourth step.
Social distance calculation requires conversion of the calculated pixel distance to the actual distance. For the PWM dataset, this conversion is made by suitably proportioning the tile dimensions and the pixel distance. On the other hand, social distance calculation of Oxford Town Center dataset was made based on the average number of steps of humans. At the last step, bounding boxes of humans who violate the social distance are marked with a red.
Performance of four object detection methods; Haar-like Cascade, HOG, SSDMobileNet and YOLOV3 on PWM and Oxford Town Center Dataset are evaluated in order to contribute to the industrial applications. These algorithms have some differences in terms of usage of hardware resources, time and detection performance. Haar-Cascade runs on CPU, while using customized filters to find a particular pattern. In large public areas where a huge amount of image data is transferred from different sources may not be analyzed in real time with Haar-Cascade. Like the Haar Cascade, the HOG algorithm works on the CPU as well. The same scenario applies to the HOG algorithm. Deep learning algorithms differ from traditional methods in this respect. With deep learning methods, real-time operations can be performed using the graphical processing unit (GPU). Since deep learning algorithms use generalized filters in feature extraction, color, shape, and textural features of the regions to be detected are learned intuitively, so they can perform better in classification or detection. Here, the main difference between mobileNET and YOLO is that it depends on whether it works on a central server or on the edge, due to its size. The deep learning method that works on a camera or a card with small resources should be chosen as light-weighted. Table 2 demonstrates the time performance and mAP values (IoU=0.5 and IoU=0.3) of deep learning approaches and traditional methods in pedestrian detection task on PWM dataset which is proposed in this study. It is observed that YOLOV3 model achieved maximum mAP values among other methods.
Table 2. mAP values and time performance of the pedestrian detection methods for the PWM dataset
|
Method |
mAP(IoU0.5) |
Time |
|
Haar-like |
%16.71 |
3.08s |
|
HOG |
%18.34 |
6.3s |
|
SSD-MobileNET |
%43.71 |
0.001s |
|
YOLOv3 |
%90 |
0.006s |
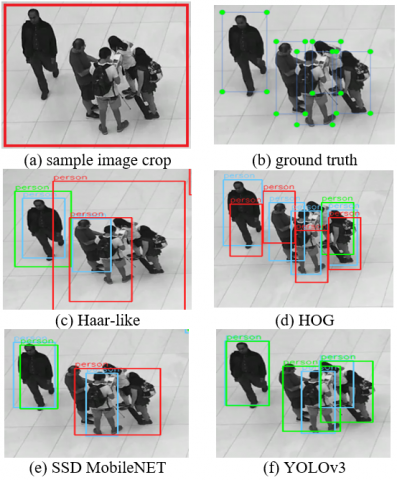
The first column of the table indicates the methods applied in this study, while the other columns represent the mAP values with IoU rate of 0.5, 0.3, and the time performance for detecting pedestrian in single frame, respectively. Since the IoU rates are affected by the width of the pedestrians, two different mAP values are used. When the results are evaluated, it is seen that the YOLOv3 is the most successful one among the applied methods. When the time performances were examined, it was seen that deep learning methods could process the images with a resolution of 1920x1080 pixels in real-time whereas, Haar-like and HOG methods are not convenient for real-time applications. Detecting of crowded in the images is of crucial importance while determining social distance. Figure 7 shows an image crop where the methods applied in the study failed. Figure 7(a) represents a sample image crop obtained from one single frame of the dataset and Figure 7(b) represents the ground truth of the current image crop. Figure 7 (c)-(f) describe the detection performance of the Haar-like, HOG, SSD-MobileNET and YOLOv3 algorithms, respectively. The detection window that is drawn by Haar-like cascade algorithm generally includes crowd.
Figure 7. Detection performance of the methods used in the study in determining a group of people
It has been observed that the dimensions of the drawn rectangles in Haar-like cascade are also larger compared to other algorithms. Like the Haar-like cascade, the SSD-MobileNET algorithm draws a single rectangle that includes the entire group, but the size of the rectangle drawn in SSD-MobileNET is relatively smaller than Haar-like cascade algorithm. On the other hand, HOG and YOLOv3 methods are able to detect each person relatively more successfully and draw more consistent frames accurately. It has been observed that YOLOv3 algorithm outperforms other methods in terms of its ability to detect individuals in crowd.
Figure 8 represents sample image frames obtained from the datasets and counting are of the related frames. Figure 9 shows examples image sections obtained from the two datasets where social distance violations exist. The light tones in the figure shows the areas where people are the most crowded. On the other hand, the areas expressed in dark color indicates the areas with low human density. The heatmap is an important graphic in terms of determining critical areas especially in indoors environments.
Figure 8. Social distance violence in two datasets. In both of datasets, the potential critical social distance violence is annotated with red rectangle as can be seen from (a) and (b)
Figure 9. A sample image obtained from datasets and heatmap of each region of these images. Areas with social distancing violations are expressed in a lighter color
In this paper, a study for detection of social distance in public areas has been carried out by using traditional handcrafted methods and deep learning techniques comparatively. Perspective transformation which is used to transform an image from perspective view to bird-eye view was exploited to avoid localization and perspective errors. Especially in crowded environments such as hospitals, schools, shopping centers, determining social distance violations and preventing high density will contribute to less spread of the disease. Since the problem is quite current and the contagiousness is high, there is no public benchmark prepared to calculate the exact distance between each individual pedestrian in the literature. For this purpose, dataset that exists in the literature used for pedestrian detection are used in determining social distances. With this study, a new dataset has also been created to calculate social distance and to identify possible critical areas. Individuals were marked in each image of the dataset and a specific counting area was determined to measure the pairwise distance of individiuals. Persons walking in a group or walking alone are frequently encountered in the dataset. Success of the methods to be applied to detect each individual in a group of people in critical areas can be compared.
While it was possible to detect individual pedestrians in the dataset, there were some difficulties in detecting each of the people in the group. For this reason, determining each of the people in crowded groups becomes important in calculating social distance. Traditional shallow methods, a lightweight deep learning model and well-performing YOLOv3 were used for pedestrian detection. While comparing traditional methods and deep learning methods in pedestrian detection, it was also examined whether these methods perform in real time on portable devices. The two datasets used in the study involves images obtained from monocular cameras. Determining the depth information is very difficult in monocular cameras. For this reason, the real size of the area where perspective transformation will be applied and the resolution in the camera gain importance. Providing a fully automated solution is technically very difficult since determining the depth information in a single monocular camera is a very difficult process. In this sense, studies using stereo and lidar images will gain importance in the future. It is an important point to pay attention to the fact that the camera should be stable and show a certain area in the images used in the study. When the time performance of the methods is compared, it is observed that deep learning methods can work in real time even though the width and height of the image are large. On the other hand, it was found that the Haar-like and HOG methods could not work in real time on the high resolution images.
In this paper, a study has been carried out in which the social distances of people in a certain area are calculated and possible violations are determined. Within the scope of this study, a dataset was created to be used for social distance determination and critical area detection. We believe that having a single dataset with annotations for person detection and distance measurement enable researchers to study and perform social distancing efficiently. Oxford Town Center dataset, which is used in pedestrian detection in the literature is also used as an alternative. Individuals in these datasets have been tried to be detected by using traditional and deep learning-based pedestrian detection algorithms. Because the image taken from a monocular camera does not contain depth information, the exact distance between people may not be measured. In this study, this limitation is overcome as follows: the area seen by the camera and whose size is known can be calculated to a precise distance by perspective transformation. Then, the distances between people in each dataset were calculated with the Euclidean distance metric. People standing together as a group may not be detected individually by traditional image processing methods. This limitation has been eliminated with the deep learning-based YOLOv3 algorithm. One of the biggest limitations with high resolution images is that algorithms cannot work in real time. In this study, traditional methods and deep learning methods were compared and it was observed that deep learning methods were both more successful and worked in real time. In this study, unlike the literature, a new dataset is presented to detect social distance violations. In addition, crowded and critical areas in the images are expressed with heat maps. Achieved success rates indicate that the proposed method is promising for industrial usage for social distance monitoring. In the future, the use of stereo cameras in order to obtain depth information in the image will make a great contribution to the calculation of the distance between people. Moreover, using high resolution cameras can prevent obtaining noisy images.
[1] World Health Organization (2020). Weekly Operational Update - 14 December 2020. https://www.who.int/publications/m/item/weekly-epidemiological-update---14-december-2020, accessed on May 28 2022.
[2] Martin, A., Markhvida, M., Hallegatte, S., Walsh, B. (2020). Socio-economic impacts of COVID-19 on household consumption and poverty. Economics of Disasters and Climate Change, 4(3): 453-479. https://doi.org/10.1007/s41885-020-00070-3
[3] Tarchoun, B., Khalifa, A.B., Dhifallah, S., Jegham, I., Mahjoub, M.A. (2020). Hand-crafted features vs deep learning for pedestrian detection in moving camera. Traitement du Signal, 37(2): 209-216. https://doi.org/10.18280/ts.370206
[4] Hilsenrath, J., Armour, S. (2020). As economic toll mounts, nation ponders trade-offs. https://www.wsj.com/articles/as-economic-toll-mounts-nation-ponders-the-trade-o, accessed on 23 March 2020.
[5] Greenstone, M., Nigam, V. (2020). Does social distancing matter? University of Chicago, Becker Friedman Institute for Economics Working Paper, No. 2020-26.
[6] Ansari, M., Singh, D.K. (2021). Human detection techniques for real time surveillance: A comprehensive survey. Multimedia Tools and Applications, 80(6): 8759-8808. https://doi.org/10.1007/s11042-020-10103-4
[7] Alotaibi, R., Alzahrani, B., Wang, R., Alafif, T., Barnawi, A., Hu, L. (2020). Performance comparison and analysis for large-scale crowd counting based on convolutional neural networks. IEEE Access, 8: 204425-204432. https://doi.org/10.1109/ACCESS.2020.3037395
[8] Khan, K., Albattah, W., Khan, R.U., Qamar, A.M., Nayab, D. (2020). Advances and trends in real time visual crowd analysis. Sensors, 20(18): 5073. https://doi.org/10.3390/s20185073
[9] Cristani, M., Del Bue, A., Murino, V., Setti, F., Vinciarelli, A. (2020). The visual social distancing problem. IEEE Access, 8: 126876-126886. https://doi.org/10.1109/ACCESS.2020.3008370
[10] Punn, N.S., Sonbhadra, S.K., Agarwal, S., Rai, G. (2020). Monitoring COVID-19 social distancing with person detection and tracking via fine-tuned YOLO v3 and Deepsort techniques. arXiv preprint arXiv:2005.01385.
[11] Harvey, A., LaPlace, J. (2019). Megapixels: Origins, ethics, and privacy implications of publicly available face recognition image datasets. Megapixels, 1(2): 6.
[12] Yang, D., Yurtsever, E., Renganathan, V., Redmill, K. A., Özgüner, Ü. (2021). A vision-based social distancing and critical density detection system for COVID-19. Sensors, 21(13): 4608. https://doi.org/10.3390/s21134608
[13] Ahmed, I., Ahmad, M., Rodrigues, J.J., Jeon, G., Din, S. (2021). A deep learning-based social distance monitoring framework for COVID-19. Sustainable Cities and Society, 65: 102571. https://doi.org/10.1016/j.scs.2020.102571
[14] Chen, K., Loy, C.C., Gong, S., Xiang, T. (2012). Feature mining for localised crowd counting. Bmvc, 1(2): 3. https://doi.org/10.5244/C.26.21
[15] Zhou, B., Wang, X., Tang, X. (2012). Understanding collective crowd behaviors: Learning a mixture model of dynamic pedestrian-agents. In 2012 IEEE Conference on Computer Vision and Pattern Recognition, Providence, RI, USA, pp. 2871-2878. https://doi.org/10.1109/CVPR.2012.6248013
[16] Landing, A.I. (2020). Creates an AI Tool to Help Customers Monitor Social Distancing in the Workplace [Onlive].
[17] Khandelwal, P., Khandelwal, A., Agarwal, S., Thomas, D., Xavier, N., Raghuraman, A. (2020). Using computer vision to enhance safety of workforce in manufacturing in a post covid world. arXiv preprint arXiv:2005.05287.
[18] Aghaei, M., Bustreo, M., Wang, Y., Bailo, G., Morerio, P., Del Bue, A. (2021). Single image human proxemics estimation for visual social distancing. In Proceedings of the IEEE/CVF Winter Conference on Applications of Computer Vision, Waikoloa, HI, USA, pp. 2785-2795. https://doi.org/10.1109/WACV48630.2021.00283
[19] Cao, Z., Simon, T., Wei, S.E., Sheikh, Y. (2017). Realtime multi-person 2d pose estimation using part affinity fields. In Proceedings of the IEEE Conference on Computer Vision and Pattern Recognition, Honolulu, HI, USA, pp. 7291-7299. https://doi.org/10.1109/CVPR.2017.143
[20] https://pixabay.com/videos/people-commerce-shop-busy-mall-6387/, accessed on 23 May 2022.
[21] Viola, P., Jones, M.J. (2004). Robust real-time face detection. International Journal of Computer Vision, 57(2): 137-154. https://doi.org/10.1023/B:VISI.0000013087.49260.fb
[22] Monteiro, G., Peixoto, P., Nunes, U. (2006). Vision-based pedestrian detection using Haar-like features. Robotica, 24: 46-50.
[23] Dalal, N., Triggs, B. (2005). Histograms of oriented gradients for human detection. In 2005 IEEE Computer Society Conference on Computer Vision and Pattern Recognition (CVPR'05), pp. 886-893. https://doi.org/10.1109/CVPR.2005.177
[24] Howard, A.G., Zhu, M., Chen, B., et al. (2017). Mobilenets: Efficient convolutional neural networks for mobile vision applications. arXiv preprint arXiv:1704.04861
[25] Wang, Y.N., Yang, Y.M., Li, Y. (2020). Recognition and difference analysis of human walking gaits based on intelligent processing of video images. Traitement du Signal, 37(6): 1085-1091. https://doi.org/10.18280/ts.370621
[26] Szeliski, R. (2010). Computer Vision: Algorithms and Applications. Springer Science & Business Media.