© 2018 IIETA. This article is published by IIETA and is licensed under the CC BY 4.0 license (http://creativecommons.org/licenses/by/4.0/).
OPEN ACCESS
This paper attempts to overcome the difficulties in crack detection by cross-section images arising from low contrast and complex pavement texture. For this purpose, a crack detection algorithm was proposed through the multi-feature test of cross-section image. Firstly, the crack image was subjected to dimension reduction, grayscale correction and filtering. After that, the crack section was determined in the processed crack image through the tests on multiple features, namely, inclination, Gaussian distribution and edge gradient. Finally, the proposed algorithm was applied to detect the cracks on actual asphalt pavement. The results show that our algorithm can achieve a high accuracy in the detection process.
asphalt pavement, crack detection, multi-feature test, cross-section image
Highway, as an important part of transportation system, plays a key role in the development of national economy. As one of the main forms of pavement damage, cracks seriously affect the level of highway service, so it is particularly important to obtain crack information timely and accurately.
Asphalt is widely used as pavement material in highway. However, its performance will be gradually damaged due to bad weather conditions and high-load traffic load, which seriously affects the road traffic safety. When the temperature difference between day and night is large or the annual temperature change is large, there are many temperature cracks in highway, which are generally manifested as transverse cracks with uniform spacing distribution. With the decrease of temperature and the increase of low temperature duration, the number of temperature cracks increases, and the lower the temperature, the wider the crack width is. At present, the means of asphalt crack detection mainly depend on manual detection, and the reliability of data is low, which is not conducive to the scientific maintenance of pavement.
With the rapid development of computer image processing technology, automatic detection technology based on digital image processing (Banharnsakun, 2015; Tian, 2017; Ying & Salari, 2010) emerges as the times require. Feature extraction and accurate identification of cracks are the focus of research in this field. Some existing methods are still difficult to extract crack information completely, so it is very necessary to improve the adaptability and robustness of the automatic detection algorithm for the maintenance of actual pavement. In order to improve the accuracy of crack detection, aiming at the multi-feature characteristics of cracks in images, a crack detection algorithm based on three main crack feature test for cross-section is proposed in this paper. The algorithm can avoid environmental interference, and it is not affected by low contrast of cracks, uneven background, changeable crack morphology and complex pavement texture.
In order to achieve automatic detection, many researchers have proposed many crack detection algorithms based on images, such as Laplasse operator, Sobel, Prewitt, Roberts operator, Canny algorithm and other edge detection algorithms (Yu et al., 2007; Ayenu-Prah & Attoh-Okine, 2008). However, this kind of algorithm is sensitive to noise and the cracks detected do not contain width information, so it can’t evaluate the severity of hazards. Nguyen et al. (2012) used anisotropic measurement method to detect cracks based on fracture characteristics, but large measurement scale will identify the area around the cracks as cracks, which is difficult to adapt to cracks of different widths. Wang and Tang. (2011) designed a threshold segmentation method based on sample space and linear interpolation according to the strong correlation between gray mean and standard deviation of image and threshold, which realized real-time crack detection. However, the cracks identified by this algorithm are mostly crack fragments and mixed with noise. Wang et al. (2010) constructed a multi-level denoising model to enhance the performance of effective information by extracting multi-temporal and multi-feature fusion of pavement information.
With the development of machine learning, in-depth learning, related research attempts to apply the classification method based on feature training to asphalt pavement crack detection. Oliveira & Correia, (2013) divide fracture image into small blocks, then gray mean and variance features are selected and pattern clustering method is used to realize binary classification. Hu et al. (2010) extracted the local texture and shape features of the image to input into the SVM classifier for training the classification model. Jing & Zang (2010) used sparse self-coding model to extract sub-block features, and designed discriminant analysis algorithm to reduce dimension of features. Bray et al. (2006) proposed an asphalt pavement image segmentation and classification method based on neural network. Density and histogram features can be extracted by the classification method. Cheng (1996) proposed the method which used a series of moment invariants as classification features, and then used neural network as model classifier to classify features. Adarkwa & Attoh-Okine (2013) proposed a method of crack classification based on convolution neural network and principal component analysis. Zhang et al. (2018) proposed a method for detecting and repairing pavement cracks based on T-DCNN. The method based on machine learning and deep learning can effectively utilize prior information and has high detection accuracy. However, due to the need for a large number of sample training, the computational complexity is high.
According to the actual situation of maintenance engineering, the cracks are divided into transverse cracks, longitudinal cracks and reticulated cracks. There are different morphological characteristics for different types of cracks.
Transverse cracks are cracks formed by the shrinkage of asphalt surface. It is mainly caused by low temperature, that is, when the temperature of asphalt pavement surface is lower than its lowest tolerable temperature, the pavement will break. Due to the high temperature expansion effect, transverse cracks are easy to occur in a short time. The causes of longitudinal cracks may be related to the causes of transverse cracks. The direction of longitudinal cracks is the same as the direction of traffic, mostly due to traffic load. Longitudinal cracks are consistent with the direction of traffic. If not dealt with in time, the damage will be greater. Cracks in all directions are interlaced to form a network crack. Network cracks are mostly caused by cold shrinkage and aging of bituminous pavement materials.
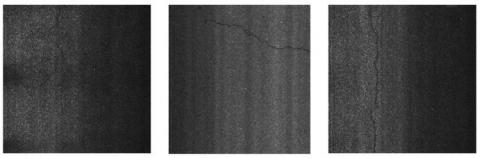
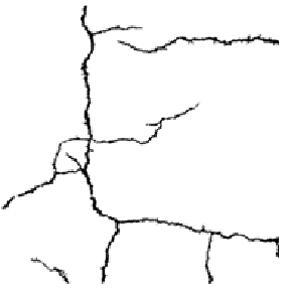
All the images processed in this paper come from high-definition linear array CCD camera. A number of different asphalt pavement crack images images are shown in Figure 1.
Figure 1. Illustration of pavement cracks
Because the asphalt pavement material has grain texture characteristics, the image texture of asphalt pavement is rich, and there are a large number of points of noise, so it is necessary to pre-process the acquired image.
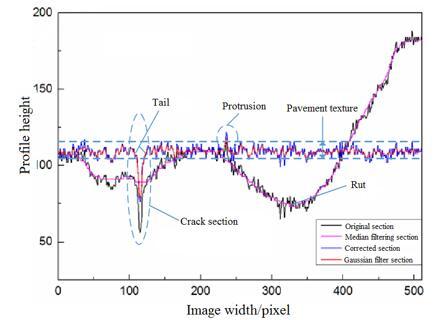
Pavement cross-section image is mainly based on laser band imaging on pavement surface contour and formed by three-dimensional reconstruction. Besides capturing crack contour, contours with obvious height changes such as texture, rutting, road signs, pits or road debris will also be presented in the cross-section image. An example of a pre-processed profile in asphalt pavement cross-section image is shown as Figure 2.
In order to take the speed and accuracy of crack detection into account, three steps including image dimension reduction (Tsai et al., 2012), cross-section correction (Rabah et al., 2013) and smoothing filtering were carried out. The pre-processing results of three dimensional crack images at different stages are shown in Figure 2.
Figure 2. Example of a pre-processed profile in asphalt pavement cross-section image
The texture region of the pre-processed crack image is relatively flat, while the cross-section of the crack presents a significant inverted Gauss curve, which is significantly different from each other. So an automatic detection algorithm based on multi-feature test of crack cross-section is proposed in this paper.
The algorithm consists of three parts: (1) Calculating the inclination of the section to distinguish the protruding section from the suspected crack section and to identify the crack initially, (2) Using the specially designed w-test method to test the Gauss distribution significance of the cross-section and find out the actual crack cross-section, (3) Testing the edge gradient characteristics of the actual crack cross-section to obtain the true crack cross-section consistent with the crack width.
4.1. Inclination characteristic test
After pre-processing, the cross-section image of asphalt pavement crack mainly includes crack section, flat section, stepped section, small inclined section, convex and concave section which belong to texture area. Main profiles of the pre-processed crack pavement images are shown in Figure 3.
Figure 3. Main profiles of the pre-processed crack pavement images
In order to distinguish crack sections from other sections, we need to test the characteristics of inclination designed in this paper. In order to adapt to the change of width, we use normalized index to measure the cross-section gradient. As a measure of the probability of random events, the range of probability is [0,1]. The closer the value is to 1, the greater the probability of events. Obviously, it is reasonable to use the probability as the index to measure the inclination of the section. The test determines whether the section has the characteristics of crack shape by calculating the inclination of the curves on both sides of the section toward its center. The specific calculation process can be defined as follows:
$p_{1}=\frac{n_{1}}{r}, p_{2}=\frac{n_{2}}{r}$
$n_{1}=\operatorname{count}\left(I\left(x_{j-1}\right)-I\left(x_{j}\right) \geq \Delta_{t}\right) \quad j \in[i-r+1, i]$
$n_{2}=\operatorname{count}\left(I\left(x_{j+1}\right)-I\left(x_{j}\right) \geq \Delta_{t}\right) \quad j \in[i, i+r-1]$
where $x_i$ is the center pixel of the cross-section, and the other is the pixels on both sides of the center of the section. I(x) is the height of pixel x, r is the radius of section, count(A) represents the total number of inequalities A in the range of values. $p_1$ and $p_2$ respectively indicates the inclination of both sides of the section under condition $∆_t$. After calculating the inclination on both sides of the section, the section with crack shape characteristics can be detected by setting corresponding threshold.
$S \in C$ if $p \geq p_{t}$
$S=[\mathrm{i}-\mathrm{r}, \mathrm{i}+\mathrm{r}], \mathrm{p}=p_{1} p_{2}$
where S represents the section centered on pixel $x_i$ and r as the radius. C represents a set of cross-sections that satisfy the test of inclination characteristics. p indicates the inclination of section S.
4.2. Gaussian distribution characteristic test
Because the crack section is obviously inverted Gaussian curve, it can be assumed that the crack section is Gaussian distribution, and it can be extracted by judging the significance of the Gaussian distribution of the section. In this paper, w-test (Shapiro & Wilk, 1972) is used to test the significance of Gaussian distribution of cross-section. It can test whether a group of small sample discrete data satisfy the Gaussian distribution. Calculation formula of w-test is defined as follows:
$\mathrm{W}=\frac{\left[\sum_{k=1}^{r} a_{k n}\left(X_{(n-k+1)}-X_{(k)}\right)\right]^{2}}{\sum_{k=1}^{n}\left(X_{(k)}-\overline{X}\right)^{2}}$
where $X_{(1)}, \ldots, X_{(n)}$ represents the order statistics of sample $X_{1}, \ldots X_{n}$, $\overline{X}$ is sample mean, $a_{k n}$ is a constant coefficient.
The basic steps to verify the significance of the Gaussian distribution of the cross-section are as follows:
Step 1: For cross-section S, the height values of n=2r+1 pixels contained in $I\left(X_{i-r}\right) \ldots I\left(X_{i}\right) \ldots I\left(X_{i+r}\right)$ are arranged in $I_{1}(X), I_{2}(X), \ldots, I_{n}(X)$ order from small to large. At the same time, the mean value $\overline{\overline{I}}\left(X_{i}\right)$ is calculated.
Step 2: Through checking the constant coefficient table (Shapiro & Wilk, 1972) of w-test, the value of $a_{k n}$ corresponding to the total number of pixels in this cross-section is found, and the cross-section statistic W(S) is calculated. Because the section of the crack is Gaussian curve which is "on the high side and thin side", and the section of the texture is "on the low side or on the fat side", the section of the crack should be satisfied as follows:
$E \geq \chi n \sigma_{c}$
$E=\sum_{k=1}^{n}\left(I_{(k)}(x)-\overline{I}\left(x_{i}\right)\right)^{2}$
where E is the index of cross-section shape. The smaller E is, the more likely it is that the cross-section belongs to texture region. The larger E is, the more likely it is that the cross-section belongs to crack section. $σ_c$ is the variance of the whole preprocessed image. n represents the total number of pixels in cross-section S. χ is a constant coefficient, its value is related to the roughness of the pavement surface.
Step 3: Gaussian distribution significant judgement
$S \in \overline{\overline{C}}$ if $W(S) \geq W_{t}$
where $\overline{\overline{c}}$ represents a set of crack cross-sections satisfying the Gaussian distribution characteristics test, and it satisfies $\overline{C} \sqsubseteq C . W_{t}$ is a significant threshold for the Gaussian distribution corresponding to the cross section S.
4.3. Edge gradient characteristic test
In addition to the real crack shape, the crack section satisfying Gaussian test also contains a gentle "tail" on both sides, and the "tail" belongs to the texture region, so the crack section width is larger than the real crack width. In practical engineering, width is the key index to evaluate the degree of pavement damage, so it is necessary to test the edge gradient of crack section to reflect the true width of crack. It is generally believed that the crack edge is located at the maximum gradient of crack section.
$\overline{r_{1}}=\left\{i-j | I\left(x_{j-1}\right)-I\left(x_{j}\right)=G_{\max }^{1}\right\} j \in[i-r+1, i]$
$\overline{r_{2}}=\left\{j-i | I\left(x_{j+1}\right)-I\left(x_{j}\right)=G_{\max }^{2}\right\} j \in[i, i+r-1]$
where $G_{\max }^{1}$ and $G_{\max }^{2}$ represents the maximum gradient on both sides of the section, respectively. $\overline{r_{1}}$ and $\overline{r_{2}}$ represents the distance from the center pixel $x_j$ of the section to the maximum gradient on both sides, respectively. The edge of crack is determined by $\overline{r_{1}}$ and $\overline{r_{2}}$. Based on this, we can find out the cross-section after cutting:
$\overline{\overline{S}}=[i-\overline{r_{1}}, i+\overline{r_{2}}]$
where $\overline{\overline{S}}$ represents true crack section after cutting, its pixel width is $\overline{r_{1}}+\overline{r_{2}}=1$, and it satisfies $\overline{\overline{S}} \sqsubseteq S$.
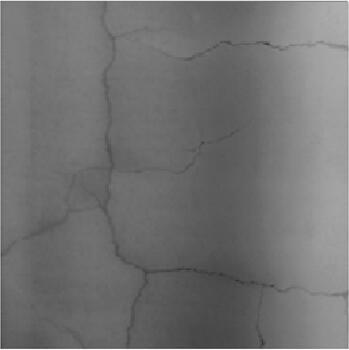
In order to adapt to the change of crack width and complex crack characteristics, the cross-section image is taken as the main research object in this paper. Multi-scale $\mathbf{r} \in[1,10]$ feature of four directions $\beta=0, \pi / 4, \pi / 2,3 \pi / 4$ of the cross-sections were tested. After the fusion and de-noising of the test results, the final crack image is obtained. The original image is shown in Figure 4.
Figure 4. Original image
The specific process of the algorithm is as follows:
Step 1: The original image with resolution of 2048*2048 is dimensionally reduced by 4-pixel*4-pixel sub-block. The 512*512 size image is corrected and filtered, and the preprocessed image is obtained.
Step 2: From left to right, from top to bottom, with each pixel of the image as the center of the cross-section, the inclination feature of the cross-section of the preprocessed image is checked in different directions and scales. In order not to omit the low contrast crack section and reduce the misjudgment of road signs at the same time, we take $\Delta_{t}=1$ and $p_{t}=0.6$. The detection result is shown in Figure 5.
Figure 5. Test results of inclination characteristics
Step 3: Gaussian characteristic test is performed on the section satisfying the above test and the crack section is extracted. χ=2 was obtained through experiments. The detection result is shown in Figure 6.
Figure 6. Test results of Gaussian characteristics
Step 4: Edge gradient cutting is carried out for crack section, the detection result is shown in Figure 7.
Figure 7. Test results of edge gradient characteristics
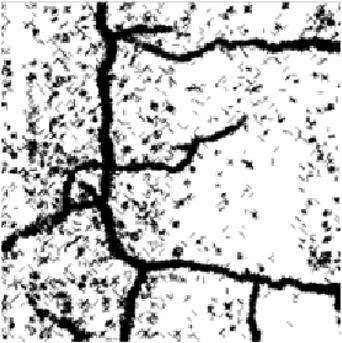
Step 5: Two-value image after crack cross-section fusion and de-noising is shown in Figure 8.
Figure 8. De-noising results
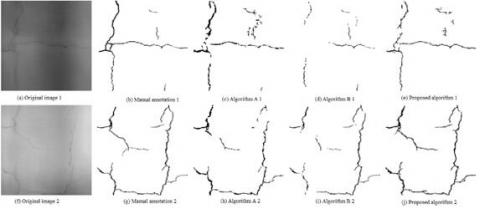
In order to reflect the performance of the proposed algorithm, 180 typical bituminous pavement images with low roughness and high roughness are randomly selected for experiments. Then the proposed algorithm is compared with two existing asphalt pavement crack detection algorithm (Bo, 2014; Zhang et al., 2017). Because different algorithms have different processing methods for crack edges, the width of cracks detected is different, and because of the influence of subjectivity and labeling factors, the artificial labeling cracks are not completely consistent with the real cracks; therefore, in order to ensure the fairness of the algorithm evaluation, we adopted the performance evaluation method considering the position deviation in this paper. Examples of detection results of each algorithm is shown in Figure 9.
Figure 9. Examples of detection results of each algorithm
Comparison results of crack detection using different algorithms are shown in Table 1.
The accuracy rate, recall rate and F value are used to evaluate the three algorithms. Table 1 shows the test results of each algorithm. It can be seen from Table 1, for low roughness pavement, algorithm A can detect 94.44% cracks and make the comprehensive performance reach 89.51%. For high roughness pavement, although 93.34% cracks can be detected, the comprehensive performance is only 65.35%. It shows that the algorithm has better adaptability to low roughness pavement. However, with the increase of road roughness, a large number of rough textures are misjudged as cracks, and the accuracy of the algorithm decreases. For algorithm B, the accuracy of low-roughness pavement and high-roughness pavement is 94.25%, 92.15% and the recall rate is 79.05% and 87.53%, respectively. It shows that the algorithm is less affected by the roughness of pavement and can better adapt to two types of pavement, but there are many cracks missing detection, and the recall rate of the algorithm is low. For the proposed algorithm, the accuracy of low roughness pavement is 94.86%, recall rate is 95.80%, F value can reach 94.39%; the accuracy of high roughness pavement is 86.97%, recall rate is 90.62%, F value is 89.63%, which shows that this algorithm has good adaptability to low roughness pavement. For two types of pavement, the comprehensive performance of the proposed algorithm can reach 92.01%, which is also better than 77.43% of algorithm A and 88.45% of algorithm B. From the above data analysis, it can be seen that the proposed algorithm can detect most of the low contrast cracks missed by other algorithms, at the same time, it can avoid a large number of false detection of rough texture.
Table 1. Comparison results of crack detection using different algorithms
|
Pavement type |
Image number |
Algorithm A |
Algorithm B |
Proposed Algorithm |
||||||
|
precision rate |
recall rate |
F value |
precision rate |
recall rate |
F value |
precision rate |
recall rate |
F value |
||
|
Low roughness |
1-60 |
86.87 |
95.27 |
90.31 |
94.64 |
79.87 |
87.68 |
95.12 |
96.14 |
95.37 |
|
61-120 |
86.12 |
93.92 |
88.87 |
94.32 |
78.82 |
86.92 |
94.78 |
95.52 |
94.58 |
|
|
121-180 |
87.43 |
94.12 |
89.34 |
93.78 |
78.45 |
86.32 |
94.68 |
95.72 |
93.21 |
|
|
1-180 |
86.81 |
94.44 |
89.51 |
94.25 |
79.05 |
86.97 |
94.86 |
95.80 |
94.39 |
|
|
High roughness |
181-240 |
54.32 |
93.56 |
66.78 |
92.69 |
88.12 |
90.32 |
89.23 |
91.98 |
90.45 |
|
241-300 |
46.78 |
94.12 |
63.45 |
92.56 |
87.92 |
90.21 |
88.23 |
90.67 |
90.11 |
|
|
301-360 |
56.81 |
92.34 |
65.83 |
91.21 |
86.54 |
89.23 |
83.45 |
89.22 |
88.32 |
|
|
180-360 |
52.64 |
93.34 |
65.35 |
92.15 |
87.53 |
89.92 |
86.97 |
90.62 |
89.63 |
|
|
Total |
1-360 |
69.73 |
93.89 |
77.43 |
93.20 |
83.29 |
88.45 |
90.92 |
93.21 |
92.01 |
In view of the multi-feature of cracks in cross-section images of asphalt pavement, an automatic crack detection algorithm based on three main feature tests, inclination, Gaussian distribution and edge gradient, is proposed. By testing two kinds of asphalt pavement with different roughness, the accuracy and recall of the proposed algorithm can reach 90.92% and 93.21%, and it has good adaptability to both types of pavement. When the proposed algorithm is applied to practical engineering, the threshold in this paper can be used to automatically detect all crack images, and then the optimized parameter χ can be adjusted according to the feedback of engineers to semi-automatically detect some sections that have misjudged or missed detection. The combination of automatic and semi-automatic method can well meet the engineering requirements.
Adarkwa O. A., Attoh-Okine N. (2013). Pavement crack classification based on tensor factorization. Construction & Building Materials, Vol. 48, No. 11, pp. 853-857. https://doi.org/10.1016/j.conbuildmat.2013.07.091
Ayenu-Prah A., Attoh-Okine N. (2008). Evaluating Pavement Cracks with Bidimensional Empirical Mode Decomposition. Eurasip Journal on Advances in Signal Processing, Vol. 2008, No. 1, pp. 1-7. https://doi.org/10.1155/2008/861701
Bo P. (2014). Automatic Recognition Algorithm for Crack Seeds Based on 1mm Resolution 3DPavement Images. China Journal of Highway & Transport, Vol. 27, No. 12, pp. 23-32.
Bray J., Verma B., Li X., He W. (2006). A Neural Network based Technique for Automatic Classification of Road Cracks International Joint Conference on Neural Networks. IEEE, Vol. 2006, pp. 907-912. https://doi.org/10.1109/IJCNN.2006.246782
Banharnsakun A. (2015). Hybrid ABC-ANN for pavement surface distress detection and classification. International Journal of Machine Learning & Cybernetics, Vol. 8, No. 2, pp. 1-12. https://doi.org/10.1007/s13042-015-0471-1
Cheng H. D. (1996). Automated real-time pavement distress detection using fuzzy logic and neural network. Proceedings of SPIE - The International Society for Optical Engineering, Vol. 2946, No. 1, pp. 140-151. https://doi.org/10.1117/12.259131
Hu Y., Zhao C. X., Wang H. N. (2010). Automatic Pavement Crack Detection Using Texture and Shape Descriptors. Iete Technical Review, Vol. 27, No. 5, pp. 398-405. https://doi.org/10.4103/0256-4602.62225
Jing L., Zang A. (2010). Pavement Crack Distress Detection Based on Image Analysis[C]// International Conference on Machine Vision and Human-Machine Interface. IEEE, Vol. 2010, pp. 576-579. https://doi.org/10.1109/MVHI.2010.10
Nguyen T. S., Avila M., Begot S. (2009). Automatic detection and classification of defect on road pavement using anisotropy measure Signal Processing Conference European. IEEE, Vol. 2012, pp. 617-621.
Oliveira H., Correia P. L. (2013). Automatic Road Crack Detection and Characterization. IEEE Transactions on Intelligent Transportation Systems, Vol. 14, No. 1, pp. 155-168. https://doi.org/10.1109/TITS.2012.2208630
Rabah M., Elhattab A., Fayad A. (2013). Automatic concrete cracks detection and mapping of terrestrial laser scan data. Nriag Journal of Astronomy & Geophysics, Vol. 2, No. 2, pp. 250-255. https://doi.org/10.1016/j.nrjag.2013.12.002
Shapiro S. S., Wilk M. B. (1972). An Analysis of Variance Test for the Exponential Distribution (Complete Samples). Technometrics, Vol. 14, No. 2, pp. 355-370. https://doi.org/10.2307/1267427
Tian S. Q. (2017). Improved electronic image stabilisation based on image Mosaic and Grey Projection, Review of Computer Engineering Studies, Vol. 4, No. 4, pp. 108-112. https://doi.org/10.18280/rces.0400402
Tsai Y., Jiang C., Wang Z. (2012). Pavement Crack Detection Using High-Resolution 3D Line Laser Imaging Technology. Rilem Bookseries, Vol. 4, pp. 169-178. https://doi.org/10.1007/978-94-007-4566-7_17
Wang S., Tang W. (2011). Pavement Crack Segmentation Algorithm Based on Local Optimal Threshold of Cracks Density Distribution. Vol. 6838, pp. 298-302. https://doi.org/10.1007/978-3-642-24728-6_40
Wang X. J., Qin G. F., Zhao H. L. (2010). Pavement crack detection method based on multilevel denoising model. Journal of Computer Applications, Vol. 30, No. 6, pp. 1606-1605.
Ying L., Salari E. (2010). Beamlet Transform-Based Technique for Pavement Crack Detection and Classification. Computer-Aided Civil and Infrastructure Engineering, Vol. 25, No. 8, pp. 572-580. https://doi.org/10.1111/j.1467-8667.2010.00674.x
Yu S. J., Sukumar S. R., Koschan A. F. (2007). 3D reconstruction of road surfaces using an integrated multi-sensory approach. Optics & Lasers in Engineering, Vol. 45, No. 7, pp. 808-818. https://doi.org/10.1016/j.optlaseng.2006.12.007
Zhang K., Cheng H. D., Zhang B. (2018). Unified Approach to Pavement Crack and Sealed Crack Detection Using Preclassification Based on Transfer Learning. Journal of Computing in Civil Engineering, Vol. 32, No. 2, pp. 04018001.
Zhang A., Wang K. C. P., Ai C. (2017). 3D shadow modeling for detection of descended patterns on 3D pavement surface. Journal of Computing in Civil Engineering, Vol. 31, No. 4, pp. 04017019.