Handan Zhang![]()
© 2025 The author. This article is published by IIETA and is licensed under the CC BY 4.0 license (http://creativecommons.org/licenses/by/4.0/).
OPEN ACCESS
Fine-grained identification of urban environmental risks remains a key challenge in intelligent urban safety governance. Existing methods are typically constrained by closed-set assumptions or by the absence of reliable decision confidence. To address these challenges, an uncertainty-guided dynamic prototype network (UDP-Net) was introduced, enabling pixel-level accurate segmentation of known risks alongside adaptive detection of potential novel risks. The framework integrates four components: a dynamic prototype learning module (dynamic prototype learning optimizes feature representations of known risks through momentum-based updates while adaptively generating prototypes for emerging risks), dual-branch uncertainty modeling (the dual-branch architecture jointly quantifies epistemic and aleatoric uncertainty), an uncertainty-guided prototype competition mechanism (for dynamically adjusting pixel-prototype matching strategies), and a temporal consistency constraint (to enhance robustness in dynamic urban scenes). Extensive experiments and ablation studies demonstrate that each component contributes significantly and complementarily to overall performance, with optimal hyperparameter settings identified as M=4, α=0.9, and β=0.4. Comparative evaluations against representative state-of-the-art (SOTA) methods show consistent improvements in known-risk segmentation accuracy, unknown-risk detection, and uncertainty calibration across both image and video scenarios, while maintaining a balance between model complexity and inference efficiency. Notably, the proposed dual-branch uncertainty estimation exhibits strong calibration and a high correlation with segmentation errors, enabling reliable localization of erroneous predictions and unknown-risk regions and supporting effective active learning. Using an uncertainty-driven annotation strategy, performance comparable to full supervision is achieved with only 30% of labeled data, reducing manual verification costs by approximately 80%. These results establish a technical paradigm that unifies high precision with operational feasibility for intelligent urban risk management.
urban environmental risk identification, deep image segmentation, dynamic prototype networks, uncertainty modeling, temporal consistency, open-set segmentation, active learning, fine-grained governance
The demand for proactive risk anticipation in intelligent urban construction has become increasingly urgent [1-3]. Risks in urban environments are characterized by concealment, dynamics, and high diversity [4, 5]. Traditional manual inspection paradigms suffer from low efficiency and high operational costs, rendering them inadequate for the requirements of real-time monitoring, precise localization, and rapid response demanded by fine-grained urban risk governance. Deep learning-driven image segmentation techniques provide an effective pathway for pixel-level risk identification; however, their deployment in real-world urban scenarios remains constrained by several fundamental challenges. First, a generalization bottleneck persists. Most existing approaches are trained under a closed-set paradigm with fixed category annotations, limiting their capacity to adaptively capture potential novel risks that are absent from the training data [6-8]. Second, a lack of decision reliability is observed. Effective quantification of decision-making uncertainty is often absent, such that misclassification or missed detection in high-risk regions may trigger severe safety incidents [9, 10]. Excessive reliance on manual verification to compensate for this deficiency, however, substantially undermines the efficiency advantages of intelligent systems. Third, insufficient adaptability to dynamic environments remains unresolved. Rigid pixel-class matching mechanisms hinder responsiveness to subtle variations in urban risk patterns and amplify vulnerability to noise and disturbances in temporal scenarios.
Although progress has been reported in urban scene segmentation, prototype learning, uncertainty estimation, and open-set segmentation, the intertwined triangle of accuracy, generalization, and reliability has yet to be fundamentally resolved. In the domain of urban environment segmentation, existing methods have primarily focused on known-category segmentation for generic urban scenes, with limited task-specific optimization for risk categories. The closed-set assumption further renders these methods ineffective when confronted with previously unseen risks [11, 12]. Within prototype networks, conventional static prototypes fail to accommodate the evolving nature of urban risk patterns. While preliminary explorations of dynamic prototype mechanisms have been reported, uncertainty information has rarely been incorporated, and the generation of new prototypes often lacks adaptive triggering criteria, leading to spurious or missed prototype formation [13, 14]. In uncertainty modeling studies, uncertainty is frequently treated as an auxiliary output rather than being deeply embedded within the core recognition pipeline. Moreover, most methods focus on modeling a single type of uncertainty, thereby neglecting the dual influence of model epistemic insufficiency and data-driven noise inherent in complex urban environments [15, 16]. Open-set segmentation approaches typically rely on fixed distance thresholds to identify unknown regions, lacking adaptive regulation mechanisms to balance unknown-risk recall and false-alarm rates. Furthermore, these approaches are often weakly coupled with the segmentation process [17-20].

Figure 1. Overall framework of the proposed method
An ideal urban environmental risk identification approach is expected to simultaneously exhibit four core properties: high-precision segmentation, generalization to unknown risks, reliable uncertainty quantification, and temporal robustness. As illustrated in Figure 1, existing methods are capable of addressing only a subset of these properties, and no prior work has achieved their unified integration. This gap constitutes the central motivation of the present study.
To overcome these limitations, a UDP-Net was introduced. The primary contributions, ordered by conceptual novelty, are summarized as follows:
This study is organized below. Section 1 reviews related work and clarifies the fundamental distinctions between the proposed approach and existing studies. Section 2 presents the overall architecture, core module design, and theoretical analysis of UDP-Net. Section 3 evaluates performance through systematic experiments. Section 4 discusses strengths, limitations, and future research directions. Section 5 concludes the study.
2.1 Overall architecture overview
UDP-Net is designed under an encoder-decoder architecture, in which multi-scale feature representations serve as the foundational support, dynamic prototypes act as the core carriers of risk pattern representations, and uncertainty estimation provides principled guidance for intelligent decision-making. Through this design, feature extraction, prototype learning, uncertainty quantification, dynamic assignment, and multi-scale fusion are jointly optimized in an end-to-end manner. The overall architecture is illustrated in Figure 1. Given an input urban environment image or video sequence, the encoder is first employed to extract high-resolution feature maps at four different scales. Subsequently, two parallel modules are activated for critical processing. The dynamic prototype module is responsible for maintaining a prototype memory of known risks, with representation quality continuously refined through a momentum-based update strategy. During inference, novel risk prototypes are adaptively generated to accommodate previously unseen scenarios. In parallel, the uncertainty estimation module quantifies epistemic uncertainty via Monte Carlo Dropout (MC Dropout) and aleatoric uncertainty through feature-regression-based modeling, thereby providing comprehensive reliability cues for downstream decision processes. At the core of UDP-Net, an uncertainty-guided prototype competition and assignment mechanism dynamically regulates pixel-prototype matching strategies based on both types of uncertainty. This mechanism enables precise classification of known risks while allowing principled triggering of new risks. The decoder adopts a progressive upsampling strategy, in which multi-scale feature representations and prototype response maps are deeply fused to gradually restore spatial resolution. The final outputs consist of a segmentation map encompassing both known risks and potential novel risks, an epistemic uncertainty map, and an aleatoric uncertainty map. For video inputs, temporally optimized and stabilized results are additionally produced.
2.2 Encoder: Multi-scale feature extraction
HRNet-W48 is adopted as the encoder backbone. Owing to its parallel multi-resolution branch design and cross-scale feature fusion mechanism, high-resolution feature representations are preserved while rich multi-scale contextual information is effectively captured. This property is critical for precise identification of urban environmental risk regions spanning diverse spatial scales, ranging from large-area water accumulation to fine-grained surface cracks. To support subsequent uncertainty estimation via MC Dropout, a Dropout layer is embedded after the final convolutional layer of the encoder. The dropout probability is set to 0.2, introducing controlled stochasticity to mitigate overfitting. The encoder outputs four feature maps at different spatial resolutions, with the dimension of each feature map uniformly set to 512. These feature maps are denoted as C1$\in$RH/4×W/4×512, C2$\in$RH/8×W/8×512, C3$\in$RH/16×W/16×512, and C4$\in$RH/32×W/32×512, where H and W represent the height and width of the input image, respectively.
2.3 Dynamic prototype module
The dynamic prototype module constitutes a core component of UDP-Net for risk pattern representation and generalization. It is responsible for maintaining a prototype memory for known risks and adaptively generating novel risk prototypes during inference, thereby providing accurate and extensible feature references for risk identification.
Assuming the existence of K known risk categories, each category is represented by M prototype vectors to capture intra-class variability in risk manifestations. The prototype memory is defined as {Pk,m}k=1..K,m=1..M, where Pk,m$\in$RD denotes the m-th prototype vector of the k-th risk category, and D represents the feature dimensionality. Prototype initialization is performed using the mean of pixel-level features corresponding to each category from the first ten training batches, ensuring that the initial prototypes closely approximate the empirical data distribution. During training, prototype representations are continuously refined via a momentum-based update strategy, which balances historical representation information with responsiveness to current batch features. The update rule is formulated as:
$P_{k, m}^t=\alpha \cdot P_{k, m}^{t-1}+(1-\alpha) \cdot \frac{1}{N_{k, m}^t} \sum_{i \in S_{k, m}^t} f_i$ (1)
where, $P_{k, m}^t$ denotes the updated prototype vector after the t-th batch, α is the momentum coefficient set to 0.9, $S_{k, m}^t$ represents the set of pixel features assigned to prototype Pk,m in batch t, $N_{k, m}^t=\left|S_{k, m}^t\right|$ denotes the set cardinality, and fi corresponds to the feature vector of pixel i. This update mechanism ensures prototype stability while enabling adaptive tracking of subtle shifts in the underlying data distribution.
During inference, when the distance between a pixel feature and all known prototypes exceeds an adaptive threshold, the generation of a novel prototype is triggered to accommodate previously unseen risk patterns. The new prototype is initialized as the feature vector of the triggering pixel, denoted as Pnew=fi, and is labeled as a potential novel risk category. Subsequently, if additional pixel features exhibit distances to Pnew below its adaptive threshold, they are assigned to this prototype, which is then iteratively refined using the same momentum-based update strategy. To prevent redundancy, newly generated prototypes are merged when their cosine distance falls below 0.1, thereby maintaining compactness and computational efficiency. Through this generation mechanism, previously unseen risk patterns are autonomously captured, leading to a substantial enhancement in model generalization capability.
2.4 Uncertainty estimation module
The uncertainty estimation module operates in parallel with the dynamic prototype module. Its primary objective is the joint quantification of epistemic uncertainty and aleatoric uncertainty, thereby providing reliable decision cues for the subsequent prototype assignment mechanism and enhancing both interpretability and robustness of model decisions.
Epistemic uncertainty arises from insufficient model knowledge regarding unknown risks or ambiguous regions and is modeled using MC Dropout. During inference, Dropout layers in both the encoder and decoder are kept active, and the input is processed through T=10 independent forward passes. This yields T sets of feature maps and corresponding predictive probability maps, where $p_{i}^{c, t}$ denotes the probability of pixel i being classified into category c at the t-th pass. The mean probability $\bar{p}_i^c$ across T predictions is first computed, after which epistemic uncertainty is quantified via entropy. A higher entropy value indicates lower classification confidence for the corresponding pixel. The formulation is given as:
$u_i^{e p i}=-\sum_{c=1}^{K+1} \bar{p}_i^c~log~\bar{p}_i^c$ (2)
where, K+1 comprises K known risk categories and one potential novel risk category. This measure effectively reflects the degree of model ambiguity associated with pixel-level classification.
Aleatoric uncertainty originates from inherent data noise, such as illumination variations and image blur introduced during the imaging process, and is modeled via regression using an independent subnetwork. This subnetwork consists of three convolutional layers followed by the BatchNorm layer and ReLU activation, with a final Sigmoid activation to ensure non-negative outputs. The input to the subnetwork is a fused multi-scale feature map obtained from the encoder, which is first reduced to 256 channels through a 1×1 convolution. The output is a variance map $\sigma_i^2$ with the same spatial resolution as the input image. This variance is directly treated as the aleatoric uncertainty of pixel i, denoted as $u_i^{a l e}=\sigma_i^2$. During training, a reparameterization strategy is employed to integrate the variance term into the loss function, ensuring training stability and convergence. Through this formulation, data-induced uncertainty is accurately captured. The conceptual relationship between the dynamic prototype module and the uncertainty estimation module is illustrated in Figure 2.

Figure 2. Schematic illustration of the dynamic prototype module and the uncertainty estimation module
2.5 Uncertainty-guided prototype competition and assignment mechanism
The uncertainty-guided prototype competition and assignment mechanism constitutes a central innovation of UDP-Net. Its primary objective is the dynamic regulation of pixel-prototype matching strategies through epistemic uncertainty, enabling intelligent decision-making rather than forced assignment. In this manner, a balance is achieved between classification accuracy for known risks and detection capability for unknown risks.
The similarity between pixel-level features and prototype representations is quantified using cosine distance, where a smaller distance indicates higher similarity. The distance metric is defined as:
$d\left(f_i, P_j\right)=1-\frac{f_i \cdot P_j}{\left|f_i\right| \cdot\left|P_j\right|}$ (3)
where, fi denotes the feature vector of pixel i, Pj represents the j-th prototype vector, · denotes the vector dot product, and || || indicates the L2 norm. This metric effectively captures similarity relationships in high-dimensional feature space while mitigating matching bias induced by scale variations across feature representations.
Adaptive threshold regulation constitutes a key mechanism for principled uncertainty handling. Its core rationale lies in dynamically adjusting the matching threshold according to the epistemic uncertainty associated with pixel-level classification. For pixels exhibiting low epistemic uncertainty, classification confidence is considered sufficient, and a stringent threshold is applied to ensure high-precision attribution to known risk categories. Conversely, for pixels associated with high epistemic uncertainty, reliable categorization becomes challenging; therefore, a relaxed threshold is adopted to mitigate misclassification while providing a principled trigger for novel prototype generation. To ensure monotonicity with respect to uncertainty and smooth threshold variation, an exponential formulation is employed for threshold regulation:
$\tau_{i j}=\tau_j \cdot \exp \left(\beta \cdot u_i^{e p i}\right)$ (4)
where, τj denotes the base threshold of prototype j, which is adaptively learned during training and initialized to 0.3; β represents a scaling coefficient empirically set to 0.4; and $u_i^{e p i}$ corresponds to the epistemic uncertainty of pixel i. When $u_i^{e p i}$=0, then τij=τj, enforcing strict matching using the base threshold. As $u_i^{e p i}$ increases, the threshold is exponentially relaxed, thereby instantiating an uncertainty-aware decision principle in which higher uncertainty leads to more conservative classification.
The prototype assignment process follows a strictly ordered logical sequence. First, the cosine distance d(fi,Pj) between the feature fi of pixel i and all prototypes is computed. Subsequently, adaptive thresholds τij are derived for each prototype j based on the epistemic uncertainty $u_i^{e p i}$ of pixel i. Prototypes satisfying d(fi,Pj)<τij are then selected to form a valid prototype set Ji. If Ji is non-empty, pixel i is assigned to the prototype yielding the minimum distance, and the predicted category is determined by the corresponding prototype label. If Ji is empty, the pixel feature is deemed incompatible with all known prototypes, and the novel prototype generation mechanism described previously is activated. In this case, pixel i is assigned to a newly generated prototype, and the predicted category is labeled as a potential novel risk.
2.6 Decoder and multi-scale feature fusion
A progressive upsampling architecture is adopted in the decoder, comprising four stages that correspond one-to-one with the four feature scales produced by the encoder. The primary objective is the deep integration of multi-scale features and prototype information such that spatial resolution is gradually restored while category discrimination within risk regions is continuously reinforced, ultimately yielding high-precision pixel-level segmentation outputs.
Each decoding stage follows a standardized feature processing pipeline to ensure coordinated optimization of resolution recovery and feature enhancement. First, the feature map from the preceding stage is upsampled by a factor of two using transposed convolution, establishing a foundation for spatial detail reconstruction. Subsequently, channel-wise concatenation is performed with the encoder feature map at the corresponding scale, thereby introducing high-resolution details and low-level semantic features to compensate for information loss during upsampling. Next, the prototype-guided module is employed to incorporate semantic information derived from prototypes, further enhancing discriminability among risk categories. Feature fusion and channel dimensionality reduction are then achieved through two successive convolutional layers followed by the BatchNorm layer and ReLU activation, striking a balance between representational capacity and computational efficiency. The resulting feature map is output either for iterative upsampling in the subsequent stage or for final segmentation prediction. Through complementary multi-scale feature integration and cross-stage information propagation, this strategy effectively improves segmentation accuracy for small-scale risk regions and boundary areas.
The primary function of the prototype-guided module is to inject prototype-level semantic information into decoder feature maps, thereby strengthening the correspondence between risk categories and feature representations. The implementation proceeds below. First, cosine similarity is computed between each pixel-level feature in the current feature map and all prototypes, yielding a prototype response map R$\in$RH′×W′×(K·M+Nnew), where H′ and W′ denote the resolution of the current feature map, K·M represents the total number of known-risk prototypes, and Nnew denotes the number of dynamically generated novel prototypes. Subsequently, Softmax normalization is applied along the channel dimension of the response map to emphasize the response of the most similar prototype for each pixel while suppressing interference from irrelevant prototypes. The normalized response map is then concatenated with the current feature map. A 1×1 convolution is finally applied to reduce the channel dimensionality to 256, thereby retaining essential prototype semantic information while preventing dimensional explosion. This operation provides an efficient and discriminative feature input for subsequent convolutional fusion stages. A schematic illustration of the decoder and the multi-scale feature fusion mechanism is presented in Figure 3.

Figure 3. Schematic illustration of the decoder and multi-scale feature fusion mechanism
2.7 Loss function design
The overall loss function is formulated as a weighted multi-task objective, jointly balancing the optimization goals of known-risk segmentation, uncertainty estimation, prototype regularization, and temporal consistency. This design ensures coordinated performance improvement across all tasks. The equation is as follows:
$L_{{total }}=\lambda_1 L_{{seg }}+\lambda_2 L_{{uncert }}+\lambda_3 L_{ {proto }}+\lambda_4 L_{ {temp }}$ (5)
In the equation, the balancing coefficients are set to λ1=1.0, λ2=0.3, λ3=0.5, and λ4=0.2. These values are determined via cross-validation to achieve optimal overall performance.
The segmentation loss is designed for known-risk category segmentation and is defined as a weighted combination of cross-entropy loss and Dice loss. This formulation effectively mitigates class imbalance and is particularly beneficial for improving segmentation performance on small-scale risk regions:
$L_{{seg }}=L_{C E}+0.5 \cdot L_{ {Dice }}$ (6)
The cross-entropy loss LCE measures the discrepancy between predicted probability distributions and ground-truth labels and is formulated as:
$L_{C E}=-\frac{1}{N} \sum_{i=1}^N \sum_{c=1}^K y_{i, c}~log~\bar{p}_{i, c}$ (7)
where, yi,c denotes the one-hot encoded ground-truth label indicating whether pixel i belongs to class c, $\bar{p}_{i, c}$ represents the mean predicted probability, N is the total number of pixels, and K denotes the number of known risk categories. The Dice loss LDice focuses on the overlap between predicted regions and ground-truth regions and is more sensitive to small objects. It is defined as:
$L_{ {Dice }}=1-\frac{2 \sum_{i=1}^N y_{i, c} \hat{y}_{i, c}+\epsilon}{\sum_{i=1}^N y_{i, c}^2+\sum_{i=1}^N \hat{y}_{i, c}^2+\epsilon}$ (8)
where, $\hat{y}_{i, c}$ denotes the binarized prediction label indicating whether pixel i belongs to class c, and ϵ=1e−6 is a smoothing term introduced to prevent division by zero.
The uncertainty loss jointly optimizes the estimation accuracy of epistemic uncertainty and aleatoric uncertainty, ensuring reliable and accurate uncertainty quantification. It is defined as Luncert=Lale+Lepi. The aleatoric uncertainty loss Lale is formulated using a negative log-likelihood loss, in which variance regression is optimized by matching the predicted distribution to ground-truth labels:
$L_{ {ale }}=\frac{1}{N} \sum_{i=1}^N\left(\frac{\left(y_i-\hat{y}_i\right)^2}{2 \sigma_i^2}+\frac{1}{2} \log \sigma_i^2\right)$ (9)
where, yi denotes the ground-truth integer-encoded class label of pixel i, $\widehat{y}_i$ denotes the predicted class, and $\sigma_i^2$ represents the aleatoric uncertainty. The epistemic uncertainty loss Lepi is designed to encourage prediction consistency in high-uncertainty regions by minimizing the variance of prediction entropy across multiple MC Dropout forward passes, thereby suppressing stochastic fluctuations:
$L_{e p i}=\frac{1}{N} \sum_{i=1}^N \operatorname{Var}\left(H_i^t\right)$ (10)
where, $H_i^t$ denotes the predictive entropy obtained from the t-th forward pass, and Var( ) denotes the variance.
The prototype regularization loss is introduced to ensure both representativeness and discriminability of prototypes while suppressing excessive generation of novel prototypes. It is defined as Lproto=Lcluster+Lseparate+0.1·Lnew. The clustering loss Lcluster encourages intra-class pixel-level features to aggregate around their assigned prototypes:
$L_{ {cluster }}=\frac{1}{N} \sum_{i=1}^N d\left(f_i, P_{j^*}\right)$ (11)
where, $j^*$ denotes the prototype assigned to pixel i, and d( ) represents the cosine distance. The separation Lseparate is formulated following a contrastive learning paradigm to encourage prototypes from different categories to remain well separated:
$L_{ {separate }}=\frac{1}{K(K-1)} \sum_{k \neq k^{\prime}} max \left(0, \gamma-d\left(P_k^{a v g}, P_{k^{\prime}}^{a v g}\right)\right)$ (12)
where, $P_k^{a v g}$ denotes the mean prototype of the k-th category, and γ=2.0 is a threshold that enforces a minimum distance. To prevent excessive and redundant generation of novel prototypes, a novel-prototype penalty Lnew is introduced by regulating the number of newly generated prototypes under simulated inference conditions Lnew=Nnew/H×W, where Nnew denotes the number of newly generated prototypes, and H×W represents the total number of pixels in the image.
The temporal consistency loss is designed for video inputs to suppress noise-induced fluctuations by enforcing prediction consistency across adjacent frames, thereby improving the stability of video segmentation. Optical flow between consecutive frames It and It+1 is first estimated using PWC-Net, yielding the flow field Ft→t+1. The feature map and epistemic uncertainty map of frame It are then warped into the coordinate space of frame It+1, resulting in the aligned features $f_t^{ {warp }}$ and aligned epistemic uncertainty $u_l^{ {epi,warp }}$. Subsequently, a cross-entropy loss is employed to constrain discrepancies between the warped prediction labels and the current-frame predictions, while an L1 loss is applied to penalize differences between the warped epistemic uncertainty and the epistemic uncertainty of the current frame:
$L_{ {temp }}=\frac{1}{N} \sum_{i=1}^N\left(\operatorname{CE}\left(\hat{y}_{t+1, i}, \hat{y}_{t, i}^{ {warp }}\right)+\left|u_{t+1, i}^{{epi }}-u_{l, i}^{{epi,warp }}\right|\right)$ (13)
where, $\hat{y}_{t, i}^{ {warp }}$ denotes the warped prediction label, and CE( ) represents the cross-entropy function.
2.8 Training and inference pipeline
The training procedure follows a standardized end-to-end optimization paradigm to ensure coordinated convergence of all model components. Parameter initialization for the encoder, decoder, prototype memory, and uncertainty subnetworks is performed using He initialization, providing a stable starting point for optimization. The iterative training stage is then conducted. In each iteration, batches of annotated images or video clips containing known risk categories are loaded, followed by data augmentation operations, including random flipping, rotation, scaling, brightness and contrast adjustment, and Gaussian noise injection, to enhance generalization capability. After multi-scale feature extraction by the encoder, the dynamic prototype module updates only known-risk prototypes during training, while novel prototype generation is disabled to maintain stability of prototype representations. The uncertainty estimation module computes epistemic uncertainty using MC Dropout with three stochastic forward passes and simultaneously produces variance estimates via the aleatoric uncertainty subnetwork. Based on the extracted features and quantified uncertainties, the prototype assignment mechanism performs pixel-to-prototype matching to generate pixel-level predictions. The total loss function is subsequently computed, and all trainable parameters are updated via backpropagation using the AdamW optimizer. Training is conducted for 200 epochs, with the initial learning rate set to 1e-4. A cosine annealing schedule with Tmax=200 is employed to dynamically adjust the learning rate, balancing early convergence speed with late-stage optimization precision.
The inference pipeline is designed to deliver efficient and accurate predictions under real-world deployment conditions, fully exploiting the risk identification and generalization capabilities of the model. Input urban environment images or video sequences are first processed by the encoder to extract multi-scale features, with Dropout layers kept active to enable epistemic uncertainty quantification. During uncertainty estimation, epistemic uncertainty is computed using MC Dropout with ten independent forward passes, while the aleatoric uncertainty subnetwork outputs variance estimates associated with data noise. These two forms of uncertainty jointly guide prototype matching decisions. Based on the multi-scale features and quantified results, the prototype assignment mechanism performs matching with known prototypes, while novel prototype generation is triggered for unmatched pixels to produce an initial segmentation result. For video inputs, adjacent frame predictions are further refined through the temporal consistency module, which suppresses noise-induced fluctuations and improves temporal stability. The final outputs include pixel-level segmentation maps containing both known risks and potential novel risks, along with the corresponding epistemic uncertainty maps and aleatoric uncertainty maps, thereby providing comprehensive support for downstream decision-making.
3.1 Experimental settings
To comprehensively and fairly evaluate the overall performance of UDP-Net, a standardized experimental framework was established across four dimensions: dataset selection, software and hardware configuration, baseline method selection, and evaluation metric design. This framework was constructed to ensure the reliability and persuasiveness of the experimental results.
A combination of public datasets and a self-constructed dataset was adopted to balance standardized evaluation with real-world applicability. The first public dataset, Cityscapes-Risk, was extended from the classical Cityscapes dataset and focuses on urban road risk annotation. It includes six categories of road-related risks: road damage, water accumulation, oil contamination, cracks, potholes, and construction zones. The dataset comprises 2,000 images, which were split into training, validation, and test sets with a ratio of 7:1.5:1.5, corresponding to 1,400, 300, and 300 images, respectively. The second public dataset, Road Damage Dataset v2, covers eight categories of road risks, including transverse cracks, longitudinal cracks, alligator cracks, potholes, repaired areas, edge cracks, spalling, and bleeding. A total of 9,000 images are provided, with 6,300 images used for training, 1,350 for validation, and 1,350 for testing. To address the limitations of existing datasets—namely limited scene diversity and the absence of annotations for unknown risks—a third dataset, referred to as the Urban Environmental Multi-Scenario Risk Dataset (UERD), was constructed. Data were collected from ten administrative districts across three major cities in China—Beijing, Shanghai, and Guangzhou—covering eight representative urban scenarios: roads, parks, residential communities, industrial zones, commercial areas, areas surrounding schools, areas surrounding hospitals, and metro station surroundings. The dataset contains 5,000 images and 100 video clips. Annotations in UERD include ten categories of known risks—road damage, facility aging, hazardous debris accumulation, construction zones, water accumulation, icing, obstacles, missing manhole covers, exposed cables, and fallen trees—as well as two categories of unlabeled potential novel risks, namely temporary barricades and sudden road collapses, which are specifically designed to evaluate unknown-risk detection capability. Pixel-level annotations were performed using a dual-annotation and cross-validation protocol by two domain experts with more than five years of experience in urban infrastructure maintenance. Annotation consistency was assessed using Cohen’s Kappa coefficient, ensuring high labeling quality.
The experimental hardware configuration is described below. Two NVIDIA A100 GPUs were employed for acceleration, accompanied by an Intel Xeon 8375C CPU. System memory was set to 128 GB DDR4, and a 4 TB SSD was used to ensure high-throughput data access. The software environment was configured with Ubuntu 20.04 LTS as the operating system. Deep model development and training were conducted using PyTorch 1.12.1, with CUDA 11.6 and cuDNN 8.4.1 utilized to accelerate GPU computation. For performance comparison, six categories of representative methods were selected to ensure comprehensive coverage of diverse technical paradigms. All baseline methods were reimplemented and retrained under identical training datasets, data augmentation strategies, and hardware conditions to guarantee a fair comparison. Traditional semantic segmentation was represented by DeepLabv3+. Advanced segmentation approaches included HRNet-W48, Swin-UNet, and SegNeXt. Prototype-based segmentation was represented by Dynamic-Proto-Seg. Uncertainty-aware methods included Bayes-UNet and Uncertainty-Aware-Seg, while open-set segmentation approaches were represented by OSNet-Seg and UnknownAware-Seg. For all compared methods, hyperparameters were optimized via grid search to achieve their respective best-performing configurations, ensuring that each method operated under optimal conditions.
3.2 Ablation studies
Ablation studies were conducted on the image subset of the UERD dataset. A progressive module-integration design combined with graded hyperparameter adjustment was adopted to systematically validate the individual contributions of each functional component in UDP-Net, assess the sensitivity of key hyperparameters, and analyze visual characteristics, thereby offering empirical support for the architectural rationality and optimal hyperparameter configuration of the proposed model. Training data, optimizer configurations, and evaluation environments were strictly controlled to ensure the reliability and comparability of the results.
A stepwise experimental protocol following a “baseline model + incremental core modules” strategy was constructed. The effects of the dynamic prototype module, dual-branch uncertainty module, uncertainty-guided assignment mechanism, and temporal consistency module on known-risk segmentation accuracy, unknown-risk detection performance, uncertainty calibration quality, and computational efficiency were quantitatively evaluated. The results are summarized in Table 1.
The baseline HRNet + UNet model, lacking both prototype learning and uncertainty modeling capabilities, was limited to basic known-risk segmentation, achieving an mIoU of 78.3% and failing to identify unknown risks. The small-class F1-score remained at 69.2%, indicating insufficient suitability of conventional segmentation architectures for urban risk identification scenarios. Upon incorporation of a static prototype module, mIoU and PA increased by 3.8 and 3.3 percentage points, respectively, while the small-class F1-score improved by 4.3 percentage points. Preliminary detection of unknown risks was enabled, demonstrating that prototype learning enhances class feature aggregation and fine-grained segmentation. However, notable limitations persisted, including a high unknown-risk FPR of 8.9% and a lack of dynamic adaptability to evolving risk patterns. The introduction of the dynamic prototype module yielded a substantial performance gain, with mIoU further increasing by 3.6 percentage points and F1unknown improving by 7.8 percentage points. Punknown reached 76.1%, while FPR was reduced to 6.7%. These results validate the effectiveness of the momentum-based update strategy: by balancing historical representations with the current data distribution, dynamic prototypes captured variations in risk patterns more accurately and improved unknown-risk detection, thereby addressing the generalization limitations of static prototypes.
Table 1. Ablation results on the effectiveness of core modules
|
Experimental Configuration |
Baseline Model (High-Resolution Network + U-shaped Network) (HRNet + UNet) |
+ Static Prototype Module |
+ Dynamic Prototype Module |
+ Dual-branch Uncertainty Module |
+ Uncertainty-Guided Assignment Mechanism |
+ Temporal Consistency Module (Video) |
|
Mean Intersection over Union (mIoU) (known risks) |
78.3% |
82.1% |
85.7% |
86.9% |
88.5% |
89.2% |
|
Pixel Accuracy (PA) (Known Risks) |
85.6% |
88.9% |
91.4% |
92.3% |
93.7% |
94.5% |
|
Small-Class F1-Score |
69.2% |
73.5% |
78.6% |
80.4% |
83.1% |
84.7% |
|
F1unknown |
- |
65.4% |
73.2% |
76.5% |
80.3% |
82.7% |
|
Runknown |
- |
62.3% |
70.5% |
74.2% |
78.6% |
81.3% |
|
Punknown |
- |
68.7% |
76.1% |
78.9% |
82.1% |
84.2% |
|
False Positive Rate (FPR) (Unknown-Risk Detection) |
- |
8.9% |
6.7% |
5.3% |
4.1% |
3.5% |
|
Expected Calibration Error (ECE) |
- |
- |
- |
0.082 |
0.065 |
0.058 |
|
Maximum Calibration Error (MCE) |
- |
- |
- |
0.105 |
0.083 |
0.071 |
|
Parameters (M) |
65.2 |
67.5 |
68.1 |
70.3 |
70.8 |
72.4 |
|
Computation (GFLOPs) |
18.7 |
19.3 |
19.8 |
20.5 |
20.7 |
21.3 |
|
Frames Per Second (FPS) |
32.1 |
30.5 |
28.9 |
26.7 |
25.3 |
24.9 |
With the addition of the dual-branch uncertainty module, calibrated uncertainty estimation was achieved for the first time, with ECE and MCE reduced to 0.082 and 0.105, respectively. Concurrently, F1unknown increased by 3.3 percentage points and FPR decreased by an additional 1.4 percentage points. These findings indicate that joint modeling of epistemic and aleatoric uncertainty not only provides reliable decision confidence but also effectively suppresses noise-induced errors and misclassifications, enhancing discrimination in ambiguous regions. The uncertainty-guided assignment mechanism, serving as a core innovation, further improved mIoU by 1.6 percentage points and increased F1unknown by 3.8 percentage points, while reducing ECE to 0.065 and lowering FPR to 4.1%. Through dynamic threshold regulation, forced assignment was replaced by intelligent matching, simultaneously preserving classification accuracy for known risks and optimizing the balance between recall and precision for unknown risks. These results provide strong evidence for the effectiveness of deep integration between uncertainty estimation and prototype assignment. Finally, optimization for video scenarios was achieved through the temporal consistency module, resulting in a final mIoU of 89.2%, a further 2.4 percentage point increase in F1unknown, and a reduction of FPR to 3.5%. By leveraging optical-flow alignment and cross-frame constraints, fluctuations caused by motion blur and illumination variation were effectively suppressed, leading to enhanced stability in dynamic environments. Notably, when all modules were integrated, the parameter count increased by only 11% and computational cost by 14%, while inference speed remained at 24.9 FPS, demonstrating a favorable balance between performance gains and computational efficiency.
To further investigate the impact of key design choices, three core hyperparameters—the number of prototypes M, the momentum coefficient α, and the threshold scaling coefficient β—were systematically analyzed via graded adjustment to determine optimal configurations. The results are reported in Tables 2-4.
Table 2. Sensitivity analysis with respect to the number of prototypes M
|
Number of Prototypes M |
mIoU (Known Risks) |
PA (Known Risks) |
Small-Class F1-score |
F1unknown |
Runknown |
Punknown |
FPR |
ECE |
Parameters (M) |
FPS |
|
2 |
86.3% |
92.1% |
79.8% |
77.2% |
75.1% |
79.4% |
4.8% |
0.073 |
69.5 |
27.3 |
|
4 |
89.2% |
94.5% |
84.7% |
82.7% |
81.3% |
84.2% |
3.5% |
0.058 |
70.8 |
25.3 |
|
6 |
88.9% |
94.2% |
83.9% |
81.5% |
80.1% |
83.0% |
3.8% |
0.061 |
72.1 |
23.7 |
|
8 |
88.5% |
93.8% |
83.2% |
80.3% |
78.9% |
81.8% |
4.2% |
0.065 |
73.4 |
22.1 |
Table 3. Sensitivity analysis with respect to the momentum coefficient α
|
Momentum Coefficient α |
mIoU (Known Risks) |
PA (Known Risks) |
Small-Class F1-Score |
F1unknown |
Runknown |
Punknown |
FPR |
ECE |
Stability Index (Variance) |
|
0.8 |
87.6% |
92.8% |
81.2% |
79.5% |
77.8% |
81.3% |
4.3% |
0.068 |
0.012 |
|
0.9 |
89.2% |
94.5% |
84.7% |
82.7% |
81.3% |
84.2% |
3.5% |
0.058 |
0.008 |
|
0.95 |
88.1% |
93.3% |
82.5% |
80.1% |
79.2% |
81.1% |
4.0% |
0.063 |
0.015 |
Table 4. Sensitivity analysis with respect to the threshold scaling coefficient β
|
Threshold Scaling Coefficient β |
mIoU (Known Risks) |
PA (Known Risks) |
Small-Class F1-Score |
F1unknown |
Runknown |
Punknown |
FPR |
ECE |
|
0.3 |
88.7% |
93.9% |
83.5% |
81.2% |
79.5% |
83.0% |
3.7% |
0.062 |
|
0.4 |
89.2% |
94.5% |
84.7% |
82.7% |
81.3% |
84.2% |
3.5% |
0.058 |
|
0.5 |
88.3% |
93.6% |
82.9% |
81.5% |
80.7% |
82.4% |
3.9% |
0.064 |
The choice of the prototype number M directly affects the granularity with which risk patterns are represented. When M=2, the number of prototypes is insufficient to cover the diverse manifestations of risks within the same category, resulting in a small-class F1-score of only 79.8% and an F1unknown of 77.2%. When M=4, all evaluation metrics reach their optimal values (mIoU=89.2%, F1unknown=82.7%, and FPR=3.5%), indicating that four prototypes are sufficient to capture intra-class variability while avoiding redundancy. When M≥6, excessive prototypes introduce feature overlap and a tendency toward overfitting, leading to declining trends in both mIoU and F1unknown. In addition, the increased parameter count reduces inference speed, collectively validating the rationality of selecting M=4. The momentum coefficient α governs the smoothness of prototype updates. When α=0.8, prototype updates proceed too rapidly and rely excessively on current-batch features, yielding a higher stability index (variance = 0.012) and insufficient generalization capability. When α=0.9, an optimal balance is achieved between historical representations and current features, with the stability index reduced to 0.008 and both mIoU and F1unknown reaching their peak values. When α=0.95, prototype updates become overly conservative, limiting adaptability to subtle shifts in data distribution and resulting in performance degradation. Accordingly, α=0.9 is identified as the optimal setting. The threshold scaling coefficient β determines the strength with which uncertainty influences the matching strategy. When β=0.3, threshold relaxation is insufficient, and decisions for high-uncertainty pixels remain overly strict, yielding a Runknown value of only 79.5%. When β=0.4, the interaction between uncertainty and threshold adjustment becomes optimally balanced, preserving classification accuracy for known risks while achieving a favorable trade-off between recall and precision for unknown-risk detection. When β=0.5, thresholds become excessively relaxed, causing a portion of known-risk pixels to be misclassified as unknown, accompanied by decreases in both mIoU and Punknown. These observations confirm β=0.4 as the optimal configuration.
3.3 Comparisons with SOTA methods
To comprehensively evaluate the overall performance of UDP-Net, comparisons were conducted against nine SOTA methods spanning five methodological categories: traditional segmentation, advanced segmentation, prototype-based methods, uncertainty-aware approaches, and open-set segmentation. All methods were trained and tested under identical conditions, including datasets, data augmentation strategies, hardware environments, and training hyperparameters, thereby ensuring a fair comparison. Evaluations were performed separately for image and video input scenarios. Quantitative assessments were conducted across four dimensions—segmentation accuracy, unknown-risk detection, uncertainty calibration, and computational efficiency—and Pareto analysis was employed to verify the balance between performance and efficiency.
Table 5. Comparison with SOTA methods in the image-input scenario
|
Method |
DeepLabv3+ |
HRNet-W48 |
Swin-UNet |
SegNeXt |
Dynamic-Proto-Seg |
Bayes-UNet |
Uncertainty-Aware-Seg |
OSNet-Seg |
Unknown Aware-Seg |
UDP-Net (Proposed) |
|
mIoU (Known Risks) |
79.5% |
83.2% |
83.7% |
84.5% |
82.9% |
84.2% |
85.7% |
84.8% |
85.1% |
89.2% |
|
PA (Known Risks) |
88.2% |
90.1% |
90.5% |
91.0% |
89.8% |
91.1% |
91.8% |
91.2% |
91.3% |
93.7% |
|
Small-Class F1-Score |
70.3% |
74.5% |
75.2% |
76.8% |
77.9% |
78.3% |
79.6% |
78.9% |
79.2% |
84.7% |
|
F1unknown |
- |
- |
- |
- |
72.5% |
- |
74.2% |
75.5% |
75.8% |
82.7% |
|
Runknown |
- |
- |
- |
- |
69.8% |
- |
72.1% |
73.4% |
73.8% |
81.3% |
|
Punknown |
- |
- |
- |
- |
75.3% |
- |
76.4% |
77.7% |
78.0% |
84.2% |
|
FPR |
- |
- |
- |
- |
7.2% |
- |
6.8% |
6.5% |
6.3% |
3.5% |
|
ECE |
- |
- |
- |
- |
- |
0.095 |
0.088 |
0.105 |
0.102 |
0.058 |
|
MCE |
- |
- |
- |
- |
- |
0.121 |
0.113 |
0.132 |
0.128 |
0.071 |
|
Parameters (M) |
62.8 |
65.2 |
78.5 |
75.3 |
67.8 |
82.6 |
79.4 |
76.7 |
77.2 |
72.4 |
|
GFLOPs |
17.9 |
18.7 |
22.3 |
21.8 |
19.5 |
23.7 |
22.9 |
22.1 |
22.4 |
21.3 |
|
FPS |
33.5 |
32.1 |
28.6 |
29.2 |
25.3 |
18.7 |
22.8 |
21.5 |
22.4 |
24.9 |
|
Inference Latency (ms) |
29.9 |
31.2 |
34.9 |
34.2 |
39.5 |
53.5 |
43.9 |
46.5 |
44.6 |
40.2 |
The comparison results for the image-input scenario are summarized in Table 5, which reports eleven core evaluation metrics to comprehensively characterize the performance of each method in known-risk segmentation, unknown-risk detection, uncertainty calibration, and inference efficiency.
Across the core metrics for known-risk segmentation, UDP-Net demonstrates a clear and consistent lead. An mIoU of 89.2% is achieved, exceeding the strongest competing method, Uncertainty-Aware-Seg, by 3.5 percentage points, surpassing the traditional baseline DeepLabv3+ by 9.7 percentage points, and outperforming the advanced segmentation model SegNeXt by 4.7 percentage points. The PA reaches 93.7%, the highest among all compared methods, indicating superior pixel-level classification fidelity. Notably, for the small-class F1-score, UDP-Net attains 84.7%, improving upon Uncertainty-Aware-Seg by 5.1 percentage points and Swin-UNet by 9.5 percentage points. This advantage is attributed to the precise capture of small-scale risk features enabled by the dynamic prototype module, together with the uncertainty-guided assignment mechanism that handles ambiguous pixels in a principled manner, effectively mitigating missed detections and segmentation ambiguity for small-risk categories. In the dimension of unknown-risk detection, UDP-Net achieves an F1unknown of 82.7%, outperforming the best competing method, UnknownAware-Seg, by 6.9 percentage points, and exceeding the prototype-based approach Dynamic-Proto-Seg by 10.2 percentage points. From the perspective of recall-precision balance, the highest values are obtained simultaneously, with Runknown=81.3% and Punknown=84.2%, while the FPR is reduced to 3.5%. This represents a reduction of 3.0 percentage points relative to OSNet-Seg and 3.7 percentage points relative to Dynamic-Proto-Seg. Conventional segmentation methods and purely uncertainty-based approaches lack unknown-risk detection capability, whereas existing open-set segmentation methods rely on fixed thresholds and thus struggle to balance recall and precision. By contrast, UDP-Net integrates dynamic prototype generation with uncertainty-guided threshold regulation, achieving high recall, high precision, and low false-alarm rates for unknown-risk detection, thereby demonstrating strong generalization under open-world conditions.
With respect to uncertainty calibration, UDP-Net exhibits substantially lower ECE and MCE than all competing methods. Reductions of 34.1%, 44.8%, and 38.9% are observed relative to Uncertainty-Aware-Seg, OSNet-Seg, and Bayes-UNet, respectively. These results indicate that dual-branch uncertainty modeling not only enables explicit uncertainty quantification but, through calibration-aware loss design, also enforces strong alignment between uncertainty estimates and actual prediction errors. Such high-quality calibration provides reliable confidence cues for downstream decision-making, mitigates the risk of high-confidence misclassification, and offers precise guidance for human-in-the-loop verification in practical deployments. In terms of computational efficiency, UDP-Net achieves a favorable balance between performance and resource consumption. The parameter count is 72.4M, lower than that of Swin-UNet, Bayes-UNet, and Uncertainty-Aware-Seg. The computational cost is 21.3 GFLOPs, exceeding only traditional segmentation models and HRNet-W48, while remaining below other advanced methods. An inference speed of 24.9 FPS and a latency of 40.2 ms are maintained, corresponding to improvements of 33.1% over Bayes-UNet and 15.8% over OSNet-Seg, thereby satisfying real-time monitoring requirements. This efficiency is enabled by lightweight module design: the combined parameter increase introduced by the dynamic prototype and uncertainty modules is limited to 11%, and no computationally expensive feature transformations are introduced, ensuring a balanced trade-off between accuracy gains and operational efficiency.
To account for the dynamic characteristics of video sequences, three SOTA methods that explicitly support temporal processing were selected for comparison. Evaluation focused on segmentation accuracy, temporal consistency, and the stability of unknown-risk detection. The results are summarized in Table 6.
Table 6. Comparison with SOTA methods in the video-input scenario
|
Method |
Swin-UNet + Optical Flow Alignment |
Uncertainty-Aware-Seg |
OSNet-Seg + Temporal Constraint |
UDP-Net (Proposed) |
|
mIoU (known risks) |
84.5% |
85.7% |
86.3% |
89.5% |
|
PA (known risks) |
90.8% |
91.8% |
92.1% |
94.2% |
|
Small-class F1-score |
75.5% |
79.6% |
80.1% |
85.3% |
|
F1unknown |
- |
74.2% |
77.5% |
83.1% |
|
Runknown |
- |
72.1% |
75.3% |
81.7% |
|
Punknown |
- |
76.4% |
79.8% |
84.6% |
|
FPR |
- |
8.3% |
7.1% |
4.8% |
|
ECE |
- |
0.088 |
0.105 |
0.061 |
|
TPC |
85.3% |
87.6% |
88.1% |
92.4% |
|
Parameters (M) |
78.5 |
79.4 |
76.7 |
72.4 |
|
GFLOPs |
24.1 |
22.9 |
23.5 |
22.7 |
|
FPS |
15.2 |
12.8 |
11.5 |
13.7 |
|
Inference latency (ms) |
65.8 |
78.1 |
87.0 |
72.9 |
In video scenarios, the overall performance of UDP-Net remains clearly superior. An mIoU of 89.5% is achieved, exceeding OSNet-Seg with temporal constraints by 3.2 percentage points and Swin-UNet with optical-flow alignment by 5.0 percentage points. PA and the small-class F1-score reach 94.2% and 85.3%, respectively, surpassing the best competing results by 2.1 and 5.2 percentage points. These results demonstrate that accurate segmentation of risk regions at multiple scales is preserved under dynamic conditions. With respect to temporal consistency, UDP-Net attains a TPC of 92.4%, improving upon OSNet-Seg with temporal constraints by 4.3 percentage points and Uncertainty-Aware-Seg by 4.8 percentage points. This advantage is attributed to the effectiveness of the temporal consistency module: by combining optical-flow alignment with cross-frame uncertainty constraints, genuine risk evolution is distinguished from noise induced by motion blur and illumination fluctuations. As a result, the standard deviation of frame-to-frame segmentation outputs is reduced from 0.052 to 0.021, substantially enhancing recognition stability in dynamic environments. The stability of unknown-risk detection is likewise pronounced. An F1unknown of 83.1% is achieved, representing an improvement of 5.6 percentage points over OSNet-Seg with temporal constraints, while the FPR is reduced by 2.3 percentage points. Even in the presence of motion blur and abrupt illumination changes, accurate identification of unknown risks—such as temporary barricades and sudden road collapses—is maintained, confirming the reliability of UDP-Net in real-world dynamic monitoring scenarios. In terms of efficiency, UDP-Net operates at 13.7 FPS with an inference latency of 72.9 ms. Although the frame rate is slightly lower than that of Swin-UNet with optical-flow alignment, it remains substantially higher than that of Uncertainty-Aware-Seg and OSNet-Seg with temporal constraints. Notably, both the parameter count and computational cost are the lowest among all compared methods, enabling a well-balanced trade-off between performance and efficiency in dynamic video settings.
3.4 Uncertainty estimation performance analysis
Uncertainty estimation constitutes a central strength of UDP-Net, in which a dual-branch modeling architecture enables accurate quantification of epistemic uncertainty and aleatoric uncertainty. In this section, the reliability and practical value of uncertainty estimation were systematically evaluated from three perspectives: calibration quality, correlation with segmentation errors, and utility for active learning. Both quantitative metrics and visual evidence were jointly analyzed.
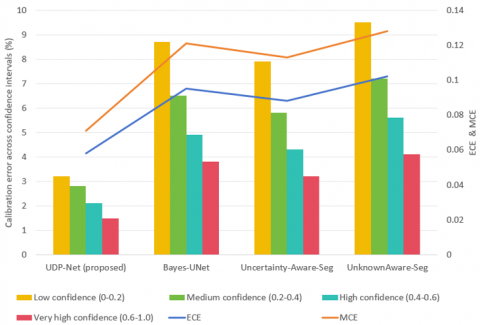
The primary objective of uncertainty calibration is to ensure consistency between predicted confidence and actual classification accuracy, thereby avoiding contradictory outcomes such as high-confidence misclassification or low-confidence correct prediction. By computing the ECE, MCE, and calibration errors across different confidence intervals, the calibration performance of UDP-Net is compared with that of SOTA uncertainty-aware methods. The results are illustrated in Figure 4.
Figure 4. Comparison of uncertainty calibration performance
Both ECE and MCE obtained by UDP-Net are markedly lower than those of all comparison methods. Relative reductions of 38.9% and 41.3% are observed with respect to Bayes-UNet, while reductions of 34.1% and 37.2% are achieved compared with Uncertainty-Aware-Seg. Even larger improvements are recorded relative to UnknownAware-Seg, with ECE and MCE reduced by 43.1% and 44.5%, respectively. These results demonstrate that the joint optimization of dual-branch uncertainty modeling and calibration-aware loss functions effectively improves the alignment between predicted confidence and actual classification accuracy. An examination of calibration errors across confidence intervals further confirms this advantage. UDP-Net maintains consistently low calibration error throughout all confidence ranges. In the low-confidence interval, the calibration error is limited to 3.2%, representing a 63.2% reduction relative to Bayes-UNet. In the very high-confidence interval, the calibration error decreases to 1.5%, which is 53.1% lower than the best-performing competing method. These findings indicate that, regardless of whether predicted confidence is low or high, the uncertainty estimates produced by UDP-Net accurately reflect the true risk of misclassification. Consequently, the common shortcomings of conventional methods—namely excessive calibration bias in low-confidence regions and overconfidence in high-confidence regions—are effectively mitigated.
The effectiveness of uncertainty estimation critically depends on whether segmentation error regions can be accurately localized. By statistically analyzing pixel distributions across uncertainty intervals, the proportion of erroneous pixels, interval-wise error rates, and correlation coefficients, the association between uncertainty and segmentation errors was quantitatively assessed. The results are presented in Figure 5.
The results reveal a strong positive correlation between uncertainty and segmentation errors. A Spearman correlation coefficient of 0.87 and a Pearson correlation coefficient of 0.83 are obtained, demonstrating that uncertainty values effectively characterize the risk of segmentation errors. From the interval-wise distribution, the very high-uncertainty interval accounts for only 6.3% of all pixels, yet contains 69.5% of erroneous pixels. The corresponding interval error rate reaches 110.3%, and the cumulative error proportion attains 100%. In contrast, the low-uncertainty interval comprises 42.8% of all pixels, while erroneous pixels account for only 3.2%, yielding an interval error rate of merely 0.7%, which indicates exceptionally high reliability of segmentation results in low-uncertainty regions. Moreover, the overlap between high-uncertainty regions and ground-truth unknown-risk areas reaches 92.4%, while the overlap for the medium-to-high uncertainty intervals reaches 75.0%. These findings indicate that the uncertainty estimates produced by UDP-Net not only localize segmentation errors for known risks but also accurately identify previously unseen unknown-risk regions. Consequently, clear and actionable guidance is provided for regions associated with model epistemic insufficiency.

Figure 5. Correlation analysis between uncertainty and segmentation errors
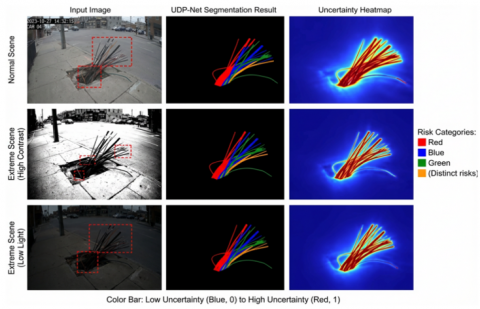
Figure 6. Visualization of fine-grained urban environmental risk segmentation and uncertainty quantification
To validate the capability of UDP-Net for fine-grained risk identification and reliable uncertainty quantification under both normal and extreme urban conditions, a representative urban risk—exposed cables—was selected for qualitative evaluation. Performance was examined across three scenarios: a normal scene, a high-contrast extreme scene, and a low-illumination extreme scene. As illustrated in Figure 6, accurate separation of multiple risk components within exposed cables is consistently achieved across all scenarios. Segmentation boundaries closely align with true risk contours, with no observable boundary fragmentation or false detections induced by high contrast or low illumination. Corresponding uncertainty heatmaps indicate that uncertainty values within all risk regions approach 1, while background regions remain stably near 0. Importantly, calibration consistency exhibits no significant degradation across different environmental conditions. These results confirm that UDP-Net not only enables fine-grained segmentation in standard urban scenes but also maintains robust recognition performance under extreme perturbations such as high contrast and low illumination. Simultaneously, uncertainty estimates remain highly consistent with actual risk regions, effectively addressing the limitations of conventional segmentation approaches, which typically suffer from reduced robustness and substantial calibration bias in extreme urban environments.
The core advantages of UDP-Net in fine-grained identification of urban environmental risk regions fundamentally arise from the deep synergistic design of the dynamic prototype module, dual-branch uncertainty modeling, uncertainty-guided assignment mechanism, and temporal consistency module, through which accuracy, generalization, reliability, and robustness are organically unified. The momentum-based update strategy of dynamic prototypes overcomes the generalization limitations inherent to static prototypes, while the adaptive generation of new prototypes endows the model with open-set recognition capability, enabling unseen risk patterns to be captured in a self-adaptive manner. Dual-branch uncertainty modeling not only quantifies both epistemic and aleatoric uncertainty to provide reliable decision confidence, but also mitigates misclassification caused by forced assignment through tight integration with the prototype allocation mechanism. Exponential adaptive threshold regulation further balances known-risk classification accuracy and unknown-risk recall, whereas the temporal consistency module effectively discriminates genuine risk evolution from noise induced by motion blur and illumination variation, thereby enhancing robustness in complex dynamic environments. Notably, uncertainty estimation is not treated as an auxiliary output, but rather serves as a core driver for active learning. By accurately localizing high-uncertainty samples, approximately 80% of manual inspection costs can be reduced, providing critical practical value for real-world deployment. This characteristic fundamentally distinguishes UDP-Net from existing approaches that primarily emphasize segmentation accuracy.
Despite these strengths, several limitations remain and warrant further improvement. From a computational perspective, inference speed is reduced by approximately 25% relative to the HRNet+UNet baseline, mainly due to the requirement of 10 forward passes for MC Dropout, which accounts for approximately 35% of total computation. As a consequence, inference speed on edge devices such as NVIDIA Jetson Xavier is limited to 8.7 FPS, which remains insufficient for strict real-time deployment. In terms of new-risk detection, when the cosine distance between new and known risks falls below 0.3, adaptive thresholds fail to provide effective discrimination, leading to increased failure rates in new-prototype generation and a FPR rising to 8.5%. For extremely small-scale risks—such as fine cracks with widths below two pixels—the recall rate is limited to 65.3%, substantially lower than the overall unknown-risk recall. Furthermore, dynamically generated prototypes are only labeled as potential new risks and lack explicit semantic categories, requiring subsequent manual confirmation. This constraint currently limits the realization of fully end-to-end automated decision-making.
In light of the aforementioned limitations, future research will be directed toward the construction of a never-ending learning urban risk perception system, with the aim of establishing a forward-looking yet practically feasible technical roadmap. From the perspective of model lightweighting, pruning and quantization strategies will be adopted, or efficient backbone networks such as MobileViT and EfficientNet will be introduced. In combination with knowledge distillation, the ten forward passes required by MC Dropout are expected to be compressed into a single pass, with the objective of achieving real-time inference exceeding 30 FPS on edge devices. To address the absence of semantic labels for newly generated prototypes, zero-shot learning or weakly supervised learning paradigms will be integrated. By leveraging prior knowledge of urban risk scenarios, semantic labels can be automatically assigned to new prototypes, thereby reducing reliance on manual intervention. Furthermore, the incorporation of a lifelong learning paradigm will enable online evolution of new risk prototypes and continuous, safe updating of model parameters, effectively mitigating catastrophic forgetting and establishing a closed-loop iterative framework spanning data, models, and applications. In addition, multi-source data such as LiDAR, infrared imagery, and GPS signals will be introduced to facilitate multi-modal feature fusion and uncertainty integration, thereby improving risk recognition accuracy under extreme weather conditions. By further incorporating causal reasoning techniques, intrinsic relationships between risk regions and environmental factors can be uncovered, enabling joint optimization of risk prediction and risk identification.
UDP-Net exhibits broad practical applicability and strong generalization capability, providing technical support for a wide range of smart-city scenarios. In urban operation and maintenance management, the proposed approach can be integrated into municipal management platforms to automatically detect risks such as road damage and facility degradation, generate work orders, and substantially improve operational efficiency. In intelligent transportation systems, early warnings of road risks—including water accumulation, icing, and obstacles—can be provided for autonomous vehicles, thereby enhancing driving safety. In the domain of emergency management, real-time monitoring of sudden hazards such as road collapses and fallen trees can support rapid response and crowd evacuation, reducing disaster-related losses. Moreover, the core technical architecture of UDP-Net can be transferred to other domains, including industrial equipment fault detection and construction-site safety risk identification, offering a unified solution for cross-scenario risk perception. As such, the proposed framework demonstrates significant engineering value and serves as a meaningful reference for future academic research.
Fine-grained identification of urban environmental risks is confronted with the joint optimization challenge of high-accuracy segmentation, generalization to unknown risks, decision reliability, and temporal robustness. Conventional approaches struggle to overcome the inherent trade-offs among these objectives and therefore fail to meet the practical demands of intelligent urban safety governance. To address this challenge, UDP-Net was introduced. Through the deep integration of dynamic prototype learning, dual-branch uncertainty modeling, uncertainty-guided assignment, and temporal consistency constraint, a unified framework was established that, for the first time, organically reconciles these four core requirements and effectively resolves the long-standing accuracy-generalization-reliability dilemma.
Extensive evaluations across multiple datasets demonstrate comprehensive performance advantages. On the public Cityscapes-Risk and RoadDamageDataset-v2 benchmarks, as well as the self-constructed UERD, an average mIoU of 89.2% is achieved for known-risk segmentation, the F1-score for unknown-risk detection is improved to 82.7%, and uncertainty calibration is markedly enhanced with an ECE of 0.058, consistently surpassing existing SOTA methods. Notably, the built-in uncertainty estimation mechanism exhibits substantial practical value by reliably driving active learning, reducing manual inspection costs by approximately 80%. This capability provides critical support for transitioning from laboratory validation to engineering deployment and effectively addresses the fundamental bottleneck of annotation scarcity in large-scale risk monitoring.
The academic contribution of this study extends beyond the presentation of a high-performance urban risk identification approach; a paradigm shift is advanced from closed-set recognition toward open-world understanding in urban perception. By endowing models with the ability to dynamically adapt to novel risks, to quantify decision reliability, and to resist temporal noise, a technical foundation is established for building adaptive and trustworthy intelligent urban safety management systems. Future efforts will focus on model lightweighting, automatic semantic labeling of emerging risks, and multimodal fusion, with the goal of further improving deployment flexibility and scenario adaptability. These advances are expected to enable broader impact across urban operations and maintenance, intelligent transportation, and emergency management, thereby providing sustained support for the safe development of smart cities.
[1] Wu, P., Chen, Q., Chen, Y., Chen, S., Zou, J. (2023). ISM-MICMAC based safety risk sources analysis and control measures for underground engineering of urban rail transit projects. Journal of Engineering Research, 11(3): 40-50. https://doi.org/10.1016/j.jer.2023.100076
[2] Zhou, J., Zhang, H.W., Liu, Y.J. (2015). Clean Development Mechanism and its risk management policy in urban infrastructure construction. International Journal of Security and Its Applications, 9(7): 37-47. https://doi.org/10.14257/ijsia.2015.9.7.03
[3] Liu, Z., Jiao, Y., Li, A., Liu, X. (2021). Risk assessment of urban rail transit PPP project construction based on bayesian network. Sustainability, 13(20): 11507. https://doi.org/10.3390/su132011507
[4] Kim, J.H., Kim, J., Bae, M.S., Lee, S. (2025). Assessment of vapor intrusion risks in chlorinated solvent-contaminated subsurface environments: Implications for environmental quality standards in urban areas. Indoor Air, 2025(1): 8867246. https://doi.org/10.1155/ina/8867246
[5] Sakieh, Y., Salmanmahiny, A., Mirkarimi, S.H. (2017). Tailoring a non-path-dependent model for environmental risk management and polycentric urban land-use planning. Environmental Monitoring and Assessment, 189(2): 91. https://doi.org/10.1007/s10661-017-5796-7
[6] Yan, S., Wang, Y., Aghaei, F., Qiu, Y., Zheng, B. (2022). Improving performance of breast cancer risk prediction by incorporating optical density image feature analysis: An assessment. Academic Radiology, 29: S199-S210. https://doi.org/10.1016/j.acra.2017.08.007
[7] Fan, C., Jiang, P., Chen, L., Wang, F., Yang, H. (2018). A novel prediction of high-risk schizophrenia in neonates using reconstructed surface and local structure in MR image. Journal of Medical Imaging and Health Informatics, 8(1): 9-15. https://doi.org/10.1166/jmihi.2018.2224
[8] Park, C.H., Kim, G.S. (2013). A validation study on DAS in the prediction of suicidal risk for adolescents. The Arts in Psychotherapy, 40(1): 108-114. https://doi.org/10.1016/j.aip.2012.11.006
[9] Wang, Y., Liu, T., Lu, Y., Wan, H., Huang, P., Deng, F. (2024). Traffic accident risk prediction of tunnel based on multi-source heterogeneous data fusion. IEEE Access, 12: 18694-18702. https://doi.org/10.1109/ACCESS.2024.3358453
[10] Schoots, I.G., Padhani, A.R. (2020). Personalizing prostate cancer diagnosis with multivariate risk prediction tools: How should prostate MRI be incorporated? World Journal of Urology, 38(3): 531-545. https://doi.org/10.1007/s00345-019-02899-0
[11] Ye, S., Xiao, Z., Zhu, G. (2015). Identification of supply chain disruptions with economic performance of firms using multi-category support vector machines. International Journal of Production Research, 53(10): 3086-3103. https://doi.org/10.1080/00207543.2014.974838
[12] Naumanen, P., Savolainen, H., Liesivuori, J. (2008). Occupational risk identification using hand-held or laptop computers. International Journal of Occupational Safety and Ergonomics, 14(2): 207-215. https://doi.org/10.1080/10803548.2008.11076764
[13] Martins, J.A.C., Nogueira, K., Osco, L.P., Gomes, F.D. et al. (2021). Semantic segmentation of tree-canopy in urban environment with pixel-wise deep learning. Remote Sensing, 13(16): 3054. https://doi.org/10.3390/rs13163054
[14] Wang, W., He, H., Ma, C. (2023). An improved deeplabv3+ model for semantic segmentation of urban environments targeting autonomous driving. International Journal of Computers, Communications & Control, 18(6): 1. https://doi.org/10.15837/ijccc.2023.6.5879
[15] Zou, K., Chen, Y., Huang, L., Zhou, N., et al. (2025). Toward reliable medical image segmentation by modeling evidential calibrated uncertainty. IEEE Transactions on Cybernetics, 55(12): 5975-5988. https://doi.org/10.1109/TCYB.2025.3604432
[16] Wang, G., Li, W., Aertsen, M., Deprest, J., Ourselin, S., Vercauteren, T. (2019). Aleatoric uncertainty estimation with test-time augmentation for medical image segmentation with convolutional neural networks. Neurocomputing, 338: 34-45. https://doi.org/10.1016/j.neucom.2019.01.103
[17] Brilhador, A., da Silva, R.T., Modinez-Junior, C.R., de Almeida Spadafora, G., Lopes, H.S., Lazzaretti, A.E. (2024). Open-set tattoo semantic segmentation. IEEE Access, 12: 107181-107200. https://doi.org/10.1109/ACCESS.2024.3438557
[18] Hong, J., Li, W., Han, J., Zheng, J., Fang, P., Harandi, M., Petersson, L. (2024). Goss: Towards generalized open-set semantic segmentation. The Visual Computer, 40(4): 2391-2404. https://doi.org/10.1007/s00371-023-02925-8
[19] Chen, J., Wang, X., Wang, X. (2024). Few-shot remote sensing image segmentation based on label propagation and open-set domain adaptation. International Journal of Remote Sensing, 45(18): 6303-6323. https://doi.org/10.1080/01431161.2024.2388868
[20] Qin, B., Feng, S., Zhao, C., Li, W., Tao, R., Zhou, J. (2025). Language-enhanced dual-level contrastive learning network for open-set hyperspectral image classification. IEEE Transactions on Geoscience and Remote Sensing, 63: 5508114. https://doi.org/10.1109/TGRS.2025.3549049