Yu Liu*![]() | Wei Cao
| Wei Cao![]()
© 2025 The authors. This article is published by IIETA and is licensed under the CC BY 4.0 license (http://creativecommons.org/licenses/by/4.0/).
OPEN ACCESS
With the widespread use of multimodal learning resources, traditional text-based English reading comprehension assessment mechanisms struggle to effectively measure students' understanding of complex semantic relationships between images and text. At the same time, how to leverage students' response data for precise ability diagnosis, thus enabling personalized assessments, has become a key challenge in the field of intelligent education. Current deep learning-based image-text matching methods primarily focus on global semantic alignment, neglecting the crucial fine-grained region-to-word correspondences that are essential for reading comprehension assessment. Additionally, they lack an effective framework for mapping model outputs to specific cognitive ability dimensions. To address these shortcomings, this paper proposes a personalized assessment mechanism that combines image processing with visual-semantic relationship mining. The study consists of two main parts: first, a fine-grained image-text matching method for inferring students' understanding of image-text relationships. This method integrates global visual-semantic reasoning based on graph convolution networks with a local cross-modal attention mechanism, constructing a hierarchical matching model that can accurately infer the image-text associations established by students from their textual responses. Second, a personalized English reading comprehension assessment mechanism is designed. By constructing a cognitive diagnostic model, the inferred image-text relationship patterns are quantified and mapped to fine-grained ability dimensions such as "main idea integration," "detail correspondence," and "relationship reasoning," ultimately generating interpretable personalized assessment reports. The primary innovations of this paper are: 1) the introduction of a fine-grained image-text matching model that integrates both global and local information, enabling deep simulation of students' image-text comprehension processes; 2) the establishment of a systematic method for transforming technical model outputs into educational assessment parameters, facilitating a paradigm shift from "answer grading" to "ability diagnosis," and providing scientific support and technological foundation for truly personalized reading instruction interventions.
image-text relationship understanding, fine-grained image-text matching, reading comprehension ability assessment, personalized assessment, visual-semantic reasoning, cognitive diagnostic model
With the rapid development of information technology [1, 2] and the accelerated process of educational digitization [3, 4], multimodal learning environments [5-7] have become an important part of modern education. In the field of English reading comprehension [8, 9], traditional pure text-based assessment methods [10-12] can no longer meet today's educational needs, as learners increasingly face complex reading materials that combine both text and images. This shift poses new challenges for assessing reading comprehension ability: how to accurately measure the learner's understanding of the complex semantic relationships between images and text, and how to provide personalized ability diagnosis based on this understanding. At the same time, breakthroughs in computer vision [13] and natural language processing [14], particularly the maturity of cross-modal understanding technology [15], have provided the technological possibilities for constructing a new assessment system, making it possible to simulate human cognitive processes through computational models and deeply analyze learners' image-text understanding mechanisms.
Conducting research on English reading comprehension assessment based on image processing and visual-semantic relationship mining holds significant theoretical and practical value. From an educational perspective, this research will drive the shift in assessment paradigms from single-text understanding to multimodal comprehensive cognitive ability assessment, helping to establish a more comprehensive and scientific reading ability evaluation system. From a technical perspective, this research promotes the deep integration of computer vision, natural language processing, and educational assessment, offering innovative technological solutions for smart education. More importantly, this research lays the foundation for achieving truly personalized education by accurately diagnosing each learner's strengths and weaknesses in the image-text understanding process, providing scientific evidence for subsequent personalized teaching interventions.
However, existing related research methods have obvious limitations. On the technical level, the bottom-up attention mechanism proposed in the study [16] can effectively extract salient regions in images but lacks in-depth exploration of the semantic relationships between regions; the visual-semantic embedding method proposed in the study [17] mainly focuses on global alignment and overlooks fine-grained region-to-word correspondences. On the educational application level, existing methods [18, 19] mostly stay at the stage of calculating image-text matching degrees, failing to effectively transform technical indicators into educational assessment parameters, and lack an effective framework to map model outputs to specific cognitive ability dimensions. More importantly, current research generally ignores the value of student response data and has not established a complete reasoning chain to infer their cognitive process from their responses, making these methods difficult to achieve precise ability diagnosis in practical educational settings [20, 21].
In response to the above shortcomings, this paper focuses on two core aspects: first, proposing a fine-grained image-text matching method for inferring students' image-text relationship understanding, by constructing a multi-level matching architecture that includes both global alignment and local correspondences, thus enabling the inference of the image-text relationships students establish from their responses; second, establishing a personalized English reading comprehension assessment mechanism, by mapping the mined image-text relationships to specific ability dimensions through a cognitive diagnostic model, generating personalized assessment reports with teaching guidance value. The main value of this research lies in constructing a complete technological-educational integration framework, which not only promotes the innovative application of cross-modal understanding technology in education but also provides a feasible solution for achieving precise, personalized reading ability assessment, having significant implications for promoting educational equity and improving teaching quality.
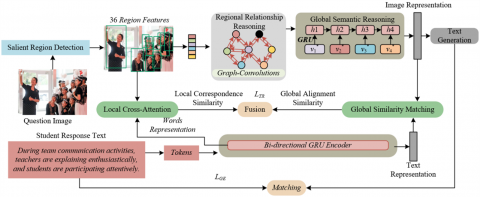
The proposed fine-grained image-text matching method for inferring students' image-text relationship understanding is based on the idea of overcoming the limitations of traditional global alignment by constructing a hierarchical visual-semantic reasoning framework to simulate and evaluate the cognitive process of establishing image-text associations during reading comprehension. This method first extracts semantically significant regional features through an attention mechanism-based image representation module, simulating the students' ability to selectively attend to key image information. Then, a global alignment module based on visual-semantic reasoning is employed to capture the overall semantic correlation between images and text, corresponding to students' macro understanding ability in grasping the main idea of the image-text pairing. More importantly, an innovative adaptive alignment module based on local cross-modal attention mechanisms is introduced. This module calculates bidirectional soft alignment between image regions and text words, precisely modeling fine-grained semantic correspondences, thereby diagnosing students' ability to construct associations at the micro level, such as word-object, attribute-feature relationships. This ability is directly related to their deep comprehension of textual reference, implicit reasoning, and other aspects. Finally, a cross-modal similarity fusion strategy integrates both global and local alignment signals to generate a matching score that reflects the depth of students' image-text relationship understanding. This score will be used as a key feature input into the personalized assessment model, quantifying their performance across multiple cognitive skills, thus providing interpretable and fine-grained data support for achieving precise English reading comprehension ability diagnosis. A diagram of the method principle is shown in Figure 1.
Figure 1. Principle of fine-grained image-text matching method for inferring students' image-text relationship understanding
2.1 Fine-grained image-text matching method for inferring students' image-text relationship understanding
2.1.1 Image representation
In the proposed fine-grained image-text matching method, the attention mechanism-based image representation forms the visual perception foundation of the entire evaluation system. This study uses a bottom-up attention mechanism, combining a Faster Region-based Convolutional Neural Network (R-CNN) object detector with a ResNet-101 backbone network, to extract 36 semantically significant regional features, denoted as N={n1…nj}, from each input image. This choice of technology has profound cognitive simulation value: just as students instinctively focus on key objects and significant regions in an image during reading comprehension, this detection mechanism generates candidate regions through the Region Proposal Network (RPN) and filters them based on an IoU threshold of 0.7 and a category detection probability of 0.3. The 36 regions with the highest confidence are ultimately retained.
At the feature processing level, each selected region is first converted into a 2048-dimensional feature vector via mean pooling, then projected into a unified D-dimensional semantic space through a fully connected layer. The transformation formula is as follows:
$n_u=Q_u d_u+y_u$ (1)
This hierarchical feature learning process ensures the richness and discriminative power of the image representation: it not only preserves the original visual information but also abstracts it into higher-level semantics via deep learning networks, encoding the discrete region features into semantic vectors suitable for cross-modal matching. Notably, the pretraining of this detector on the VisualGenome dataset enables it to recognize a wide range of instance categories and attributes. When an image contains multiple semantic entities, this fine-grained regional representation can accurately capture the various visual cues that students may focus on, thus supporting the precise diagnosis of students' micro-level understanding abilities such as word-object correspondence and attribute-feature recognition.
2.1.2 Global alignment module
The fundamental reason for setting up the global alignment module in the proposed model is to simulate the cognitive process of students comprehensively understanding the image-text materials at the macro level and grasping the main idea. This is achieved by constructing a shared semantic space and performing high-order semantic alignment between the globally represented image and the globally represented text after deep relationship reasoning. For the image modality, on the basis of extracting salient region features, a graph convolutional network (GCN) is innovatively used to infer the potential semantic relationships between regions, constructing a structured visual scene. Then, a gated recurrent unit (GRU) network is applied in a sequential fusion manner to generate an image representation IG containing global semantic relationships, simulating the cognitive process of students integrating discrete visual information to form a coherent visual context. For the text modality, a bidirectional GRU network is employed to encode the bidirectional contextual semantics of the text, obtaining a global feature representation that comprehensively reflects the main idea of the text. Finally, the deep representations of both modalities are projected into the same semantic space, and their matching degree is calculated.
Specifically, the basic principle of region relationship inference is to break through the superficial perception of isolated image regions and instead simulate the deep relationship reasoning ability that humans rely on when understanding complex visual scenes. Specifically, the method first constructs a fully connected visual relationship graph $H=(N,R)$ from the $J$ region features extracted by the bottom-up attention mechanism, where each node represents a salient region, and each edge quantifies the semantic dependency strength between nodes through an affinity matrix $E$. The construction of this graph structure essentially reproduces the cognitive integration process of students when observing images—students do not isolate the recognition of "boy," "football," and "grass," but spontaneously establish semantic relations such as "the boy is playing football on the grass" in their minds. The affinity matrix $E$ is calculated by mapping pairs of nodes into a common embedding space, ensuring the semantic validity of the relationship measurement and providing a structured data foundation for subsequent deep reasoning. Assuming the two embeddings in the common embedding space are denoted as $Q_x \cdot n_u$ and $Q_y \cdot n_k$, the affinity matrix $E$ expression is as follows:
$E\left(n_u, n_k\right)=\left(Q_x \cdot n_u\right)^T\left(Q_y \cdot n_k\right)$ (2)
On the basis of constructing the fully connected relationship graph, the model uses a three-layer graph convolution network with residual connections for iterative relationship reasoning. The GCN’s message-passing mechanism allows each node's feature to be dynamically updated based on its neighboring nodes' semantic relationships, capturing multi-hop dependency relationships through multi-layer propagation. This process aligns well with students' cognitive pattern of continuous reasoning in reading comprehension: when handling complex image-text materials, advanced understanding often requires linking multiple visual concepts. Adding residual connections not only alleviates the vanishing gradient problem in deep GCNs but also ensures that the model retains the discriminative information of the original region features while advancing relationship reasoning, achieving a balanced fusion of low-level visual features and high-level semantic relationships. Assuming the weight parameter matrix of the GCN layer is denoted as $Q_h$ and the weight matrix of the residual structure is denoted as $Q_e$, the specific reasoning formula is given as:
$N^*=Q_e\left(E N Q_h\right)+N$ (3)
The relationship-enhanced features $N^*=\left\{n_1^* \ldots n_j^*\right\}$ output after GCN reasoning have been transformed from the initial discrete region representations into structured representations containing rich contextual semantics. These relationship-enhanced features are crucial for achieving accurate personalized assessments: in the subsequent global alignment stage, when these features are matched with the global text representations in the shared semantic space, the system can effectively distinguish whether the student has performed deep relationship reasoning or has only stayed at the superficial feature matching level. If a student struggles to understand a text that depends on complex visual relationships, the model can precisely pinpoint the cognitive weaknesses by analyzing the matching differences between the student's responses and the relationship-enhanced features.
Correspondingly, the global semantic reasoning module plays the key role of integrating the relationship-enhanced local region features into a coherent overall image semantics. The basic principle of this module is to simulate the serial, hierarchical cognitive processing strategy that humans adopt when understanding complex visual scenes: first focusing on the most salient core elements, and then gradually reasoning out more subtle semantic content based on the already constructed context. Specifically, the model sorts the relationship-enhanced features $N^*=\left\{n_1^* \ldots n_j^*\right\}$ output by the GCN in descending order according to region detection confidence, thereby setting the input sequence order for the GRU network. This priority design accurately reproduces the typical attention allocation pattern of students when processing image-text materials: Their attention is first drawn to the most prominent and easily recognizable objects in the image, and then gradually expands to secondary elements related to them, ultimately forming a complete and logically coherent visual context in their minds.
At the technical implementation level, the GRU network's sequential processing mechanism provides an ideal computational framework for this cognitive process. At each time step $u$, the update gate $c_u$ dynamically weighs the current input region feature $n^*_u$ against the visual scene description from the previous time step $l_{u-1}$ to determine the extent to which the memory unit is updated. Assuming the sigmoid activation function is denoted as $\delta_c$, and the weights are denoted as $Q_c$ and $I_c$, and the bias is $y_c$, the update gate formula is:
$c_u=\delta_c\left(Q_c n_u^*+I_c l_{u-1}+y_c\right)$ (4)
This gating mechanism allows the model to intelligently filter and integrate information: core region features with high confidence are prioritized in the early part of the sequence, establishing solid semantic anchors for overall scene understanding.
Then, the model contextualizes and interprets regions with lower confidence or more complex semantics based on the already constructed context. Through this progressive reasoning, the hidden state $l_u$ acts as a dynamically updating "visual working memory," gradually refining the semantic representation of the entire image, and ultimately taking the hidden state at the end of the sequence $l_j$ as the global semantic representation of the image $U_H$. Specifically, assuming the tanh activation function is denoted as $\delta_l$, and the weights and biases are denoted as $Q_l, I_l$, and $y_l$, the element-wise multiplication is denoted by the symbol $\circ$, the reset gate is denoted by $e_u$, the new content added to each hidden state can be obtained through the following equation:
$\tilde{l}_u=\delta_l\left(Q_l n_u^*+I_l\left(e_u \circ l_{u-1}\right)+y_l\right)$ (5)
Similar to the update gate, assuming the sigmoid activation function is denoted as $\delta_e$, the weights are denoted as $Q_e$ and $I_e$, and the bias is $y_e$, the calculation formula for $e_u$ is:
$e_u=\delta_e\left(Q_e n_u^*+I_e l_{u-1}+y_e\right)$ (6)
The entire visual scene description at the current time step $l_u$ is expressed as:
$l_u=\left(1-c_u\right) \circ l_{u-1}+c_u \circ \tilde{l}_u$ (7)
When the hidden state $l_j$ at the end of the sequence, representing the image $U_H$, is aligned and matched with the global text features in the shared semantic space, the system can effectively evaluate the student's ability level to integrate visual information at the macro level. Specifically, if the student performs poorly when handling image-text materials requiring multi-level reasoning, the difference between their response and the global representation generated by the model can be analyzed to precisely diagnose their cognitive bottleneck: whether they failed to capture the core elements of the image, lacked the ability to infer secondary information based on context, or had difficulty integrating multiple visual concepts into a coherent semantic structure.
In the proposed model, the design goal of the text encoder is to transform the linear sequence of text information into a structured representation that can deeply align with the global image representation in terms of semantics. This transformation process begins with learning the distributed representation of each word in the input text $S=\left\{q_1, \ldots, q_v\right\}$, by embedding the words into 300-dimensional vectors $a_u$. The model not only captures the surface semantics of the vocabulary but also injects the syntactic and semantic prior knowledge learned from large corpora. Assuming the embedding matrix of word vectors is denoted as $Q_r$, the expression for the word vector $a_u$ is:
$a_u=Q_r \times q_u$ (8)
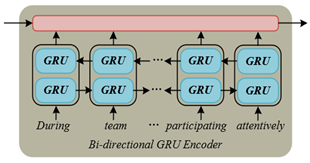
To enable effective interaction between the visual and language modalities, the model further employs a bidirectional gated recurrent unit (Bi-GRU) network to deeply encode the embedded word vector sequence. The Bi-GRU network captures the contextual dependencies of the text in both directions through independent forward and backward GRU encoders: the forward GRU encodes the sentence in its normal order, capturing the progressively unfolding semantic flow, while the backward GRU processes the text in reverse, enhancing sensitivity to subsequent context. The structure diagram is shown in Figure 2. Assuming the forward hidden state at time step $u$ and the backward hidden state at time step $u$ are denoted as $\overrightarrow{g_u}$ and $\overleftarrow{g_u}$, the expressions are:
$\overrightarrow{g_u}=\overrightarrow{G R U}\left(a_u, \overrightarrow{g_{u-1}}\right), u \in[1, v]$ (9)
$\overleftarrow{g_u}=\overleftarrow{G R U}\left(a_u, \overleftarrow{g_{u-1}}\right), u \in[1, v]$ (10)
Figure 2. Bidirectional GRU encoder structure diagram
This bidirectional architecture accurately simulates the cognitive process of proficient readers in understanding text—they not only predict future information based on what they have already read but also reinterpret previous content based on subsequent text, forming dynamic semantic constructions. The hidden states at the last time step from both directions are concatenated and projected through a fully connected layer, ultimately generating a global text representation $S_H$ that matches the dimensions of the image representation, ensuring that the two modalities can be meaningfully compared in the unified semantic space. Assuming the weight parameters in the text fully connected layer are denoted as $Q_H$, the bias parameters in the text fully connected layer are denoted as $y_H$, and the dimension of the final global representation feature vector of the text is denoted as $F$, the concatenation of the two hidden state vectors is denoted as [.,.], and the expression for $S_H$ is:
$S_H=Q_H \times\left[\overrightarrow{g_D}, \overleftarrow{g_D}\right]+y_H$ (11)
The final output $S_H$ of the text encoder, as a condensed representation of the text's semantics, directly reflects the student's understanding of the main idea of the text when calculated for similarity with the global image representation $U_H$. Assuming the cosine similarity function between the image global feature U and the text global feature S is denoted as $SIM(.,.)$, the calculation formula is:
$T_H(U, S)={SIM}\left(U_H, S_H\right)$ (12)
In the context of educational assessment, this global alignment mechanism can effectively diagnose the student's reading comprehension ability at the macro level: when the student accurately grasps the core idea of the text, their mental representation aligns highly with the $S_H-U_H$ matching mode of the model; and when there is a comprehension deviation, this inconsistency can be precisely captured through the quantitative analysis of the similarity score SH(U, S). More importantly, by analyzing the matching patterns between the semantic features captured during the text encoding process and the image representation, the evaluation system can further distinguish whether the student's comprehension difficulty originates from insufficient vocabulary knowledge, complex syntactic structures, or weak logical reasoning skills.
2.1.3 Adaptive alignment module
The fine-grained image-text matching model needs to simulate the refined cognitive operations of proficient readers when understanding image-text materials: when facing a complex sentence and its corresponding image, they will unconsciously establish instantaneous associations between specific vocabulary and corresponding regions in the image. This momentary, local semantic matching is the foundation of deep understanding and is the key to evaluating the subtle differences in individual reading comprehension. To this end, this paper designs an adaptive alignment module based on a local cross-modal attention mechanism. The core principle is to break through the limitations of global alignment’s macro-semantics and, through constructing bidirectional fine-grained interactions between image regions and text words, precisely model and evaluate students' ability to establish image-text semantic associations at the micro level. This module does not operate in isolation; instead, under the macro framework of global alignment, it uses two complementary forms of attention—image-to-text attention and text-to-image attention—to deeply explore the local semantic correspondences between modalities.
Specifically, in terms of technical implementation, the module first constructs a feature foundation suitable for fine-grained alignment: for the image modality, the 36 region features directly extracted by the bottom-up attention mechanism are used, ensuring that each feature vector encodes a visual concept with potential semantic value; for the text modality, each word is contextually encoded using a Bi-GRU network, generating word features that fuse both the forward and backward semantic contexts. Specifically, the forward GRU network encodes the text $S$ from word vector $a_1$ to $a_u$ as follows:
$g_d(u)=\overrightarrow{G R U}\left(a_u\right), u \in[1, v]$ (13)
The backward GRU network encodes the text $S$ from word vector $a_u$ to $a_1$ as follows:
$g_y(u)=\overleftarrow{G R U}\left(a_u\right), u \in[1, v]$ (14)
The final feature representation of the $u$-th word, $r_u$, is calculated as:
$r_u=\frac{g_d(u)+g_y(u)}{2}, u \in[1, v]$ (15)
Based on this, the image-text cross-modal attention mechanism calculates the soft attention weight of each image region for all text words, essentially evaluating the semantic relevance between visual regions and different vocabulary. On the other hand, the text-image cross-modal attention mechanism computes the attention distribution for each word over all image regions, revealing the specific referents of vocabulary in the visual scene. These two attention mechanisms together form a closed-loop, mutually verifying reasoning system. The fine-grained alignment signal output by this system can directly translate into quantifiable metrics that evaluate whether the student has successfully established key image-text associations, such as whether they can correctly match specific adjectives in the text with object attributes in the image or whether they can accurately associate action descriptions with dynamic regions in the image. This provides an indispensable micro-level evidence chain for achieving truly personalized ability diagnosis.
Specifically, the image-text cross-modal attention mechanism’s basic principle is to simulate the cognitive process by which students locate key information in the text through visual cues, enabling precise quantification of word-object level semantic associations. This mechanism takes as input the previously acquired image region feature set $N=\left\{n_1, \ldots, n_j\right\}$ and the text word feature set $R=\left\{r_1, \ldots, r_v\right\}$, and constructs a complete cross-modal association matrix by calculating the cosine similarity between all possible region-word pairs. The similarity $t_{uk}$ between the $u$-th region and the $k$-th word is calculated as:
$t_{u k}=n_u^T r_k, u \in[1, j], k \in[1, v]$ (16)
Apply a zero threshold as the lower bound to tuk and perform L2 normalization, then we have:
$\hat{t}_{u k}=\frac{\operatorname{MAX}\left(t_{u k}, 0\right)}{\sqrt{\sum_{u=1}^j\left[\operatorname{MAX}\left(t_{u k}, 0\right)\right]^2}}$ (17)
After applying zero-threshold and L2 normalization, the similarity matrix not only eliminates the interference of negative correlations but also makes the distribution of attention weights clearer.
Once the normalized similarity matrix is obtained, this mechanism further uses a softmax function to compute the attention distribution for each image region $n_u$ over all text words, achieving selective focusing on text semantics. This means that each visual region can "see" the entire text sequence but will focus with varying intensity on specific vocabulary related to its own semantics. After weighted aggregation, the resulting text feature vector $e_u^s$ is essentially a semantic context customized for region $n_u$, which integrates all the words related to that region in the text. Assuming the weight factor for the softmax function is denoted as $\eta$, the weighted text vector for the $u$-th image region is denoted as $\mu_{uk}$, then we have the expression:
$\mu_{u k}=\operatorname{softmax}\left(\eta \hat{t}_{u k}\right)$ (18)
$e_u^s=\sum_{k=1}^v \mu_{u k} r_k$ (19)
Next, by calculating the cosine similarity between each region feature $n_u$ and its corresponding text vector $e_u^s$, and applying average pooling to the similarities across all regions, we obtain the fine-grained image-text alignment similarity TM (U, S). Let the obtained local similarity be $E_u^s$, and then the expression becomes:
$E_u^s=n_u^T e_u^s$ (20)
$T_M(U, S)=\frac{\sum_{u=1}^j \operatorname{NORM}\left(E_u^s\right)}{j}$ (21)
The above calculation process has clear cognitive interpretative value: it quantifies the extent to which each salient region in the image finds semantic support in the text and reflects the student’s ability to establish "visual concept-language concept" mappings.
This fine-grained alignment mechanism plays an irreplaceable role in achieving precise personalized assessments. By analyzing the attention weight distribution of each region-word pair, the evaluation system can trace the student’s semantic association path and diagnose specific weaknesses in their comprehension process. For instance, when the student is processing a complex scene with multiple objects, if the system detects that their attention weight on a key region is significantly low or that they establish a strong association between the region and unrelated text words, it can precisely pinpoint the source of their comprehension deviation—whether it is due to object recognition errors, attribute understanding biases, or confusion in relationship reasoning. These cross-modal attention-based diagnostic results complement the evaluations from the global alignment module, together constructing a multi-dimensional profile of the student's image-text understanding ability, providing strong data support and theoretical foundation for developing truly personalized reading ability improvement plans.
Correspondingly, the core principle of the text-image cross-modal attention mechanism is to simulate the student’s reverse cognitive process of tracing visual information through linguistic cues, that is, using each word in the text as the query subject to find its corresponding visual referent in the image regions. This mechanism first computes the attention distribution of each word feature $r_k$ over all image regions using the softmax local attention mechanism, thereby generating a weighted and focused image region feature vector $e_k^n$ for each word, which essentially represents the "semantic anchor" of the text word in the visual space. Then, by calculating the cosine similarity $E_u^s(r_k, e_k^n)$ between the word feature rk and its corresponding visual anchor $e_k^n$, and applying average pooling to the similarities across all words, the final fine-grained text-image alignment similarity is obtained.
2.1.4 Model learning strategy
The basic principle of model learning in the fine-grained image-text matching model proposed in this paper is to organically combine the two complementary cognitive dimensions of global semantic alignment and local fine-grained correspondence through a carefully designed joint training framework. This framework constructs a multidimensional indicator system capable of comprehensively evaluating students' image-text understanding ability. The core innovation of this framework lies in adopting a dynamic balance strategy. Instead of simply linearly weighting the global similarity $T_H(U,S)$ and local similarity $T_M(U,S)$, the model autonomously learns to determine the optimal contribution ratio of the two in the final fused similarity $T(U,S)$. Let the weight hyperparameter for fusion be denoted as $\omega$, and the fused similarity is:
$T(U, S)=T_H(U, S)+\omega T_M(U, S)$ (22)
This weighted operation enables a multifaceted representation of reading comprehension ability. Some students excel at grasping the macro theme, while others are skilled in analyzing detailed correspondences. A single-dimensional evaluation would clearly be biased. The fusion strategy ensures that the evaluation model can adaptively adjust the focus of the assessment based on the specific image-text content, thereby forming a more comprehensive and fair judgment of the student's ability.
In terms of loss function design, the model adopts the triplet hinge loss (MTR), which emphasizes the hardest negative samples. This is crucial for providing discriminative power in personalized assessment. The loss function constructs training triplets by actively mining the most similar negative samples to the positive ones, forcing the model to learn to distinguish image-text pairs that are easily confused. Let the correctly matched image-text pair be represented as $(U,S)$, and the mismatched image-text pairs be represented as $(U, \hat{S})$ and $(\hat{U}, S)$, where $\hat{U}$=argmaxk≠UT(k,S) and $\hat{S}$=argmaxf≠S T(U, f) represent the mismatched pairs in which $\hat{U}$ and $\hat{S}$ are found. The fused similarity score is denoted as $T(.,.)$, and the margin parameter between the matching and mismatching pairs is denoted as $\beta$. The specific expression is:
$L_{I R}=M A X[0, \beta-T(U, S)+S(U, \hat{S})] +M A X[0, \beta-T(U, S)+T(\hat{U}, S)]$ (23)
In the educational evaluation scenario, this mechanism enables the model to accurately capture students' "seemingly correct but subtly erroneous" understanding mistakes. For example, a student may have correctly understood the overall scene in the image but made a mistake in interpreting a key detail. This complex ability performance needs to be trained with difficult negative samples for the model to distinguish.
To further enhance the model's generalization ability and semantic transparency, this paper innovatively introduces a text generation task as an auxiliary training objective. This task requires the model to generate descriptive text based on the learned global image representation $U_H$. This process serves as a powerful regularization constraint, forcing the features learned by the visual encoder to contain sufficiently rich and structured semantic information to support reasonable language generation. The corresponding loss function expression is:
$L_{G E}=-\sum_{s=1}^m \log o\left(b_s \mid b_{s-1}, N^* ; \varphi\right)$ (24)
From the perspective of cognitive diagnosis, the design of this loss function greatly enhances the model's interpretability: if the semantic representation of an image can be decoded into a coherent textual description, it indicates that the representation has indeed captured the core semantic content of the image. Therefore, the image-text matching score calculated based on this representation will also provide a more persuasive evaluation of the student's understanding level.
Finally, by jointly optimizing the matching and generation tasks, the model not only learns how to judge whether the image and text match but also gains a deeper understanding of "why" they match. This deeper causal understanding is key to achieving precise and interpretable personalized ability assessment. Let the length of the output text sequence $B=\left(b_1, \ldots, b_u\right)$ be denoted as $m$, and the hyperparameter of this sequence-to-sequence model be denoted as $\phi$. The final loss function is defined as:
$L=L_{T R}+L_{G E}$ (25)
2.2 Personalized assessment of English reading comprehension ability
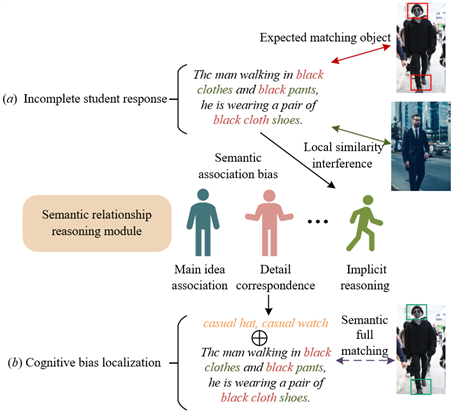
The core mechanism for achieving personalized assessment of English reading comprehension ability in this paper is based on fine-grained image-text matching results, which constructs a diagnostic feedback loop that deduces the student’s cognitive process from their response. When a student completes a reading comprehension task that combines text and images, their provided answer is considered an external manifestation of their internal cognitive state. Figure 3 presents the personalized assessment framework based on fine-grained image-text matching. The system first takes the student's answer text as a query and inputs it into the pre-trained fine-grained image-text matching model to calculate its similarity scores with the standard answer and the image in the question, under both the global alignment module and the local cross-attention module. A key step in this process is performing a difference analysis: by comparing the student’s answer with the standard answer in terms of image-text matching patterns, the system can precisely infer the image-text relationship model established by the student. For example, if the student’s answer is close to the standard answer in terms of global similarity but deviates significantly in the local similarity involving specific region-word pairs, it indicates that the student may have correctly grasped the overall theme but made an error in associating a particular detail. For example, the student might incorrectly associate the phrase "gardener watering the plants" with an image region showing a person holding a stick. This analysis enables the model to go beyond simple right-or-wrong judgment and directly diagnose the potentially erroneous semantic connections that the student has made.
Figure 3. Personalized assessment framework for reading comprehension based on fine-grained image-text matching
After successfully inferring the image-text relationships established by the student, the system uses a pre-constructed "ability-indicator mapping matrix" to map these relationship patterns to specific reading comprehension ability dimensions. This mapping matrix is based on cognitive diagnostic theory and decomposes complex reading comprehension abilities into a series of observable and quantifiable fine-grained skills. For example:
Finally, the system generates a dynamic, personalized ability assessment report by integrating multimodal matching signals with the cognitive diagnostic model. This report not only contains the student’s proficiency probabilities across various ability dimensions but also provides interpretable cognitive diagnostic evidence. For example, the system might clearly indicate: "The student encountered difficulties with spatial relationship reasoning. Their answer failed to establish an effective link between the text description 'behind the tree' and the corresponding area in the image," and automatically recommend practice materials for "understanding spatial prepositions" and "analyzing complex scenes." This entire mechanism transforms advanced computer vision and natural language processing techniques into deep educational insights, realizing a shift from "grading answers" to "diagnosing thought processes." Figure 4 illustrates a typical cognitive bias in students' image-text relationship understanding and the diagnostic correction mechanism.
Figure 4. Typical cognitive bias in students' image-text relationship understanding and diagnostic correction mechanism
To verify the diagnostic effectiveness of each module on different reading comprehension ability dimensions, relevant ablation experiments were conducted. The data analysis in Table 1 shows that the model relying solely on global alignment performs reasonably well in "main theme integration ability," with an accuracy of 71.3%, but it performs significantly poorly in "detail correspondence ability" and "relationship reasoning ability," with accuracies of 54.7% and 48.6%, respectively. In contrast, the model using only local correspondence has a clear advantage in detail processing, with an F1 score of 76.8% for detail correspondence, but it struggles to capture the overall semantic coherence, with a main theme integration accuracy of 67.4%. The key observation is that the model using the similarity fusion strategy achieves a balanced improvement across all dimensions, while the full model in this paper, with its hierarchical reasoning architecture, achieves the optimal performance across all ability dimensions, especially in the relationship reasoning task, where it improves by more than 32 percentage points compared to the baseline. This strongly proves the necessity of global semantic reasoning and local cross-attention working together for a comprehensive evaluation of students' reading comprehension abilities, providing a reliable technical foundation for subsequent personalized assessment report generation.
To determine the optimal balance between global and local features in the final ability diagnosis, this paper conducted a fusion coefficient tuning experiment. The experimental data in Table 2 clearly shows that when the fusion coefficient is 2.0, the model achieves optimal performance across all ability dimensions, with a comprehensive diagnosis accuracy of 84.5%, and the highest consistency with expert evaluation (Kappa = 0.82). Specifically, as the fusion coefficient increases from 0.5 to 2.0, the accuracy in all dimensions shows significant improvement, especially for relationship reasoning ability, which increases from 65.3% to 82.7%, a 26.6% increase. This indicates that moderate enhancement of local features can greatly improve the model's ability to understand complex semantic relationships. However, when the fusion coefficient exceeds 2.0, all metrics show a decline, suggesting that overemphasizing local features undermines the overall semantics, which is detrimental to comprehensive judgment. These experimental results prove that by precisely controlling the fusion ratio of global and local information, the model's diagnostic accuracy for students' reading comprehension abilities can be significantly improved, providing key parameter support for building a reliable personalized assessment system.
Table 1. Performance comparison of different model configurations on reading comprehension diagnosis task
|
Model Configuration |
Main Theme Integration Ability Diagnosis |
Detail Correspondence Ability Diagnosis |
Relationship Reasoning Ability Diagnosis |
||||||
|
Accuracy |
F1 Score |
Recall |
Accuracy |
F1 Score |
Recall |
Accuracy |
F1 Score |
Recall |
|
|
Only Global Alignment |
71.3 |
70.8 |
72.1 |
54.7 |
53.2 |
55.9 |
48.6 |
47.1 |
49.8 |
|
Only Local Correspondence |
67.4 |
66.9 |
68.2 |
77.5 |
76.8 |
78.3 |
72.3 |
71.5 |
73.2 |
|
Loss Function Fusion |
71.5 |
71.0 |
72.3 |
77.8 |
77.1 |
78.6 |
73.1 |
72.3 |
74.0 |
|
Similarity Fusion |
75.2 |
74.8 |
75.9 |
79.3 |
78.7 |
80.1 |
76.5 |
75.9 |
77.4 |
|
Proposed Method (Basic) |
76.8 |
76.4 |
77.5 |
80.1 |
79.5 |
81.0 |
78.2 |
77.6 |
79.1 |
|
Proposed Method (Full) |
78.6 |
78.3 |
79.2 |
82.7 |
82.2 |
83.5 |
80.9 |
80.4 |
81.7 |
Table 2. Analysis of the effect of different fusion coefficients on ability diagnosis performance
|
Model Configuration |
Main Theme Integration Accuracy |
Detail Correspondence Accuracy |
Relationship Reasoning Accuracy |
Comprehensive Diagnosis Accuracy |
|
0.5 |
68.4 |
72.1 |
65.3 |
68.6 |
|
1.0 |
75.3 |
78.6 |
72.4 |
75.4 |
|
1.5 |
81.2 |
83.5 |
78.9 |
81.2 |
|
2.0 |
84.6 |
86.3 |
82.7 |
84.5 |
|
2.5 |
82.1 |
84.8 |
80.3 |
82.4 |
|
3.0 |
79.5 |
82.1 |
77.8 |
79.8 |
Table 3. Performance benchmark comparison of different models on standardized diagnostic tasks
|
Model Method |
Main Theme Integration Ability |
Detail Correspondence Ability |
Relationship Reasoning Ability |
Comprehensive Diagnostic Accuracy |
|||
|
Accuracy |
F1 Score |
Accuracy |
F1 Score |
Accuracy |
F1 Score |
mAP |
|
|
CLIP |
68.2 |
67.5 |
58.3 |
57.6 |
52.1 |
51.4 |
59.5 |
|
BLIP |
71.5 |
70.9 |
61.2 |
60.5 |
56.8 |
56.1 |
63.2 |
|
KAT |
73.8 |
73.2 |
63.5 |
62.9 |
59.2 |
58.6 |
65.5 |
|
ROSITA |
75.1 |
74.6 |
64.8 |
64.2 |
60.7 |
60.1 |
66.9 |
|
REVIVE |
76.9 |
76.4 |
65.3 |
64.7 |
61.9 |
61.3 |
68.0 |
|
Proposed Method |
78.6 |
78.1 |
67.4 |
66.9 |
63.8 |
63.2 |
69.9 |
Table 4. Generalization ability evaluation of different models in real educational scenarios
|
Model Method |
Consistency with Expert Evaluation |
Cross-School Generalization Ability |
Diagnostic Result Explainability |
|
Kappa Coefficient |
Accuracy Retention |
Teacher Satisfaction Score |
|
|
CLIP |
0.63 |
75.8% |
3.4/5.0 |
|
BLIP |
0.67 |
78.3% |
3.7/5.0 |
|
KAT |
0.70 |
81.2% |
4.1/5.0 |
|
ROSITA |
0.72 |
83.5% |
4.2/5.0 |
|
REVIVE |
0.74 |
84.1% |
4.3/5.0 |
|
Proposed Method |
0.77 |
86.7% |
4.6/5.0 |
To establish an objective benchmark for model performance, this paper conducted standardized diagnostic experiments to verify the technical superiority of the proposed method in core ability dimensions. The experimental results in Table 3 strongly demonstrate the comprehensive advantage of the proposed method in core technical metrics. In the standardized diagnostic task, the proposed method achieves the best performance in the three core ability dimensions: main theme integration, detail correspondence, and relationship reasoning, with a comprehensive diagnostic accuracy (mAP) of 69.9%, improving by 1.9 percentage points over the strongest baseline model, REVIVE. Notably, for the most challenging relationship reasoning task, the proposed method improves by 11.7 percentage points over the CLIP model, fully validating the effectiveness of the introduced visual semantic relationship mining mechanism. Technically, models like CLIP and BLIP, which are based on large-scale pretraining, perform well in basic semantic understanding but have limitations in tasks that require deep reasoning. On the other hand, methods like KAT and ROSITA, which introduce external knowledge or relationship modeling, show gradual improvement. The proposed method combines bottom-up visual attention and hierarchical semantic reasoning networks, enabling deep modeling of semantic relationships between image regions and cross-modal associations between text and images, thus achieving optimal performance in all diagnostic tasks and providing a reliable technical foundation for subsequent personalized assessment.
Furthermore, this paper conducted real-world scenario validation experiments to evaluate the practical application value and potential for generalization of the model. The evaluation results in Table 4 further confirm the practical value and generalization ability of the proposed method in real educational scenarios. The proposed method achieves a Kappa coefficient of 0.77 for consistency with expert evaluation, a cross-school accuracy retention of 86.7%, and a teacher satisfaction score of 4.6/5.0, all significantly outperforming the comparison models. This result is of great educational significance: the high Kappa coefficient indicates that the model's diagnostic results are highly consistent with educational experts and can reliably replace part of manual evaluation work. The 86.7% cross-school accuracy retention shows that the model has stable diagnostic ability across different teaching backgrounds and student groups, overcoming the shortcomings of traditional methods in terms of generalization. In particular, the teacher satisfaction score of 4.6 reflects that the model's diagnostic results are highly interpretable and have significant teaching guidance value. These empirical results demonstrate that the visual semantic relationship mining framework constructed in this paper is not only a technical model but also a personalized assessment tool that adapts to real educational environments and produces practical, actionable evaluation reports, providing a complete solution for accurate reading ability diagnosis.
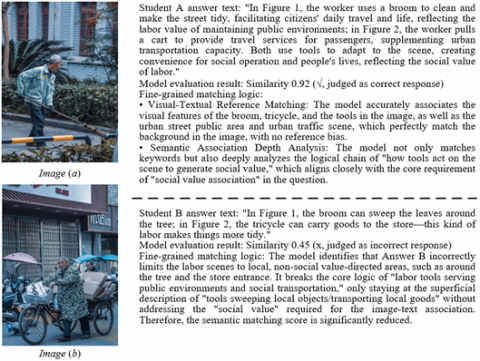
Figure 5. Comparison of evaluation cases on student response understanding using the fine-grained image-text matching model
Finally, to verify whether the proposed fine-grained image-text matching model can accurately diagnose students' cognitive differences in image-text understanding and prove its superiority over traditional methods in achieving personalized assessment, this paper conducted an evaluation case comparison experiment on student response understanding using the fine-grained image-text matching model. The experiment compared and analyzed student answers of different quality, assessing the model’s effectiveness in semantic understanding depth and cognitive bias localization. Figure 5 provides the comparison results. This experiment clearly demonstrates the effectiveness of the proposed fine-grained image-text matching model in diagnosing students' reading comprehension cognitive processes by comparing student A's similarity score of 0.92 with student B's similarity score of 0.45. For student A's answer, the model not only judges the response accuracy based on global semantic alignment but, more importantly, successfully identifies that the student has established a complete three-level semantic association of "tool-scene-social value," accurately linking the visual features of "broom" and "tricycle," understanding the scene context of "urban street" and "public transportation," and finally reasoning out the deep theme of "creating social value." This multi-level matching from visual reference to semantic reasoning proves that the model can capture students’ higher-order thinking activities and precisely evaluate "main theme integration" and "relationship reasoning" abilities.
Conversely, a deep analysis of student B's answer highlights the unique value of the model in pinpointing specific cognitive biases. The model, by calculating local similarity, accurately identifies the limitations in the student’s understanding: while the answer correctly refers to objects like "broom" and "tricycle," the attention mechanism shows that the semantic associations were wrongly confined to non-typical local scenes like "around the tree" and "in front of the store," failing to link to core concepts like "public environment" and "social service." This analysis directly locates the low match score to two specific dimensions: "insufficient detail correspondence ability" and "weak relationship reasoning ability." This experimental conclusion strongly proves that the evaluation mechanism built in this paper successfully transcends traditional scoring methods, achieving a paradigm shift from "judging right or wrong" to "diagnosing thought processes," and providing reliable technical support for generating truly meaningful personalized assessment reports for teaching guidance.
This paper systematically constructed a technical framework integrating "fine-grained image-text matching" with "personalized ability assessment," successfully achieving a multi-dimensional and precise diagnosis of English reading comprehension ability. The proposed improved visual semantic reasoning model, through the synergistic effect of bottom-up attention mechanism, region relationship reasoning GCN, and bidirectional cross-modal attention mechanism, significantly improved the accuracy of image-text relationship understanding in standardized tests. Its comprehensive diagnostic accuracy improved by nearly 2 percentage points compared to the best baseline model. More importantly, in validation within real educational scenarios, the model demonstrated excellent generalization ability and practical value, proving its reliability in identifying students' cognitive characteristics and weak points in core ability dimensions such as main theme integration, detail correspondence, and relationship reasoning. The core value of this research lies in overcoming the limitations of traditional reading comprehension assessments that focus solely on text, creating a complete technical path of "visual semantic relationship mining - cognitive process modeling - ability dimension mapping," which provides a personalized assessment solution for smart education with both technological innovation and educational practicality.
However, there are certain limitations in this study. First, the model's performance depends on high-quality image region annotations and semantic relationship annotations, and it may face challenges in application scenarios lacking fine-grained annotation data. Second, the current model mainly handles static image and text associations, and there is still insufficient support for dynamic multi-modal information such as video and audio. In addition, while the assessment dimensions cover core cognitive abilities, the exploration of deeper factors such as emotional attitudes and cultural background remains insufficient. To address these limitations, future research can delve into three directions: first, exploring weak supervision and self-supervised learning strategies to reduce reliance on manual annotation data; second, expanding dynamic multi-modal understanding capabilities, researching cross-modal alignment mechanisms for video description and text understanding; third, incorporating educational psychology theories to establish a more comprehensive cognitive diagnostic model, incorporating latent factors such as metacognitive strategies and learning motivation into the assessment system, ultimately constructing a more intelligent, comprehensive, and adaptive new generation of educational assessment paradigms.
This paper was funded by the Humanities and Social Sciences Project of the Provincial Education Department in 2023 (Project Name: Under the rural revitalization strategy, the "three-cross and multi-integration" new liberal arts talent training strategy; Grant No.: Y202351574).
[1] Kim Lau, S., Yang Ang, A., Winley, G. (1999). Alignment of technology and information systems tasks: A Singapore perspective. Industrial Management & Data Systems, 99(6): 235-246.
[2] Ozer, G., Yilmaz, E. (2010). An application to the accountants' information technology usage with the Theory of Reasoned Action. Iktisat Isletme Ve Finans, 25(290): 65-88.
[3] Mališ, S.S., Sačer, I.M., Žager, K. (2022). Landscape of e-learning during Covid-19: Case study of economic disciplines in Croatia. Business Systems Research: International Journal of the Society for Advancing Innovation and Research in Economy, 13(2): 8-27. https://doi.org/10.2478/bsrj-2022-0013
[4] Holmgren, M. (2024). Expanding the special education professional toolbox: A case study of a digitalised special education practice in Sweden. Journal of Research in Special Educational Needs, 24(3): 667-680.
[5] Volovikova, Z.A., Kuznetsova, M.P., Skrynnik, A.A., Panov, A.I. (2024). Review of multimodal environments for reinforcement learning. Doklady Mathematics, 110(Suppl 1): S110-S116. https://doi.org/10.1134/S1064562424602166
[6] Omarsaib, M. (2024). Exploring first-year engineering student perceptions of the engineering librarian as an IL instructor in multimodal teaching and learning environments. Digital Library Perspectives, 40(1): 113-130. https://doi.org/10.1108/DLP-08-2023-0069
[7] Emerson, A., Cloude, E.B., Azevedo, R., Lester, J. (2020). Multimodal learning analytics for game-based learning. British Journal of Educational Technology, 51(5): 1505-1526. https://doi.org/10.1111/bjet.12992
[8] Al-Janaideh, R., Hipfner-Boucher, K., Cleave, P., Chen, X. (2022). Contributions of code-based and oral language skills to Arabic and English reading comprehension in Arabic-English bilinguals in the elementary school years. International Journal of Bilingual Education and Bilingualism, 25(7): 2495-2510. https://doi.org/10.1080/13670050.2021.1927974
[9] Proctor, C.P., Carlo, M., August, D., Snow, C. (2005). Native Spanish-speaking children reading in English: Toward a model of comprehension. Journal of Educational Psychology, 97(2): 246-256. https://doi.org/10.1037/0022-0663.97.2.246
[10] Bast, H., Buchhold, B., Haussmann, E. (2018). A quality evaluation of combined search on a knowledge base and text. KI-Künstliche Intelligenz, 32(1): 19-26. https://doi.org/10.1007/s13218-017-0513-9
[11] Contreras-Piña, C., Ríos, S.A. (2016). An empirical comparison of latent sematic models for applications in industry. Neurocomputing, 179, 176-185. https://doi.org/10.1016/j.neucom.2015.11.080
[12] Vasilopoulos, I.V., Prayati, A.S., Athanasopoulos, A.V. (2007). Implementation and evaluation of a Greek Text to Speech System based on an Harmonic plus Noise Model. IEEE Transactions on Consumer Electronics, 53(2): 585-592. https://doi.org/10.1109/TCE.2007.381733
[13] Idrees, H., Shah, M., Surette, R. (2018). Enhancing camera surveillance using computer vision: A research note. Policing: An International Journal, 41(2): 292-307. https://doi.org/10.1108/PIJPSM-11-2016-0158
[14] Bitter, C., Elizondo, D.A., Yang, Y. (2010). Natural language processing: A prolog perspective. Artificial Intelligence Review, 33(1): 151-173. https://doi.org/10.1007/s10462-009-9151-4
[15] Wang, H., Liu, Q., Huang, R., Zhang, J. (2023). Multi-modal entity alignment method based on feature enhancement. Applied Sciences, 13(11): 6747. https://doi.org/10.3390/app13116747
[16] Zhang, D., Liu, C. (2014). A salient object detection framework beyond top-down and bottom-up mechanism. Biologically Inspired Cognitive Architectures, 9: 1-8. https://doi.org/10.1016/j.bica.2014.06.005
[17] Duan, B., Chen, S., Guo, Y., Xie, G.S., Ding, W., Wang, Y. (2024). Visual–semantic graph matching net for zero-shot learning. IEEE Transactions on Neural Networks and Learning Systems, 36(6): 10171–10185. https://doi.org/10.1109/TNNLS.2024.3499377
[18] Li, F., Zhou, H., Li, H., Zhang, Y., Yu, Z. (2024). Person text-image matching via text-feature interpretability embedding and external attack node implantation. IEEE Transactions on Emerging Topics in Computational Intelligence, 9(2): 1202-1215. https://doi.org/10.1109/TETCI.2024.3462817
[19] Liu, M., Khairuddin, A.S.M., Hasikin, K., Liu, W. (2025). Novel cross-dimensional coarse-fine-grained complementary network for image-text matching. PeerJ Computer Science, 11: e2725. https://doi.org/10.7717/peerj-cs.2725
[20] Azmuddin, R.A., Nor, N.F.M., Hamat, A. (2017). Metacognitive online reading and navigational strategies by science and technology university students. GEMA Online Journal of Language Studies, 17(3): 18-36. http://doi.org/10.17576/gema-2017-1703-02
[21] Almufayrij, H. (2020). Saudi students’ perceptions of schemata and poetry comprehension. Arab World English Journal (AWEJ), 11(3): 446-463.