Nouf Abdullah Almujally | Fakhra Nazar | Haita F. Alharron | Noif S. Alshaooari | Khaled Alnowaiser | Asaad Algarni | Ahmad Jalal*![]()
© 2025 The authors. This article is published by IIETA and is licensed under the CC BY 4.0 license (http://creativecommons.org/licenses/by/4.0/).
OPEN ACCESS
Human Activity Recognition (HAR) is the fundamental area of artificial intelligence, machine learning, and deep learning for all classification approaches dealing with human actions. The current HAR system encompasses advanced information preprocessing alongside customized classification features and algorithms. Widespread use of 4th-order median filtering is a primary noise reduction technique before signal enhancement through Hamming window processing. The source data uses Particle Swarm Optimization (PSO) to determine optimized characteristics that form the basis of retention discrimination from other features. The system employs Multi-Layer Perceptron (MLP) technology, which supports deep learning framework-driven activity classification operations. The system's effectiveness was evaluated on three prominent datasets: HCI, HMP, and WISDM. When tested on HCI data, the proposed approach achieved 85% precision rates but recorded 94% accuracy for HMP data preceding WISDM-based recognition at 92%. These results announce the capacity of the system for truthful and trustworthy activity cataloging in varied real-world artificial intelligence products.
activity recognition, feature extraction, healthcare, machine learning, Particle Swarm Optimiser, deep learning, wearable sensors
Human Activity Recognition (HAR) is an emerging research focus, particularly the ability to understand, analyze, and classify human activities from wearable sensor data. This field finds its application in systems like health monitoring, fitness, and smart homes. Nonetheless, shortcomings are attached to using HAR because of the complexity of human activities, differences in the location of sensors, and noise in captured signals. These factors could mask important emergent structures needed for activity identification. Therefore, the formulation of effective methodologies that can well handle and analyze such sensor data is important.
Wearable sensor data presents new levels of challenge in decision-making and data analysis. Signal fluctuations caused by external noise or wearer mobility, as well as inter-individual disparity, require signal preprocessing as well as feature extraction. Many sensors used in a similar setting produce high-dimensional data, which may contain noise or irrelevant features, making classification even more challenging. To address these issues, the best solution can be considered the application of modern methods of data preprocessing and optimization of the set of decision-making factors.
In this study, to overcome the above challenges, we choose three wearable sensor datasets that are accessible to the public. The first process includes pre-processing the data to remove the noise from the signal but keeping most of its features by using the fourth-order median filter. Subsequently, a Hamming window was applied to further smooth the signal and bring it into the best possible state to extract features. The extracted features were further enhanced by Particle Swarm Optimization (PSO), a metaheuristic in nature that was installed to minimize the dimensions of the features while keeping the most significant ones. Last but not least, in the last step, the different human activities were categorized with the help of the MLP classifier since it is successful in training high-level features and identifying nonlinear relationships in the optimized feature space.
The generalized methodology suggested in this paper provides a framework for enhancing the accuracy and efficiency of HAR. Our goal with the proposed approach includes handling difficulties associated with wearable sensor data, such as the non-stationary nature of the signal, by combining feature optimization and machine learning with advanced signal processing. The remaining paper is structured as follows: Section 2 surveys related studies and examines prior methods of HAR. Section three provides more information about the proposed methodology. A discussion of results is given in section 4, where the efficiency of the proposed approach will be illustrated. Last but not least, Section 5 provides a general summary of the paper and future research lines.
As recent breakthroughs in HAR show, the challenges that exist in this field have been solved with the help of wearable sensors and advanced computational models. HAR has achieved great progress because researchers combined wearable sensors with machine learning approaches. Different researchers investigate multiple methods regarding feature extraction, optimization, and classification techniques for HAR. The literature review of signal features-based locomotion prediction models created in previous studies is presented in Table 1.
Table 1. Literature review of HAR methods
|
Authors |
Systems |
Limitations |
|
Huang et al. [1] |
Presented a new technique for activity recognition using a lightweight convolutional neural network known as channel-equalization-HAR, which proved to be efficient with low computing power. |
The main limitation of this approach is how multiple channels provide such minimal participation in activity detection that the network only relies on selected valid channels. |
|
Huang et al. [2] |
Proposed a deep ensemble learning model incorporating filter activation to enhance the classification outcomes for HAR tasks. |
The complexity of the model represents an obstacle for deployment onto devices that maintain low computational processing power. |
|
Gumaei et al. [3] |
Looked at edge computing, proposing the DL-HAR framework, which employs deep learning for activity identification on constrained devices. |
Performance limitations occur in deep learning model deployment to edge systems because these systems have restricted processing resources and insufficient computational power. |
|
Qi et al. [4] |
Introduced an adaptive recognition and real-time monitoring system for real-time activity tracking; this showcased how algorithms can be appropriate in dynamic settings. |
The system suffers from performance degradation during real-time processing that is influenced by sensor data signal interference. |
|
Semwal et al. [5] |
Used inertial measurement unit (IMU) sensors to evaluate the gait of human walking and assigned it general joint-specific movement patterns. |
The experimental approach demonstrates restricted adaptability for monitoring different motions beyond walking due to its specific design. |
|
Vavoulas et al. [6] |
Highlighted the potential of smartphone sensors in their MobiAct dataset to successfully recognize day-to-day activities. |
The placement method of the wearables affects their performance level because it determines activity recognition precision. This represents a recognized operational restriction. |
|
Bhattacharjee et al. [7] |
Rich insights about the performance of various algorithms for HAR have been provided by comparative analysis on supervised learning techniques provided by Bhattacharjee et al. [7]. |
The study reveals an absence of valid testing on various real-world datasets because this deficiency could reduce the validity of the results. |
|
Gupta and Dallas [8] |
Applied the feasibility of using only a single triaxial accelerometer with the help of feature selection algorithms to achieve the maximum performance that marks a successful path for developing the HAR systems. |
The system's performance declines for recognizing various activities because it depends on a single sensor which provides limited feature diversity. |
The method followed in the proposed approach includes signal preprocessing of wearable sensors comprising the fourth order median filter and Hamming window, feature optimization through PSO and activity classification through Multi-layer Perceptron (MLP) for superior accuracy and optimization.
In this work, we presented an integrated approach towards HAR through three databases of wearable sensors. The first step involved data preprocessing of the raw sensor data: we filtered the signals using a 4th order median filter to condemn noise and smoothen the data’s readings. Subsequently, Hamming window was used on the obtained data to minimize the spectral leakage in preparation of feature extraction. The most relevant factors were initially derived from the processed data to extract the most important patterns that define different activities. To improve feature space, extracted features underwent PSO, which improves the selection of features so as to make the performance higher as compared to the classification task. Then, the important features were presented to an MLP for activity classification where the features were optimized.
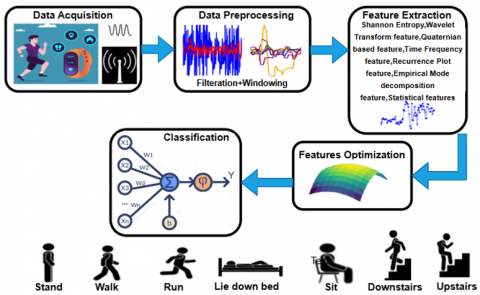
The overall strategy of preprocessing, followed by feature optimization and classification, was found to provide reasonable performance for the final classifier with three datasets used to recognize human activities from wearable sensor data. Figure 1 demonstrates the overall functionality of our proposed method.
Figure 1. All-encompassing depiction of the suggested framework
3.1 Data pre-processing
In the pre-processing step, we performed preprocessing on all sensor data in the three datasets. More details on the 4th-order median filter and its application to the pre-processing step along with the Hamming window, is made available in the subsequent subsection.
3.1.1 4th order median filter windowing
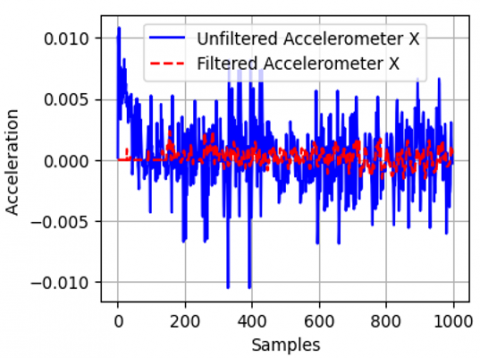
In this paper, it is shown that pre-processing can significantly enhance the capabilities of sensor networks through steps such as applying a 4th order median filter to the data produced by the sensors. This filter is meant to help reduce noise and improve the quality of data to make the signal much better. Collection circumstances from which data were obtained in the case of datasets are often comprised of noise such as spikes and fluctuations due to the limitations of a particular sensor or different conditions of the environment. To remove such interfering signal, we applied 4th order median filter on the data obtained from all the three types of dataset. The same data, filtered, is presented in Figure 2 which shows how this pre-processing enhance the HCI signal quality along x axis of accelerometer sensor.
Figure 2. Original vs filtered signal over HCI dataset
3.1.2 Windowing
Subsequent to the median filtering at the 4th order, the data was subjected to a Hamming window basically to enhance the signal. The Hamming window is one of the windows used in tapering functions for the reduction of spectral leakage by preventing a change of the frequency of the signal by sudden variation of the amplitude of the signal. The Hamming window function W (n) is given by:
$W(n)=0.54-0.46. \cos \left(\frac{2 \pi n}{N-1}\right), 0 \leq n \leq N-1$ (1)
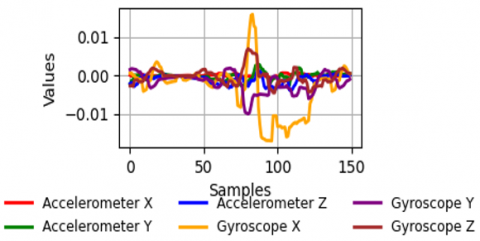
where, N is the size of the window which has been chosen and n is the position of the data point in the chosen window. This windowing function is especially helpful in time-serial data to diminish the data and enhance the precision of feature extraction plus categorization. We used the Hamming window to the filtered data, and this further enhanced the signal so that other forms of distortions are minimized. In Figure 3, windowed data along all dimensions of both sensors from the HCI dataset are demonstrated.
Figure 3. Outcomes of accelerometer and gyroscope data after applying a hamming window over HCI dataset
3.2 Features extraction
For the filtered data, after applying the Hamming window, several features were derived to get the different characteristics of the signal. Features used in this study include Shannon entropy, wavelet transform features, quaternion-based features, time-frequency features, recurrence plot features, empirical mode decomposition features, mean, variance, Root Mean Square feature, and standard deviation. The present features offer a broader representation of the sensor data that will help improve the recognition of the activity.
3.2.1 Shannon entropy
Shannon entropy, this measure is called the entropy of the signal is defined by the level of interactions between the signal and the measure of the unpredictability or randomness. It quantifies the amount of uncertainty in the signal and is defined as:
$H(X)=\sum_{i=1}^n p\left(x_i\right) \log \left(p\left(x_i\right)\right)$ (2)
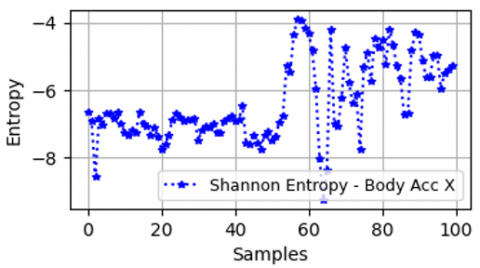
where, p(xi) is the probability of a member's signal xi, it is the likelihood that this signal value occurs in a specific dataset. Shannon entropy functions as a differentiation tool between human activities within HAR through its ability to evaluate signal complexity. Walking and similar repetitive movements generate lower entropy levels than tooth brushing, along with other random activities, because walking produces predictable patterns. Figure 4 demonstrates the result of applying the Shannon entropy feature extraction that determined the signal randomness in each point.
Figure 4. Shannon entropy alongside accelerometer x-axis data
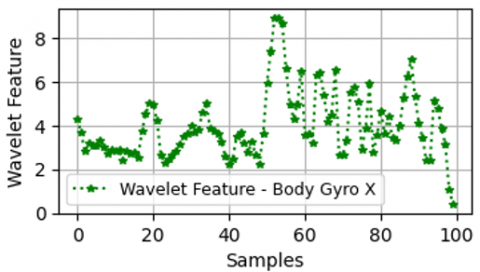
3.2.2 Wavelet transform feature
The features derived from wavelet transforms are obtained from the analysis of the signals in terms of frequency contents. The continuous wavelet transform (CWT) of the signal f(t) is defined as:
$W(a, b)=\int_{-\infty}^{\infty} f(t) \Psi *((t-b) / a) d t$ (3)
The wavelet function is represented by $\psi$, the scaling parameter is a , and the translation parameter is b. The combination of time and frequency information accessible through wavelets in HAR makes them an effective tool for detecting standard movement patterns. This differentiates movements between walking, running, and standing activities. Figure 5 presents the visuals of Wavelet Transform feature extraction in some data points of HCI data.
Figure 5. Wavelet transform feature extraction by gyroscope x-axis data
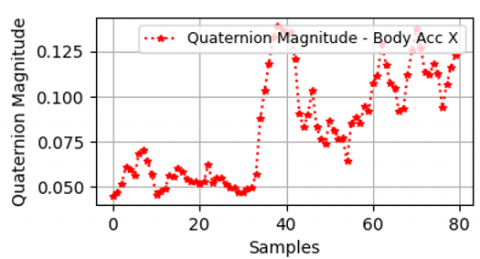
3.2.3 Quaternion-based feature
Quaternion-based features preserve the most of the rotational and directional characteristics of the signal in 3-D space. The quaternion representation q(t) is defined as:
$q(t)=a(t)+b(t) i+c(t) j+d(t) k$ (4)
where, a(t), b(t), c(t), and d(t) are components contributing to signal orientation while i,j, and k are the imaginary parts. The orientation and rotational changes in body movements can be effectively detected using quaternion features in HAR since these features allow distinction of activities that share similar movements yet present different postures or directions. This helps in recognizing complex three-dimensional motions, including activities that differ between sitting down versus lying down and walking versus turning. Figure 6 includes the quaternion-based features of the data where the signal in the time domain rotates and shifts in 3D space.
Figure 6. Quaternion-based feature extraction by accelerometer x-axis
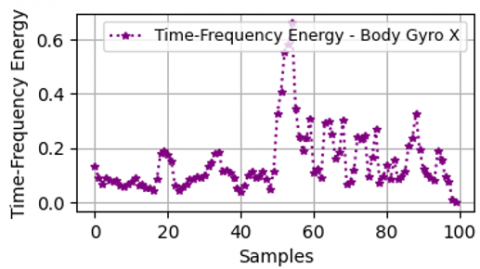
3.2.4 Time-frequency feature
The time-frequency features can be described by performing the analyses in both in time domain and frequency domain. One common method for calculating time-frequency representations is the Short-Time Fourier Transform (STFT), which is defined as:
$\operatorname{STFT}\{f(t)\}(t, \omega)=\int_{-\infty}^{\infty} f(\tau) h(t-\tau) e^{-i \omega \tau} d \tau$ (5)
where, $h(t-\tau)$ is the window function, $\omega$ is the frequency, and $t$ is the time variable. The identification of transitions between activities depends on time-frequency features since these patterns monitor motion patterns through time to differentiate between actions that share similar frequency ranges yet have dissimilar timing rhythms (walk and stair climb as an example). Figure 7 shows the time frequency characteristics of the data for frequency aspects of the signal with time.
Figure 7. Time-Frequency feature extraction from gyroscope x-axis
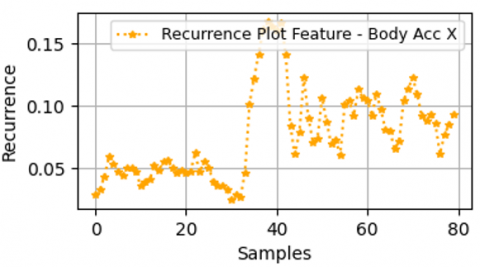
3.2.5 Recurrence plot feature
Based on the idea of time, the features of the recurrence plot result from the recurrence of the signal patterns. The recurrence matrix R is defined as:
$\mathbf{R}_{\mathrm{ij}}=1$ if $\left|\mathrm{x}_{\mathrm{i}}-\mathrm{x}_{\mathrm{j}}\right|<\epsilon \quad \mathbf{R}_{\mathrm{ij}}=0$ if $\left|\mathrm{x}_{\mathrm{i}}-\mathrm{x}_{\mathrm{j}}\right| \geq \epsilon$ (6)
where, $\epsilon$ is a threshold distance, and $x_i x_j$ are the signal values of the signal at time $i$ and time j . HAR systems utilize recurrence plots to detect regular patterns in motion signals which identifies periodic actions such as walking or running as well as to track modifications in the temporal structure of irregular or non-periodic movements. The last row of features is presented in the form of a recurrence plot feature, which captures the periodicity of the signal in the time domain as shown in Figure 8.
Figure 8. Resulting recurrence plot feature values on x-axis of accelerometer
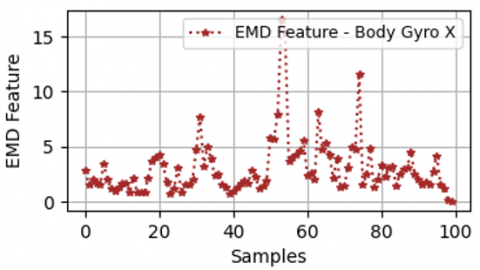
3.2.6 Empirical mode decomposition feature
It is another robust, adaptive, and efficient feature extraction technique for a signal to be analyzed. Through EMD, the signal is subjected to a decomposition process into intrinsic mode functions (IMFs). The signal f(t) can be represented as:
$f(t)=\sum_{i=1}^n \operatorname{IMFi}(t)+r N(t)$ (7)
where, IMFi(t) are the instrinsic mode functions and rN(t) is the residual after decomposition. Non-stationary motion signals undergo analysis in HAR through EMD because it decomposes signals into simpler oscillatory components i.e. IMFs which represent activity-unrelated patterns that help differentiate activities with multiple simultaneous motions like jogging with arm movements. Figure 9 displays the result of the empirical mode decomposition feature, in terms of the resulting IMFs that define and capture local features of the signal. Figure 9 indicates the illustrations of Empirical Mode Feature extraction on data from accelerometer x-axis data coming from HCI dataset.
Figure 9. EMD feature extraction results of gyroscope on x-axis
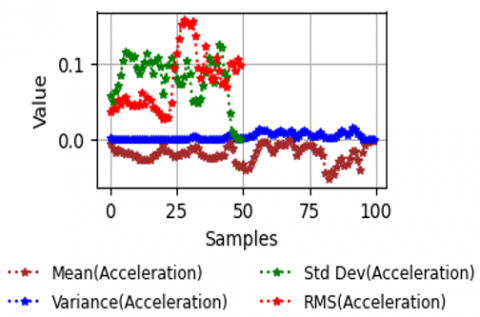
3.2.7 Statistical features: mean, variance, root mean square, standard deviation
The mean feature represents the average value of the signal in each frame, calculated as:
$\mu=1 / N \sum_{i=1}^n x_i$ (8)
The variance feature measures the spread of the signal values, calculated as:
$\operatorname{Var}(x)=1 / N \sum_{i=1}^n\left(\mathrm{x}_{\mathrm{i}}-\mu\right) 2$ (9)
The RMS feature represents the magnitude of the signal, calculated as:
$R M S=\sqrt{1 / N \sum_{i=1}^n\left(\mathrm{x}_{\mathrm{i}}\right) 2}$ (10)
The standard deviation feature measures the dispersion of the signal, calculated as:
$\sigma=\sqrt{1 / N \sum_{i=1}^n\left(\mathrm{x}_{\mathrm{i}}-\mu\right) 2}$ (11)
In Eqs. (8)-(11), N is the number of samples and xi is an estimate of the signal that will be taken at the ith sample. The signal characteristics measured through statistical features generate an efficient summary that identifies differences between sedentary states and energetic states (sitting vs. running) in HAR platforms. Statistical features extracted are depicted in Figure 10.
Figure 10. Illustration of statistical features extracted from accelerometer
Class Imbalance and Feature Balancing. After extracting features, the approach for balancing classes was implemented to handle dataset imbalance. The prediction performance degrades and becomes biased because of underrepresented activity classes in class-imbalanced datasets. A resampling technique was used as an intervention, which involved a focus on oversampling minority class instances.
For instance, in the HMP dataset, the "BrshTth" activity instances were substantially not equal to the "Wlk" category. We remedied the imbalance between minority and majority class instances by duplicating instances from the class having fewer samples until they matched the count of instances in the one having more training data points. The training set contained equal portions from each class because of this procedure. The process began with activity class segregation followed by oversampling all minority class data points until their distribution became equal.
The approach was implemented identically on each dataset collection (HMP, HCI, and WISDM) to achieve proper representation of all activities without preference for majority activities.
3.3 Features optimization
The research used Particle Swarm Optimizer (PSO) to find valuable features and exclude unnecessary ones to enhance system effectiveness. PSO utilizes bird and fish group behaviors to enhance solutions by testing particle fitness multiple times. A particle searches for better solutions in feature space when it evaluates both its own history and data shared by other particles. The position ($\mathrm{x}_{\mathrm{i}}$) and velocity ($\mathrm{v}_{\mathrm{i}}$) of each particle are updated iteratively using the following equations:
$\begin{gathered}v_i(t+1)=w \cdot v_i(t)+c 1 \cdot r 1\left(p i^{\text {best }}-\mathrm{x}_{\mathrm{i}}(t)\right)+ c 2 \cdot r 2\left(g^{\text {best }}-\mathrm{x}_{\mathrm{i}}(t)\right), \mathrm{x}_{\mathrm{i}}(t+1)=\mathrm{x}_{\mathrm{i}}(t)+v_i(t+1)\end{gathered}$ (12)
Here w stands for the PSO inertia weight while c1and c2 establish the PSO coefficients and r1and r2 are random variables within 0 and 1. pibest is the best position of particle and gbest is the global best position. Through the PSO algorithm MLP predictions achieved better results by using optimal wavelet transforms and Shannon entropy features. The studies found in papers [9-12] show PSO improves the precision of classification tasks.
|
Algorithm 1: Feature Optimization with PSO |
|
Input: X_train, y_train (Training data and labels)
Output: Best selected features and accuracy score Split the dataset: Split X, y into X_train, X_val, y_train, y_val using train_test_split with 80% training and 20% validation Define fitness_function: Input: feature_subset (current particle's position) Output: negative accuracy (fitness score) Select features based on particle's position (threshold > 0.5) Train RandomForestClassifier using selected features (X_train) Predict using the trained model on X_val with selected features Calculate the accuracy by comparing predicted labels with y_val Append negative accuracy and feature_subset to visualize the optimization process Return negative accuracy Initialize PSO parameters: lb = [0] * num_features // lower bound for feature selection ub = [1] * num_features // upper bound for feature selection Run PSO optimization: best_features, best_score = pso(fitness_function, lb, ub, swarm_size=30, max_iter=5) Extract selected features: selected_feature_indices = indices,where best_features > 0.5 Output: Print "Best Accuracy Score: -best_score" Print "Best Selected Features: selected_feature_indices" End |
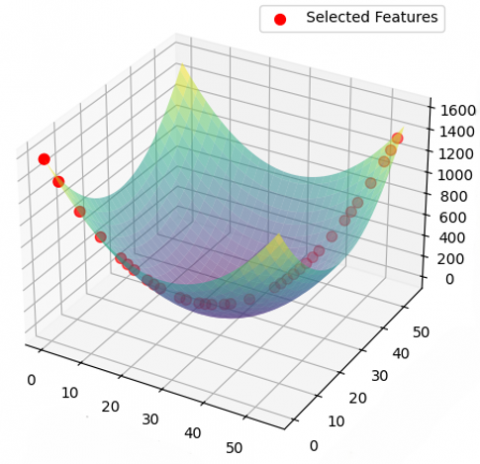
Figure 11. Pointing out selected features with respect to total features and fitness values
(a)
(b)
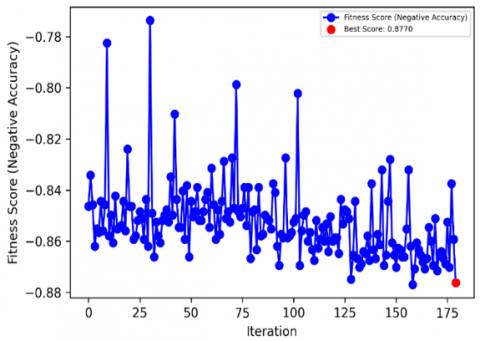
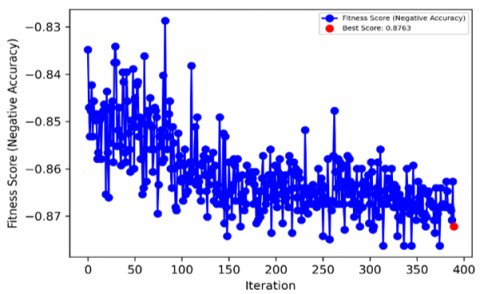
Figure 12. PSO Convergence-Accuracy vs. Iterations (a) for maxitr=5 and (b) for maxitr=12
Through this algorithm, we seek to enhance model accuracy by reducing negative accuracy after selection of features.
Figure 11 shows how selected features (x-axis) correlate with total extracted features (y-axis) and each match's fitness (accuracy) value position (z-axis) where selected features appear in red.
During a maximum of 5 PSO iterations, the process reached an accuracy level of 0.8770. An experiment was conducted using 12 iterations to check for premature convergence or local minimums. The accuracy turned out to be 0.8763. Research about convergence required the creation of convergence charts for both configurations. An examination of these graphs confirms how the optimization system reached stability shortly after its initial few iterations and did not attain any additional improvement after the fifth step. The identical convergence patterns showed that the model was not trapped in a local minima problem.
The selected iteration count reached optimal performance within five iterations because unnecessary computational overhead was avoided, thus making it appropriate for resource-constrained wearable systems.A comparison of convergence curves appears in Figure 12, having swarm_size=30 with sub-figure a) representing max_iter = 5 while sub-figure b) represents max_iter = 12.
3.4 Classification through MLP
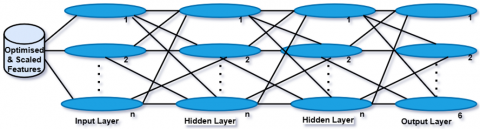
Our MLP network model identified activities in these three datasets, i.e., HCI, WISDM, and HMP, and it delivered good predictions when the inputs and outputs were linked properly. Our MLP network model contains one input layer plus one or more hidden layers before the output layer, which produces predicted results. This system finds links between what enters the system and what it produces using activation methods. Our learning process adjusts weight and bias values until achieving the required loss performance target [13]. We explored various layers and activation functions to determine optimal values for learning rate and regularization strength [14, 15]. In an MLP, the output of a lone neuron in the hidden and output layer is mathematically implied as:
$z k=\sum_{i=1}^n w k i . x i+b k$ (13)
$a k=f(z k)$ (14)
where, zk is weighted sum of inputs, wki is the weight connecting the ith input to kth neuron, xi is the ith input, bk is the bias term and f(zk) is the activation function.
In context of HCI data our experiment's hyperparameter grid uses GridSearchCV to analyze the impact of various MLP settings including hidden units, activation functions, regularization strength, and learning rate values. GridSearchCV was applied to optimize MLP architecture tuning by evaluating multiple hidden layer combinations such as (100,), (100, 50), (100, 100), and (200, 100) while adjusting activation functions (relu, tanh) and regularization (alpha) and learning rate strategies. The best MLP model performs predictions and testing according to results from cross-validation. Our model testing uses accuracy results alongside confusion matrix and classification reports to show how well it separates different classes. Figure 13 shows the MLP detailed structure over HCI data.
Figure 13. MLP over HCI dataset
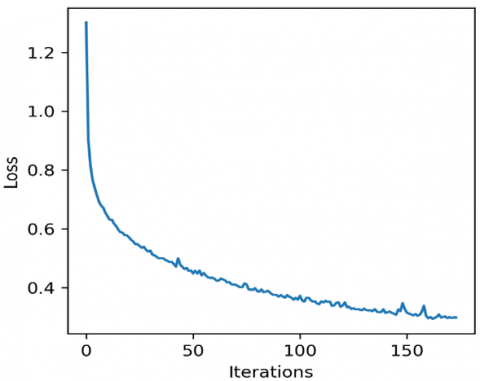
Figure 14. Training loss curve showing convergence
The training loss curve in Figure 14 displays a consistent and descending pattern, which proves model convergence during 200 iterations to guarantee proper training operation.
After completing a 5-fold cross-validation process, the final configuration is shown in Table 2.
Table 2. Final Hyperparameter settings for MLP Classifier Identified via GridSearchCV
|
Hyperparameter |
Optimal Value |
|
Hidden Layer Sizes |
(100, 100) |
|
Activation |
tanh |
|
Alpha |
0.001 |
|
Learning Rate |
Constant |
|
Learning Rate Init |
0.001 |
3.4.1 Computation Time and Resource Utilization of PSO
A study on the PSO-based feature selection approach involved runtime measurements as well as hardware resource analysis during the offline training phase. The summary of execution details and key parameters exists in Table 3.
Table 3. Computation time and resource utilization during the PSO-based feature selection
|
Parameter |
Description/Value |
|
Swarm size |
30 |
|
Maximum iterations |
12 |
|
Machine specifications |
Intel Core i7 CPU,16 GB RAM |
|
Execution time(T) |
1490 seconds |
|
Computational complexity |
O(P*I*T) |
|
Inference phase usage |
Not applicable (PSO runs offline during training time) |
|
Real-time suitability |
Achieved using light weight MLP with reduced feature set |
The study determines how well the suggested activity recognition system performs across three independent sensor data sets. This research shows how the system combines feature enhancement with Multilayer Perceptron to classify activities while measuring it versus current field methods.
4.1 Datasets description
4.1.1 UCI HAR dataset
The University of Genoa's Laboratory for Nonlinear Complex Systems in Italy developed the UCI HAR dataset which contains measurement data from 30 volunteers [16]. It was created to recognize six human activities: Simply put our activities include walking at all levels plus sitting standing and resting. Thirty individuals between 19 and 48 years old each used smartphones with built-in accelerometers and gyroscopes worn on their waist to generate the test data. The team collected data at 50 samples per second.
4.1.2 Human Motion Primitives (HMP) dataset
The HMP Dataset emerged to support research on standardizing human activity understanding systems. Data collection involved 16 volunteer participants consisting of 11 men and 5 women with a mean age of 57.4 years. A wide sample age span provides diverse data collection for applications beyond demographic or purpose specification. A separate measurement sequence stands as a trial that logs full three-dimensional acceleration data during one complete movement execution [17]. The dataset deals with basic movements such as brush teeth, stairs climbing, comb hair, descend stairs, drink with glass, eat meat, eat soup, get up bed, lie down bed, pour water, sit down on chair, stand up from chair and walking through wearable device readings. HMP tracks how different users perform their actions with various devices, proving useful for testing activity recognition models in multiple conditions.
4.1.3 Wireless Sensor Data Mining (WISDM) dataset
Researchers at Fordham University in USA created the WISDM dataset [18]. The researchers built this dataset to understand how people used their phones by measuring their motion. The WISDM dataset records five everyday activities like walking, jogging, sitting, standing, and stair climbing using a sampling rate of 20 Hz. Participants completed regular tasks while placing their phones in front pockets to build a dataset that reflects daily use. Recorded data that continues over time makes this dataset hard to process but also makes it useful for training machine learning systems to work better.
4.2 Performance metrics and results
This report displays MLP model results as confusion matrices for the HCI HMP and WISDM datasets. The model succeeded in determining precise activity types across the different datasets.
4.2.1 Experimental I: Class recognition accuracy
The classification accuracies of the datasets that are in use are disclosed in Table 4 as a confusion matrix for HCI, Table 5 as a confusion matrix for HMP, and Table 6 as a confusion matrix for WISDM dataset.
Table 4. Recognition accuracy confusion matrix upon HCI dataset
|
Classes |
Wlk |
WlkUp |
WlkDn |
Sit |
Stand |
Laying |
|
Wlk |
93 |
4 |
2 |
0 |
0 |
1 |
|
WlkUp |
0 |
94 |
5 |
0 |
1 |
0 |
|
WlkDn |
10 |
5 |
84 |
0 |
1 |
0 |
|
Sit |
0 |
0 |
0 |
78 |
15 |
7 |
|
Stand |
1 |
2 |
0 |
13 |
73 |
11 |
|
Laying |
1 |
0 |
0 |
6 |
5 |
88 |
|
Mean Accuracy rate = 85% |
||||||
Table 5. Recognition accuracy confusion matrix upon HMP dataset
|
Classs |
BrshTth |
ClmbStr |
CmbHr |
Dsc Str |
Drk Gl |
EtMt |
EtSp |
GtUpBd |
LdDnBd |
Pr Wtr |
StDnChr |
StdUpChr |
Wlk |
|
Brsh Tth |
100 |
0 |
0 |
0 |
0 |
0 |
0 |
0 |
0 |
0 |
0 |
0 |
0 |
|
Clmb Str |
0 |
79 |
0 |
1 |
0 |
0 |
0 |
3 |
3 |
0 |
0 |
0 |
14 |
|
CmbHr |
0 |
0 |
100 |
0 |
0 |
0 |
0 |
0 |
0 |
0 |
0 |
0 |
0 |
|
DscStr |
0 |
0 |
0 |
100 |
0 |
0 |
0 |
0 |
0 |
0 |
0 |
0 |
0 |
|
DrkGl |
0 |
0 |
0 |
0 |
94 |
5 |
0 |
0 |
0 |
1 |
0 |
0 |
0 |
|
EtMt |
0 |
0 |
0 |
0 |
1 |
99 |
0 |
0 |
0 |
0 |
0 |
0 |
0 |
|
EtSp |
0 |
0 |
0 |
0 |
0 |
0 |
100 |
0 |
0 |
0 |
0 |
0 |
0 |
|
GtUp Bd |
0 |
0 |
1 |
0 |
0 |
0 |
0 |
89 |
3 |
0 |
5 |
2 |
0 |
|
LdDn Bd |
0 |
0 |
0 |
0 |
0 |
0 |
0 |
0 |
100 |
0 |
0 |
0 |
0 |
|
PrWtr |
0 |
0 |
0 |
0 |
1 |
1 |
0 |
0 |
0 |
98 |
0 |
0 |
0 |
|
StDn Chr |
0 |
0 |
0 |
0 |
0 |
0 |
0 |
5 |
0 |
0 |
94 |
1 |
0 |
|
StdUpChr |
0 |
0 |
0 |
0 |
0 |
0 |
0 |
2 |
2 |
0 |
0 |
96 |
0 |
|
Wlk |
0 |
14 |
0 |
3 |
1 |
0 |
0 |
2 |
0 |
0 |
0 |
4 |
76 |
|
Mean Accuracy =94% |
|||||||||||||
Table 6. Recognition accuracy confusion matrix upon WISDM dataset
|
Classes |
Downstairs |
Jogging |
Sitting |
Standing |
Upstairs |
Walking |
|
Downstairs |
84 |
4 |
0 |
0 |
11 |
1 |
|
Jogging |
2 |
93 |
0 |
0 |
3 |
2 |
|
Sitting |
0 |
0 |
100 |
0 |
0 |
0 |
|
Standing |
0 |
0 |
0 |
100 |
0 |
0 |
|
Upstairs |
10 |
8 |
0 |
0 |
79 |
3 |
|
Walking |
1 |
2 |
0 |
0 |
0 |
97 |
|
Mean Accuracy=92% |
||||||
4.2.2 Experimental II: Precision, Recall, F1 Measure and Precision
This part shows results on four evaluation metrics (Precision, Recall, and F measures and Support) and selected class performance for arbitrary datasets. Analysis reveals that the developed system successfully detects multiple types of human behavior with high accuracy. Our computations of activity class performance relied on Eqs. (15)-(18) across the datasets.
Precision $=\frac{T P}{T P+F P}$ (15)
Recall $=\frac{T P}{T P+F N}$ (16)
$F$ measure $=\frac{2(\text { Precision } * \text { Recall })}{\text { Precision }+ \text { Recall }}$ (17)
Support $=T P+F N$ (18)
Table 7. Precision, Recall, F1 Measure, and Support for HCI Dataset
|
HCI Dataset |
||||
|
Classes |
Precision |
Recall |
F1 Measure |
Support |
|
Wlk |
0.93 |
0.93 |
0.93 |
247 |
|
WlkUp |
0.85 |
0.94 |
0.89 |
200 |
|
WlkDn |
0.93 |
0.83 |
0.88 |
206 |
|
Sit |
0.79 |
0.79 |
0.79 |
262 |
|
Stand |
0.83 |
0.73 |
0.77 |
276 |
|
Laying |
0.78 |
0.88 |
0.83 |
280 |
|
Mean Accuracy=85% |
||||
Table 8. Precision, Recall, F1 Measure, and Support for HMP Dataset
|
HMP Dataset |
||||
|
Classes |
Precision |
Recall |
F1 Measure |
Support |
|
BrshTth |
1.00 |
1.00 |
1.00 |
119 |
|
ClmbStr |
0.80 |
0.79 |
0.80 |
99 |
|
CmbHr |
0.99 |
1.00 |
1.00 |
113 |
|
DscStr |
0.96 |
1.00 |
0.98 |
113 |
|
DrkGl |
0.98 |
0.93 |
0.95 |
130 |
|
EtMt |
0.94 |
0.99 |
0.96 |
124 |
|
EtSp |
1.00 |
1.00 |
1.00 |
119 |
|
GtUpBd |
0.85 |
0.89 |
0.87 |
106 |
|
LdDnBd |
0.93 |
1.00 |
0.96 |
102 |
|
PrWtr |
0.99 |
0.98 |
0.99 |
113 |
|
StDnChr |
0.96 |
0.94 |
0.95 |
126 |
|
StdUpChr |
0.92 |
0.96 |
0.94 |
98 |
|
Wlk |
0.87 |
0.76 |
0.81 |
133 |
|
Mean Accuracy rate = 94% |
||||
Table 9. Precision, Recall, F1 Measure and Support for WISDM Dataset
|
WISDM Dataset |
||||
|
Classes |
Precision |
Recall |
F1 Measure |
Support |
|
Downstairs |
0.86 |
0.84 |
0.85 |
97 |
|
Jogging |
0.87 |
0.93 |
0.90 |
97 |
|
Sitting |
1.00 |
1.00 |
1.00 |
97 |
|
Standing |
1.00 |
1.00 |
1.00 |
96 |
|
Upstairs |
0.84 |
0.78 |
0.81 |
97 |
|
Walking |
0.94 |
0.97 |
0.95 |
97 |
|
Mean Accuracy=92% |
||||
Our system detects real positives as TP, Problematic results as FP, and missed events as FN. The support figure tracks absolute true activity instance counts for each class in database records. Our proposed MLP classifier produces quality results (metrics and support levels) for every dataset through Tables 7-9.
Table 10. A Comparative study with current methods on the HCI, HMP and WISDM Datasets
|
Methods |
HCI Dataset |
HMP Dataset |
WISDM Dataset |
|
Xu et al. (using LSTM) [19] |
80.90% |
--- |
--- |
|
Xu et al. (using Conv_ID) [19] |
85% |
--- |
--- |
|
Chin et al. (using Random forest [20] |
--- |
90.7% |
--- |
|
Chin et al. (using SVM [20] |
--- |
91.5% |
--- |
|
Xu et al. (using MLP) [19] |
--- |
--- |
86.95% |
|
Xu et al. (using LSTM) [19] |
--- |
--- |
87.53% |
|
Proposed Approach |
85% |
94% |
92% |
Table 11. Comparison of MLP and other architectures in terms of efficiency, memory use, and robustness to noise
|
Model |
Time Complexity |
Space Complexity |
Robustness to Noise |
|
Transformer |
O(n*m2) |
O(n*m2) |
Medium (Sensitive) |
|
Lightweight CNN |
O(n*m*k) |
O(m*k) |
Medium (Requires fine tuning) tunning) |
|
LSTM |
O(n*m*t) |
O(m*h) |
Low (Sensitive to noise) |
|
Proposed MLP |
O(n*m*h) |
O(m*h) |
High (Stable under noise) |
The Table 10 compares how well the proposed method works for detecting human motions against leading research approaches on three different datasets.
Extended Comparative Analysis Beyond Accuracy. The practical implementation of wearable-based HAR systems requires high emphasis on computational efficiency alongside low memory usage while maintaining robustness against sensor noise since these systems have restricted device resources and operate in variable conditions. The proposed MLP model demonstrates enhanced functionality as a resource-efficient solution for HAR applications since it performs better than complex models, including Transformers and LSTMs in terms of memory usage and deployment simplicity. Evaluation of the proposed MLP model relative to emerging architectures for their computational efficiency and memory requirements, along with their ability to resist noise impacts is shown in Table 11 where the variables include h for hidden neurons, n for data samples, m for features, the kernel size equals k, and the t represents time steps.
Some obstacles exist in deploying the proposed system for HAR when using wearable sensor data. One major limitation is the generalizability of the dataset, as the employed datasets (HCI, HMP, and WISDM) are collected in controlled environments. Real-world dynamic application scenarios are challenging for the model since they require different sensor placements and changing environmental factors and subject behaviors to determine classification accuracy.
The HMP, WISDM, and HCI datasets provide their data within controlled environmental conditions that limit their general application to real-world operations with flexible sensor positions and natural ecological interferences. The incorporation of median filtering and Hamming windowing in our framework serves to improve noise-resistant capabilities and reduce spectral leakage. So our model can perform well in data processing in real-world scenarios. The model will be subject to validity tests in our future work by evaluating its deployment readiness through experiments using data from uncontrolled environments.
5.1 Limitations of sensor fusion and single-sensor scenarios
There is effective sensor fusion through accelerometer-gyroscope combinations based on HCI datasets, although these multiple-sensor systems do not necessarily exist practically because hardware limitations or budgetary restrictions make them impractical. The system needs to maintain reliable functioning when provided with single-sensor data. The performance evaluation involved analyzing results from both the WISDM and HMP datasets because their data collection included only accelerometer measurements. The model demonstrated robust performance during operation with only accelerometer sensor data, which confirmed its capability to run using a single sensor. The sole utilization of sensor data led to decreased performance for detecting activities that require both high-dynamic actions and orientation sensitivity. Our experiment results showed that our proposed method still performs successfully even when only a limited number of sensors are available.
5.2 Deployment considerations on resource constrained devices
The proposed MLP model achieves computational and memory efficiency effectively since its running time operates at O (n × m × h) while using only O (m × h) storage space. The model functions effectively on wearable devices through its performance-related features, which meet processing and memory limits.
Real-time implementation of the model on embedded systems faces compliance issues due to hardware limitations that affect RAM capacity along with CPU performance and battery consumption. These problems require solutions that bring the following benefits to the model:
(1) The model has a minimalist design that consists of a few layered connections.
(2) The feature optimization process happens offline through PSO to lower runtime requirements.
(3) The implementation utilizes processed and chosen features, which both decrease input dimensions while minimizing computational loads.
5.3 Error analysis and misclassification patterns
The confusion matrices showed some wrong classifications, especially when the model confused Sit with Stand during HCI dataset activity monitoring. The sensor signal patterns from these activities maintain close similarities, which results in overlapping accelerometer and gyroscope sensor measurements, mainly affecting the vertical axis. The overall model performance remains strong, but slight variations in movement between activities cause challenges in correct classification.
Future development of the feature extraction method should include orientation-based features because they help identify subtle patterns in addition to temporal characteristics. The model requires additional sensor fusion methods together with improved models to better detect activities when movement is minimal.
This work shows how to correctly detect human actions through measurements taken from wearable sensors. Data from sensors goes through 4th-order median filtering before receiving improved signal quality through the application of a Hamming window as preprocessing steps. Our approach develops and optimizes feature selection from processed signals to reveal important activity patterns through PSO. The system employs an MLP classifier to recognize activities through optimized features because MLP displays effective generalization and learning skills.
The system's performance is evaluated on three prominent datasets: HCI, HMP, and WISDM. Our approach shows reliable performance with 85% accuracy on HCI data while reaching 94% and 92% accuracy for HMP data and WISDM data, respectively. Our analysis demonstrates that merging pre-processing steps with feature extraction and MLP classification works effectively. Our method proves useful in real-world scenarios like fitness monitoring systems and healthcare platforms, showing clear capability in recognizing activities effectively from wearable sensor data.
This research is supported and funded by Princess Nourah bint Abdulrahman University Researchers Supporting Project number (PNURSP2025R410), Princess Nourah bint Abdulrahman University, Riyadh, Saudi Arabia.
|
HAR |
Human Activity Recognition |
|
HMP |
Human Motion Primitives |
|
MLP |
Multi-layer Perceptron |
|
PSO |
Particle Swarm Optimization |
[1] Huang, W., Zhang, L., Wu, H., Min, F., Song, A. (2022). Channel-equalization-HAR: A light-weight convolutional neural network for wearable sensor based human activity recognition. IEEE Transactions on Mobile Computing, 22(9): 5064-5077. https://doi.org/10.1109/TMC.2022.3174816
[2] Huang, W.B., Zhang, L., Wang, S.Y., Wu, H., Song, A.G. (2022). Deep ensemble learning for human activity recognition using wearable sensors via filter activation. ACM Transactions on Embedded Computing Systems, 22(1): 1-23. https://doi.org/10.1145/3551486
[3] Gumaei, A., Al-Rakhami, M., AlSalman, H., Rahman, S. M. M., Alamri, A. (2020). DL-HAR: Deep learning-based human activity recognition framework for edge computing. computers, Materials & Continua, 65(2): 1033. https://doi.org/10.32604/cmc.2020.011740
[4] Qi, W., Su, H., Aliverti, A. (2020). A smartphone-based adaptive recognition and real-time monitoring system for human activities. IEEE Transactions on Human-Machine Systems, 50(5): 414-423. https://doi.org/10.1109/THMS.2020.2984181
[5] Semwal, V.B., Gaud, N., Lalwani, P., Bijalwan, V., Alok, A.K. (2022). Pattern identification of different human joints for different human walking styles using inertial measurement unit (IMU) sensor. Artificial Intelligence Review, 55(2): 1149-1169. https://doi.org/10.1007/s10462-021-09979-x
[6] Vavoulas, G., Chatzaki, C., Malliotakis, T., Pediaditis, M., Tsiknakis, M. (2016). The mobiact dataset: Recognition of activities of daily living using smartphones. In International Conference on Information and Communication Technologies for Ageing Well and E-Health, pp. 143-151. https://doi.org/10.5220/0005792401430151
[7] Bhattacharjee, S., Kishore, S., Swetapadma, A. (2018). A comparative study of supervised learning techniques for human activity monitoring using smart sensors. In 2018 Second International Conference on Advances in Electronics, Computers and Communications (ICAECC), pp. 1-4. https://doi.org/10.1109/ICAECC.2018.8479436
[8] Gupta, P., Dallas, T. (2014). Feature selection and activity recognition system using a single triaxial accelerometer. IEEE Transactions on Biomedical Engineering, 61(6): 1780-1786. https://doi.org/10.1109/TBME.2014.2307069
[9] Shami, T.M., El-Saleh, A.A., Alswaitti, M., Al-Tashi, Q., Summakieh, M.A., Mirjalili, S. (2022). Particle swarm optimization: A comprehensive survey. IEEE Access, 10: 10031-10061. https://doi.org/10.1109/ACCESS.2022.3142859
[10] Mohd Yamin, M.N., Ab. Aziz, K., Siang, T.G., Ab. Aziz, N.A. (2023). Particle swarm optimisation for emotion recognition systems: A decade review of the literature. Applied Sciences, 13(12): 7054. https://doi.org/10.3390/app13127054
[11] Wang, J., Wang, X., Li, X., Yi, J. (2023). A hybrid particle swarm optimization algorithm with dynamic adjustment of inertia weight based on a new feature selection method to optimize SVM parameters. Entropy, 25(3): 531. https://doi.org/10.3390/e25030531
[12] Gad, A.G. (2022). Particle swarm optimization algorithm and its applications: A systematic review. Archives of Computational Methods in Engineering, 29(5): 2531-2561. https://doi.org/10.1007/s11831-021-09694-4
[13] Huda, A.S.N., Taib, S.A. (2014). A comparative study of MLP networks using backpropagation algorithms in electrical equipment thermography. Arabian Journal for Science and Engineering, 39: 3873–3885. https://doi.org/10.1007/s13369-014-0989-7
[14] Koutsoukas, A., Monaghan, K.J., Li, X., Huan, J. (2017). Deep-learning: Investigating deep neural networks hyper-parameters and comparison of performance to shallow methods for modeling bioactivity data. Journal of Cheminformatics, 9(1): 42. https://doi.org/10.1186/s13321-017-0226-y
[15] LeCun, Y., Bengio, Y., Hinton, G. (2015). Deep learning. Nature, 521(7553): 436-444. https://doi.org/10.1038/nature14539
[16] Anguita, D., Ghio, A., Oneto, L., Parra, X., Reyes-Ortiz, J.L. (2013). A public domain dataset for human activity recognition using smartphones. In Proceeding of the 21st European Symposium on Artificial Neural Networks, Computational Intelligence and Machine Learning (ESANN), Bruges, Belgium, pp. 437-442. https://www.esann.org/sites/default/files/proceedings/legacy/es2013-84.pdf.
[17] Bruno, B., Mastrogiovanni, F., Sgorbissa, A. (2014). A public domain dataset for ADL recognition using wrist-placed accelerometers. In the 23rd IEEE International Symposium on Robot and Human Interactive Communication, Edinburgh, UK, pp. 738-743. https://doi.org/10.1109/ROMAN.2014.6926341
[18] Kwapisz, J.R., Weiss, G.M., Moore, S.A. (2011). Activity recognition using cell phone accelerometers. ACM SigKDD Explorations Newsletter, 12(2): 74-82. https://doi.org/10.1145/1964897.1964918
[19] Xu, H., Li, J., Yuan, H., Liu, Q., Fan, S., Li, T., Sun, X. (2020). Human activity recognition based on Gramian angular field and deep convolutional neural network. IEEE Access, 8: 199393-199405. https://doi.org/10.1109/ACCESS.2020.3032699
[20] Chin, Z.H., Ng, H., Yap, T.T.V., Tong, H.L., Ho, C.C., Goh, V.T. (2018). Daily activities classification on human motion primitives detection dataset. In Computational Science and Technology: 5th ICCST 2018, Kota Kinabalu, Malaysia, pp. 117-125. https://doi.org/10.1007/978-981-13-2622-6_12