Lütfiye Nurel Özdinç Polat*![]() | Şükrü Özen
| Şükrü Özen![]()
© 2025 The authors. This article is published by IIETA and is licensed under the CC BY 4.0 license (http://creativecommons.org/licenses/by/4.0/).
OPEN ACCESS
Audiological testing is important for correctly diagnosing hearing problems and making appropriate treatment plans. During the audiological test, it is important to reveal which sub-frequency bands of the electroencephalogram (EEG) dominate, and which electrode regions have simultaneous activation for determination of the effects of the audiological test on the brain electrical activity. The purpose of this study is to determine the changes caused by the audiologic test process in the brain activity of individuals. The EEG signals were obtained from 36 volunteers during audiological testing and at rest. The EEG data were analyzed to show the effects of the test process according to the resting state. Dual electrode coherence analyses were performed for delta, theta, alpha, beta and gamma sub-frequency bands of EEG signals. In the study, neural activation in frontal and temporal positions was also examined using wavelet coherence during the audiological test task. In the study, it was also attempted to determine whether the coherence values of the electrode pairs could be used to distinguish between resting and audiological test conditions through the classification process. At this stage, an attempt was made to determine the most effective EEG sub-bands that distinguish resting and audiological test status. The results showed that there was a high coherence in the changes in alpha, theta and delta bands, especially in the symmetric temporal region, throughout the audiological test process. It seems that the sub-frequency bands of EEG signals in the audiological testing process in participants can be distinguished by coherence analysis.
audiological test, EEG, physiological effect, EEG coherence analysis, magnitude square coherence
The human ear is an excellent organ that can analyze sounds of different frequencies [1]. Hearing loss causes communication disorders in children and adults. There are difficulties in understanding and distinguishing speech, depending on the age, type, degree, and configuration of the onset and diagnosis of hearing loss. Hearing thresholds can be determined by audiometric tests, and these tests provide relevant data for the detection of hearing loss due to birth, aging, and noise. Hearing sensitivity should also be evaluated with speech stimuli. Speech tests developed for this purpose are used in the differential diagnosis of hearing loss, determining how hearing loss affects speech understanding performance, deciding on a hearing aid, and determining audiological rehabilitation and its benefits [2]. Today, audiological tests are frequently performed in clinics to determine the degree of hearing loss of individuals and to determine whether they have hearing loss.
Electrophysiological measurements allow for better differential diagnosis of the auditory system and may also have the potential to lead to the development of auditory prostheses that automatically adapt to individual users [3]. Iotzov and Parra [4] stated that simultaneous recordings of perceived sound and EEG responses may be a practical method for assessing speech intelligibility in hearing aid users.
Electroencephalography is an effective method that helps to receive brain signals corresponding to various conditions from the scalp surface area. These signals are generally classified into sub-frequency bands according to specific signal frequency ranges such as delta, theta, alpha, beta, and gamma [5]. Analysis of EEG signals reflects the electrical activity of brain behavior [6].
Coherence is a mathematical technique that measures the frequency and amplitude of synchronization of neuronal patterns of oscillatory brain activity. In the literature, there are studies in which coherence analyses of different frequency subbands and different electrode regions for different activities are performed [7-25].
The coherence technique measures neuronal synchronization patterns between spatially separated scalp electrodes [8-12, 14, 16, 18-25]. In addition, there are studies in the literature in which coherence assessments are made between EEG signals and EMG (Electromyogram) [13, 15] and ECG (Electrocardiogram) signals for different problems [17]. For example, EEG-EMG coherence analysis has been indicated as an effective method to examine functional connectivity between the brain and muscles [13].
In the related study, where it was stated that EEG coherence is one of the most related physiological measures used to detect abnormalities in schizophrenia patients [8]. González-Garrido et al. [9] stated that EEG coherence is an EEG data that measures how different parts of the brain work together and compared EEG coherence in children with different levels of mathematical ability.
Seleznov et al. [10] analyzed EEG recordings from 36 individuals at rest and during mental serial subtraction in four different frequency ranges. Clarke et al. [11] investigated EEG coherence in adults with attention deficit and hyperactivity disorder in their study. They stated that theta coherence differences may be related to decreased hyperactivity in adulthood, while decreased alpha coherence may be related to inattention. Cheung et al. [12] in their study involving 60 participants, 30 of whom had received at least one year of musical training and 30 of whom had no musical training, they stated that musical training was related to cortical synchronization reflected in EEG coherence during verbal memory encoding. Xi et al. [13] stated in their study that EEG-EMG coherence analysis is an effective method to examine the functional connection between the brain and muscles. Leocani et al. [14] examined functional corticocortical connections in multiple sclerosis using EEG coherence to assess how much cognitive impairment these connections cause and how they relate to the density of lesions seen on MRI.
Guerrero-Mendez and Ruiz-Olaya [15] investigated the corticomuscular connection between EMG and EEG signals during movements of reaching, grasping, lifting, holding and putting away an object. Kamzanova et al. [16] discussed the diagnosis of an alternative set of electroencephalograph measurements and the coherence between different regions. Coherence was calculated for seven predefined brain networks. Workload and tenure factors primarily affected theta and alpha coherence in anterior, central, and interhemispheric networks.
Bhat and Satpute [17] examined the degree of correlation between ECG and EEG signals by using Wavelet coherence and compared them using Morlet wavelet and Complex Gaussian wavelet. Achermann and Borbély [18] performed the human sleep EEG coherence analysis in their study. They concluded that the coherence analysis could provide insight into the large-scale functional connectivity of brain regions during sleep.
Polat and Özerdem [19] aimed to automatically detect emotions related to audio-visual stimuli with the EEG coherence approach. They performed the coherence analysis for the gamma band of the EEG signals. They found the average classification accuracy to be 83.5% for four different participants [19]. Basharpoor et al. [20] examined the relationship between executive functions and frontal EEG coherence in theta, alpha, and beta sub-bands in adults. Adler et al. [21] evaluated the usefulness of EEG coherence for the diagnosis of Alzheimer's dementia. Boldyreva and Zhavoronkova [22] used EEG coherence analysis to study aspects of synchronization of electrical processes in the left and right cerebral hemispheres in the quiet wakefulness state of left- and right-handed healthy subjects. Left-handed subjects showed greater coherence in the right hemisphere, while right-handed subjects showed greater coherence in the left hemisphere. Comi et al. [23] EEG coherence in Alzheimer’s and multi-infarct dementia study on 41 MID and 61 Alzheimer’s Disease (AD) patients. They compared EEG coherence in MID and AD to assess whether topographical coherence changes could distinguish between the two main types of dementia. As a result of the study, alpha band coherence decreased significantly in both groups, while delta band coherence increased especially in MID patients. Unde and Shriram [24] stated the coherence of EEG varies with frequency to examine the coordination mechanism of the brain. Wang et al. [25] investigated the abnormalities of EEG signals in Alzheimer's disease by analyzing them and comparing them with normal controls.
In a previous study, the effects of the audiological testing process were evaluated using a one-dimensional convolutional neural network from galvanic skin response (GSR) data that varied according to physiological changes due to situations such as stress [26].
This study aims to examine the coherence between channels and sub-frequency bands of EEG data obtained from healthy volunteers for resting states and audiological tests, and to determine functional interactions between neural regions. Thus, during the audiological test, it is revealed that the activation in which electrode regions for which sub-frequency band contains simultaneity.
With this study, the impacts of the audiological testing process on brain activity were investigated based on coherence analysis, as well as determining speech intelligibility, which will benefit those with speech disorders and hearing problems in more comprehensive evaluations. The next section of the study includes the method followed and the findings obtained in the next section.
In this study, EEG recordings were taken from 36 healthy participants at the Audiology Unit of the Otorhinolaryngology Department of Akdeniz University Hospital, first at rest and then while they were subjected to a speech intelligibility test in a special isolated room where audiological evaluations were made.
2.1 Data collection
In the study, the speech discrimination test used in speech audiology was used to determine speech intelligibility. After this test, the speech reception threshold and speech discrimination threshold levels were determined by the expert beforehand for healthy volunteers. The demographic information of the volunteers participating in this study is given in Table 1 (This study protocol was reviewed and approved by Akdeniz University, Faculty of Medicine, Clinical Research Ethics Committee).
Table 1. The demographics of volunteers
|
|
|
Frequency |
Percent |
|
Gender |
Female |
23 |
63.9 |
|
Male |
13 |
36.1 |
|
|
∑ |
36 |
100 |
|
|
Age |
18 - 30 |
18 |
50.0 |
|
31 - 50 |
18 |
50.0 |
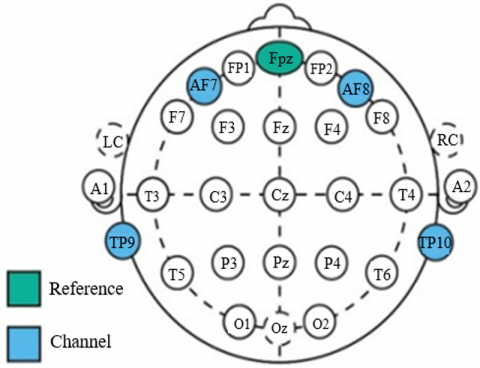
In the study, an EEG recording was taken using a 4-channel mobile EEG headband (Muse EEG headband). The EEG headband used receives data with 4 electrodes (from channels AF7, AF8, TP9, and TP10). Figure 1 shows EEG electrode positions and muse headband.
Figure 1. Display of EEG electrode positions and muse headband (InteraXon Inc. Canada)
2.2 Test methods that assess speech
The audiological testing phase of the study was performed in a special isolated room using the clinical audiometer system together with TDH 50 headphones.
Sound generators that produce pure sound and are used for the evaluation of peripheral hearing are called audiometers. An audiogram is a graph used to determine a person's hearing level and diagnose diseases related to hearing loss. In determining the degree of hearing loss, the pure tone average is taken as the basis. The pure tone average is obtained by calculating the average of hearing thresholds at 500, 1000, and 2000 Hz [2, 27].
The second most important phase of the audiological evaluation is the evaluation of speech understanding and speech discrimination. An audiological assessment without speech audiometry is incomplete. Speech audiometry measures the distance a person can understand what is being said [2, 27].
Speech Reception Threshold (SRT): The individual is asked to repeat two or three-syllable words starting from the most comfortable listening level. It is aimed to determine the lowest hearing level (in dB) that can be exactly repeated [1, 2].
Speech Awareness Threshold (SAT): It is applied both to determine the reliability of pure tone hearing thresholds and to have an idea about the patient's hearing in cases where the speech recognition threshold cannot be obtained. It is the minimum intensity level at which the person is aware of the speaking voice. The difference with SRT is that the person does not understand the sound but only realizes that the sound is coming. It can be obtained from the airway and bone pathways [1, 2].
Speech Discrimination (SD): The patient's hearing loss may cause problems in understanding. Decreased understanding of speech can be a sign of many diseases besides hearing loss. The purpose of the speech discrimination test is to make the patient repeat the single-syllable word that is the most difficult to guess at the sound intensity level that he can hear most comfortably [1, 2].
2.3 Coherence analysis
The coherence measure used to evaluate the synchrony between two signals is widely applied in EEG analyses to determine cortical functional connectivity [28]. Coherence measures whether, in each frequency sub-band, the two signals can be associated with a linear time-invariant transformation, that is, with a constant amplitude ratio and phase shift [29].
Coherence analysis can help understand how different brain regions work with each other and synchronization in different frequency bands. During the audiological test, determining which sub frequency bands work the most coordinated will contribute to the understanding of the effects of the test process on the brain activity of individuals.
Wavelet Coherence Analysis: Wavelet coherence can detect regions in time-frequency space where the studied time series move together [30]. Wavelet coherence analysis is an effective method to study cortical connectivity at a high temporal resolution [28].
The wavelet cross spectrum of x and y stretching is expressed in Eq. (1):
$C_{x y}(a, b)=S\left(C_x(a, b) C_y^*(a, b)\right)$ (1)
Here $C_{x y}(a, b)$ and $C_y(a, b)$ are wavelet transforms at x and y scales a and b, $S$: indicates the smoothing function, ∗: means complex conjugate, here, the wavelet coherence of the x and y signals can be defined as in Eq. (2) below [31]:
$W C_{x y}(a, b)=\frac{s\left(c_x(a, b) c_y^*(a, b)\right)}{\sqrt{c_x(a, b)^2} \sqrt{c_y(a, b)^2}}$ (2)
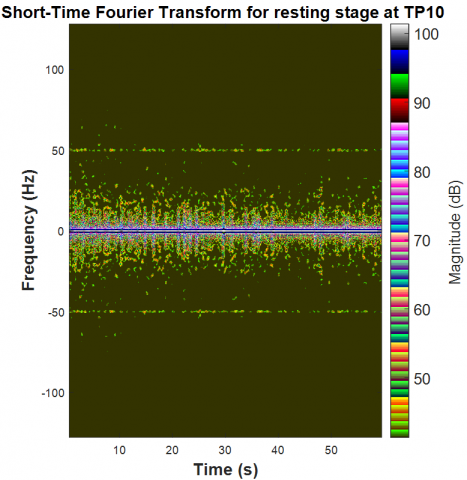
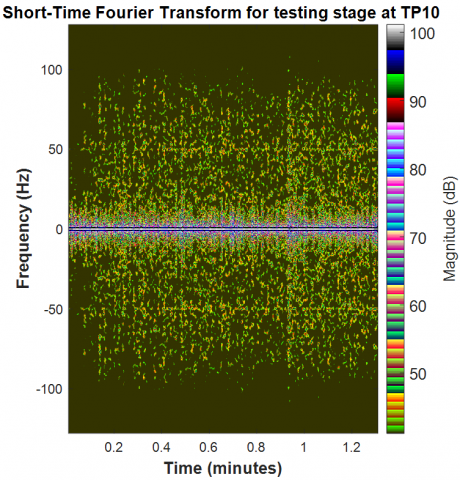
In the study, time-frequency changes in the sample TP10 channel of a volunteer taken during rest and testing are shown in Figure 2(a) and Figure 2(b), respectively. About 1 minute of recording was taken for the resting state, and from the changes in the shape, it is seen that higher frequency components are formed in the spectrum during the audiological test.
(a)
(b)
Figure 2. (a) STFT of a volunteer's EEG signal for the resting phase; (b) STFT of a volunteer's EEG signal for the audiological testing phase
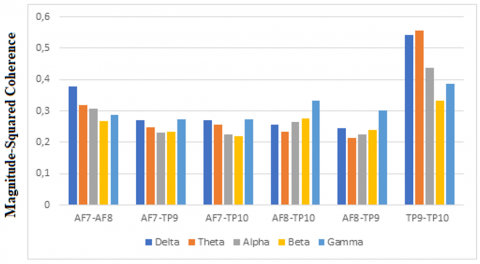
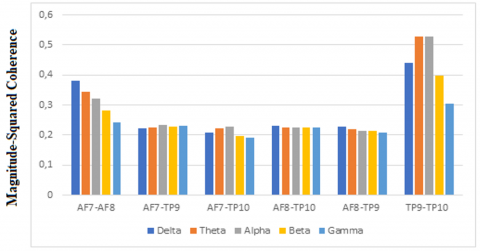
Figure 3(a) shows the average changes of the different dual electrode coherences in the EEG sub-bands for the resting state. Accordingly, it was observed that the delta and theta subbands had the highest coherence for the TP9-TP10 electrode pair.
Figure 3(b) shows the average changes of the different dual electrode coherences in the sub-frequency bands of the EEG signal received during the audiological test. As can be seen from the figure, it was observed that the delta, theta and alpha sub-bands had the highest coherence for the TP9-TP10 electrode pair. The coherence of the alpha band was high for these two electrode pairs according to the resting state. In addition, for the beta band, the coherence increased according to the resting state. The temporal lobes are located on both sides of the brain and are close to the ear. Speech perception is important in visual perception, speech memory, language, and processing of stimuli [32, 33].
(a)
(b)
Figure 3. (a) Average coherence changes in sub-frequency bands for the resting state; (b) Average coherence changes in sub-frequency bands for the audiological test case
For the AF7-AF8 electrode pair, the coherence of the beta, alpha, theta and delta sub-bands is slightly increased according to the resting state.
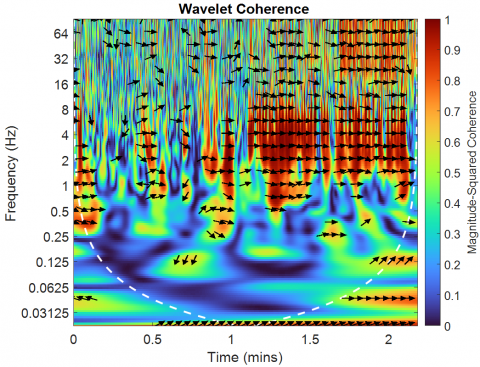
Figure 4 shows the wavelet coherence results between TP9 and TP10 during the audiological testing process of a volunteer. Wavelet coherence graphs highlight the areas in the time-frequency space where the two series move together. Wavelet coherence is represented by a colored contour. Phase relationships between signals are indicated by directed arrows; a positive correlation is represented by an arrow pointing to the right, and a negative correlation by an arrow pointing to the left, with the first variable leading with an arrow pointing down, and an up arrow indicating the second series leading the first [34-36].
Figure 4. Wavelet coherence image of the TP9-TP10 electrode pair of a volunteer's EEG signal for the resting and audiological testing phases
In the change where the phase relationships between signals are shown with directed arrows, there is usually an arrow pointing to the right (The audiological test started approximately 1 minute after the recording for the resting state). When the change in Figure 4 is examined, in the resting phase, there are arrows to the right at short intervals, especially in the frequency range of 0.375 - 8 Hz, whereas in the audiological test phase, there are arrows to the right at almost every moment of the test phase, especially in the frequency range of 0.5 - 12 Hz and also in the frequency range of 16-64 Hz. Accordingly, it can be said that there is a positive correlation for the TP9-TP10 electrode pair in theta and alpha sub-bands during the audiological test. This can also be evaluated as the wavelet coherence analysis, showing more clearly which sub-band has functional connectivity for the relevant electrode pair according to the resting state.
3.1 Determination of resting and audiological test status from coherence values
Within the scope of the study, an attempt was made to determine whether the coherence of electrode pairs can be used to distinguish between resting and audiological test conditions through a classification process.
In this stage, it was also made to determine the most effective EEG sub-bands that distinguish resting and audiological test conditions. By classifying the average values of different pairs of electrode coherences for each sub-frequency band, it was made to determine from the coherence values of the electrode pair for which sub-band the audiological test is more effective compared to the resting state.
At this stage, different Neural Network classifiers such as Wide Neural Network, Bilayered Neural Network, Trilayered Neural Network, and Narrow Neural Network were tried, and the results of the classifier with the highest success were given. In the study, the average coherence values of each of the AF7-AF8, AF7-TP9, AF7-TP10, AF7-TP10, AF8-TP9 and TP9-TP10 electrode pairs were used for each of the 5 sub-frequency bands, and there are 12 data for each sub-band for the resting and test conditions and a total of 60 data.
In the study, 3, 5, and 10-fold cross-validation was performed, and average success results were obtained separately. In the case of using all sub-band data of the coherence values of the electrode pairs in distinguishing the resting and audiological test condition, with Wide Neural Network, one of the neural networks with the highest success, 98.3% classification success was achieved for 3 and 5-fold cross-validation and 100% classification success was achieved for 10-fold cross-validation.
Table 2. Average classification success results obtained using Wide Neural Network for each sub-band
|
Sub-Band |
Accuracy (for 3-fold cross-validation) |
Accuracy (for 5-fold cross-validation) |
Accuracy (for 10-fold cross-validation) |
|
Delta |
% 75 |
% 66.7 |
% 66.7 |
|
Theta |
% 75 |
% 66.7 |
% 66.7 |
|
Alpha |
% 83.3 |
% 83.3 |
% 75 |
|
Beta |
% 83.3 |
% 83.3 |
% 83.3 |
|
Gamma |
% 91.7 |
% 91.7 |
% 91.7 |
In determining the classification of the sub-band distinguishing the resting and audiological test status, the average classification success results obtained separately for each sub-band are given in the Table 2 classification success was achieved for the alpha, beta and gamma sub-bands.
In this study, the coherence of EEG data obtained from healthy volunteers between channels and sub-frequency bands was examined, and functional interactions between neural regions were determined. During the audiological test, it was observed that the coherence increased in the alpha and beta bands, especially for the TP9-TP10 electrode pair, according to the resting state. In the study, the regions where the time series move together for different electrode pairs were determined by wavelet coherence analysis. While the subjects were performing the audiological test, the TP9-TP10 electrode pair showed significant differences in different frequency bands. From here, in the audiological test process, frequency bands appear to be distinguishable by wavelet coherence analysis. In future studies, it is possible to examine the differences in the coherence of different dual electrodes in multi-channel brain activity in individuals with hearing impairment compared to healthy individuals. Considering the high success achieved in the classification of the coherence values of the electrode pairs in distinguishing the resting and audiological test states for the case where all subband data are used, it can be concluded that the audiological test creates a significant difference compared to the resting stage in terms of the coherence values of the electrode pairs.
This study, which will contribute to more comprehensive evaluations in determining the effects of audiological tests on individuals' brain activity; It has been shown that wavelet coherence analysis reveals functional connectivity more clearly for the relevant electrode pair compared to the resting state of the audiological test, and that with the classification, it is possible to confirm for which sub-bands this relationship can be determined from the coherence values.
In this pioneering study, where the effect of the audiological test process on brain activity was evaluated based on consistency analysis, the coherence of EEG data obtained from healthy volunteers for audiological test and resting states was examined for channel and lower frequency bands, and functional interactions between neural regions were determined. Thus, it is revealed that activation in which electrode regions for which lower frequency band during the audiological test contains synchrony.
The audiological tests are applied to individuals who apply to clinics for different reasons in determining the extent to which sound can be heard, both for any hearing problem and for the purpose of documenting that they do not have a hearing problem. Determining the relationship and interactions between brain regions from EEG signals during the audiological test process in this study will contribute to future studies in terms of determining the differences in brain activity of individuals with hearing problems during the audiological test process.
We would like to thank the volunteers who participated in the study, and also the staff of the Audiology Unit of the Akdeniz University Hospital.
[1] Silman, S., Silverman, C.A. (1997). Pure tone audiometry. Basic audiologic testing. In Auditory Diagnosis: Principles and Applications. Delmar Cengage Learning, pp. 111-209. https://books.google.com.tr/books?id=IBoKAAAACAAJ.
[2] Belgin, E., Şahlı, A.S. (2016). Temel Odyoloji 2. Baskı. https://www.guneskitabevi.com/temel-odyoloji-2.baski-1340.
[3] Vanthornhout, J., Decruy, L., Wouters, J., Simon, J.Z., Francart, T. (2018). Speech intelligibility predicted from neural entrainment of the speech envelope. Journal of the Association for Research in Otolaryngology, 19: 181-191. https://doi.org/10.1007/s10162-018-0654-z
[4] Iotzov, I., Parra, L.C. (2019). EEG can predict speech intelligibility. Journal of Neural Engineering, 16(3): 036008. https://doi.org/10.1088/1741-2552/ab07fe
[5] Kumar, J.S., Bhuvaneswari, P. (2012). Analysis of electroencephalography (EEG) signals and its categorization–A study. Procedia Engineering, 38: 2525-2536. https://doi.org/10.1016/j.proeng.2012.06.298
[6] Alturki, F.A., AlSharabi, K., Abdurraqeeb, A.M., Aljalal, M. (2020). EEG signal analysis for diagnosing neurological disorders using discrete wavelet transform and intelligent techniques. Sensors, 20(9): 2505. https://doi.org/10.3390/s20092505
[7] French, C.C., Beaumont, J.G. (1984). A critical review of EEG coherence studies of hemisphere function. International Journal of Psychophysiology, 1(3): 241-254. https://doi.org/10.1016/0167-8760(84)90044-8
[8] Prieto-Alcántara, M., Ibáñez-Molina, A., Crespo-Cobo, Y., Molina, R., Soriano, M.F., Iglesias-Parro, S. (2023). Alpha and gamma EEG coherence during on-task and mind wandering states in schizophrenia. Clinical Neurophysiology, 146: 21-29. https://doi.org/10.1016/j.clinph.2022.11.010
[9] González-Garrido, A.A., Gómez-Velázquez, F.R., Salido-Ruiz, R.A., Espinoza-Valdez, A., Vélez-Pérez, H., Romo-Vazquez, R., Gallardo-Moreno, G.B., Ruiz-Stovel, V.D., Martínez-Ramos, A., Berumen, G. (2018). The analysis of EEG coherence reflects middle childhood differences in mathematical achievement. Brain and Cognition, 124: 57-63. https://doi.org/10.1016/j.bandc.2018.04.006
[10] Seleznov, I., Zyma, I., Kiyono, K., Tukaev, S., Popov, A., Chernykh, M., Shpenkov, O. (2019). Detrended fluctuation, coherence, and spectral power analysis of activation rearrangement in EEG dynamics during cognitive workload. Frontiers in Human Neuroscience, 13: 270. https://doi.org/10.3389/fnhum.2019.00270
[11] Clarke, A.R., Barry, R.J., Heaven, P.C., McCarthy, R., Selikowitz, M., Byrne, M.K. (2008). EEG in adults with attention-deficit/hyperactivity disorder. International Journal of Psychophysiology, 70(3): 176-183. https://doi.org/10.1016/j.ijpsycho.2007.10.001
[12] Cheung, M.C., Chan, A.S., Liu, Y., Law, D., Wong, C.W. (2017). Music training is associated with cortical synchronization reflected in EEG coherence during verbal memory encoding. PloS One, 12(3): e0174906. https://doi.org/10.1371/journal.pone.0174906
[13] Xi, X., Ma, C., Yuan, C., Miran, S.M., Hua, X., Zhao, Y.B., Luo, Z. (2020). Enhanced EEG–EMG coherence analysis based on hand movements. Biomedical Signal Processing and Control, 56: 101727. https://doi.org/10.1016/j.bspc.2019.101727
[14] Leocani, L., Locatelli, T., Martinelli, V., Rovaris, M., Falautano, M., Filippi, M., Magnani, G., Comi, G. (2000). Electroencephalographic coherence analysis in multiple sclerosis: Correlation with clinical, neuropsychological, and MRI findings. Journal of Neurology, Neurosurgery & Psychiatry, 69(2): 192-198. https://doi.org/10.1136/jnnp.69.2.192
[15] Guerrero-Mendez, C.D., Ruiz-Olaya, A.F. (2022). Coherence-based connectivity analysis of EEG and EMG signals during reach-to-grasp movement involving two weights. Brain-Computer Interfaces, 9(3): 140-154. https://doi.org/10.1080/2326263X.2022.2029308
[16] Kamzanova, A., Matthews, G., Kustubayeva, A. (2020). EEG coherence metrics for vigilance: Sensitivity to workload, time-on-task, and individual differences. Applied Psychophysiology and Biofeedback, 45(3): 183-194. https://doi.org/10.1007/s10484-020-09461-4
[17] Bhat, U., Satpute, M. (2023). A comparative study of morlet wavelet coherence & complex gaussian wavelet coherence between ECG and EEG signals. Grenze International Journal of Engineering and Technology. https://www.researchgate.net/profile/Ashutosh-Mishra-3/publication/382557162_AIDS_PCES_Conference_Proceedingspdf/data/66a2a1834433ad480e7b0e1d/AIDS-PCES-Proceedings.pdf#page=533.
[18] Achermann, P., Borbély, A.A. (1998). Coherence analysis of the human sleep electroencephalogram. Neuroscience, 85(4): 1195-1208. https://doi.org/10.1016/s0306-4522(97)00692-1
[19] Polat, H., Özerdem, M.S. (2018). Automatic detection of emotional state from EEG Signal by gamma coherence approach. In 2018 Innovations in Intelligent Systems and Applications Conference (ASYU), Adana, Turkey, pp. 1-4. https://doi.org/10.1109/ASYU.2018.8554003
[20] Basharpoor, S., Heidari, F., Molavi, P. (2021). EEG coherence in theta, alpha, and beta bands in frontal regions and executive functions. Applied Neuropsychology: Adult, 28(3): 310-317. https://doi.org/10.1080/23279095.2019.1632860
[21] Adler, G., Brassen, S., Jajcevic, A. (2003). EEG coherence in Alzheimer’s dementia. Journal of Neural Transmission, 110(9): 1051-1058. https://doi.org/10.1007/s00702-003-0024-8
[22] Boldyreva, G.N., Zhavoronkova, L.A. (1991). Interhemispheric asymmetry of EEG coherence as a reflection of different functional states of the human brain. Biomedical Science, 2(3): 266-270.
[23] Comi, G.C., Fornara, C., Locatelli, T., Medaglini, S., Cursi, M., Minicucci, F., Leocani, L., Franceschi, M. (1998). EEG coherence in Alzheimer and multi-infarct dementia. Archives of Gerontology and Geriatrics, 26: 91-98. https://doi.org/10.1016/S0167-4943(98)80016-2
[24] Unde, S.A., Shriram, R. (2014). Coherence analysis of EEG signal using power spectral density. In 2014 Fourth International Conference on Communication Systems and Network Technologies, Bhopal, India, pp. 871-874. https://doi.org/10.1109/CSNT.2014.181
[25] Wang, R., Wang, J., Yu, H., Wei, X., Yang, C., Deng, B. (2015). Power spectral density and coherence analysis of Alzheimer’s EEG. Cognitive Neurodynamics, 9(3): 291-304. https://doi.org/10.1007/s11571-014-9325-x
[26] Polat, L.N.Ö., Özen, Ş. (2024). Evaluating the audiological testing process through galvanic skin response using a one-dimensional convolutional neural network. Traitement du Signal, 41(4): 2153-2158. https://doi.org/10.18280/ts.410443
[27] Polat, L.N.Ö., Özen, Ş. (2023). Evaluation of physiological effect of audiological test based on galvanic skin response. Measurement Science Review, 23(2): 92-99. https://doi.org/10.2478/msr-2023-0012
[28] Sankari, Z., Adeli, H., Adeli, A. (2012). Wavelet coherence model for diagnosis of Alzheimer disease. Clinical EEG and Neuroscience, 43(4): 268-278. https://doi.org/10.1177/1550059412444970
[29] Srinivasan, R., Winter, W.R., Ding, J., Nunez, P.L. (2007). EEG and MEG coherence: Measures of functional connectivity at distinct spatial scales of neocortical dynamics. Journal of Neuroscience Methods, 166(1): 41-52. https://doi.org/10.1016/j.jneumeth.2007.06.026
[30] Vacha, L., Barunik, J. (2012). Co-movement of energy commodities revisited: Evidence from wavelet coherence analysis. Energy Economics, 34(1): 241-247. https://doi.org/10.1016/j.eneco.2011.10.007
[31] Zhou, T., Kang, J., Cong, F., Li, X. (2020). Stability-driven non-negative matrix factorization-based approach for extracting dynamic network from resting-state EEG. Neurocomputing, 389: 123-131. https://doi.org/10.1016/j.neucom.2020.01.071
[32] Madan, E. (2022). Cognitive impairment in patients with left temporal lobe epilepsy. International Journal of Science and Research, 11(5): 1467-1471. https://doi.org/10.21275/SR22519134108
[33] Abdel-Hamid, L. (2023). An efficient machine learning-based emotional valence recognition approach towards wearable EEG. Sensors, 23(3): 1255. https://doi.org/10.3390/s23031255
[34] Kristoufek, L. (2015). What are the main drivers of the Bitcoin price? Evidence from wavelet coherence analysis. PloS One, 10(4): e0123923. https://doi.org/10.1371/journal.pone.0123923
[35] Phillips, R.C., Gorse, D. (2018). Cryptocurrency price drivers: Wavelet coherence analysis revisited. PloS One, 13(4): e0195200. https://doi.org/10.1371/journal.pone.0195200
[36] Polat, O., Nurel, L. (2023). Elektromanyetik dalgaların konuşma anlaşılabilirliği üzerine etkisinin elektrofizyolojik sinyallerle değerlendirilmesi. Akdeniz Üniversitesi DSpace. http://acikerisim.akdeniz.edu.tr/xmlui/handle/123456789/7680.