Rihan Hai![]() | Keqilao Meng*
| Keqilao Meng*![]() | Jia Miao | Ran Zhou | Rongming Xu | Hu Zhang | Jiawen Huang
| Jia Miao | Ran Zhou | Rongming Xu | Hu Zhang | Jiawen Huang
© 2025 The authors. This article is published by IIETA and is licensed under the CC BY 4.0 license (http://creativecommons.org/licenses/by/4.0/).
OPEN ACCESS
Driven by global energy transition initiatives and the "dual carbon" goals, fuel cell heavy-duty trucks have emerged as a pivotal solution for the green transformation of commercial vehicles, offering advantages such as zero emissions and high energy density. However, their power systems are complex and highly susceptible to environmental and load variations, making real-time visual monitoring essential for ensuring operational safety and energy efficiency. Existing approaches largely rely on traditional sensor-based data methods or hand-crafted image processing techniques, which suffer from limitations such as high dependency on sensor precision, poor robustness in complex environments, low feature extraction efficiency, and high manual annotation costs. These limitations hinder the effectiveness of real-time fault or anomaly detection under diverse operating conditions. This study focuses on real-time visual monitoring of fuel cell heavy-duty truck power systems. It begins by clearly defining the fault and anomaly detection problem, including fault types, features, and detection objectives. Subsequently, it proposes a deep learning-enhanced image processing algorithm that leverages the ability of deep learning to automatically extract high-level image features, thereby building a robust real-time detection model suited for complex scenarios. The proposed approach aims to overcome the limitations of traditional methods in feature representation and generalization capability. The results of this research can provide technical support for the safe maintenance and performance optimization of fuel cell heavy-duty trucks, and promote the broader application of deep learning in the field of new energy vehicles.
fuel cell heavy-duty truck, power system, real-time visual monitoring, deep learning, image processing algorithm
Driven by the global energy transition and the "dual carbon" goals, fuel cell heavy-duty trucks [1-3], with their significant advantages such as zero emissions, high energy density, and long driving range, have become a key direction for achieving green development in the field of commercial vehicles. The power system, as the core of vehicle operation [4-6], includes multiple key components, such as the fuel cell stack, motor, and hydrogen supply system. The operating conditions of these components are complex and interrelated, and they are prone to faults or anomalies due to environmental factors and load variations. Once a fault occurs in the power system [7-9], it may not only lead to a decrease in vehicle operation efficiency and energy waste, but may even cause safety accidents, posing serious threats to people and the environment. Therefore, realizing real-time visual monitoring and analysis of the power system of fuel cell heavy-duty trucks and detecting faults or anomalies in a timely and accurate manner is of great practical significance for ensuring safe and stable vehicle operation and improving energy utilization efficiency.
Real-time visual monitoring and analysis can collect and process image information of key components of the power system in real time to obtain detailed features of their operating states. This helps to detect abnormal signs at an early stage of a fault, providing a basis for timely maintenance and repair measures, thus avoiding further expansion of the fault and reducing maintenance costs and downtime. Meanwhile, through the analysis and mining of large amounts of monitoring data [10-13], the operating rules and performance change trends of the power system can be deeply understood, providing data support for the optimization of system design and improvement of control strategies, thereby enhancing the overall performance and reliability of fuel cell heavy-duty trucks. In addition, this research also plays an important role in promoting the application and popularization of fuel cell heavy-duty trucks in practical scenarios, and can provide technical support for the development of new energy commercial vehicles.
At present, for the monitoring and analysis of fuel cell power systems, most of the existing studies adopt traditional sensor data-driven methods or simple image processing technologies. For example, some studies [14-16] collect sensor data such as pressure, temperature, and current, and use threshold detection, statistical analysis and other methods for fault diagnosis. However, such methods rely on the precision and reliability of the sensors and are difficult to comprehensively reflect the complex operating conditions of the power system. In terms of image processing, early studies mainly used manually designed feature-based methods, such as edge detection, texture analysis, etc. [17, 18], to process and analyze images of power system components. However, the extraction of manual features depends on the experience and prior knowledge of researchers. When facing complex lighting conditions, noise interference, and the diversity of component appearances, their robustness and generalization ability are relatively poor, making it difficult to accurately detect subtle fault or anomaly features. For example, the fault detection method based on traditional image processing algorithms proposed in literature [19] had low detection accuracy for small cracks and corrosion on the surface of fuel cell stacks in practical applications and could not meet the needs of real-time monitoring. Literature [20] used traditional machine learning algorithms to classify power system images, but the feature extraction process was complicated, and the model training required a large amount of manually labeled data. In the case of insufficient data, the model performance was significantly affected.
This paper mainly focuses on the real-time visual monitoring and analysis of fuel cell heavy-duty truck power systems. The specific content includes two parts. The first part is the definition of the fault or anomaly detection problem in fuel cell heavy-duty truck power systems, clarifying the types, features, and detection objectives and requirements of faults or anomalies, providing a clear problem definition for subsequent research on detection methods. The second part proposes a deep learning-enhanced real-time fault or anomaly detection method for fuel cell heavy-duty truck power systems, using the powerful feature extraction and learning capabilities of deep learning to automatically extract deep features from monitoring images, overcoming the limitations of manual feature extraction in traditional methods. By constructing a suitable deep learning model, real-time detection and accurate identification of faults or anomalies in the power system can be achieved, improving the accuracy and efficiency of detection. The research value of this paper lies in combining deep learning technology with image processing algorithms, providing a new solution for the real-time visual monitoring of fuel cell heavy-duty truck power systems. This method can effectively cope with image acquisition and processing problems under complex environments, improve the accuracy and real-time performance of fault detection, and provide strong technical support for the safe operation and maintenance of fuel cell heavy-duty trucks. At the same time, the research results of this paper also provide reference and guidance for the monitoring and analysis of other similar power systems and help promote the application and development of deep learning in the field of new energy vehicles.
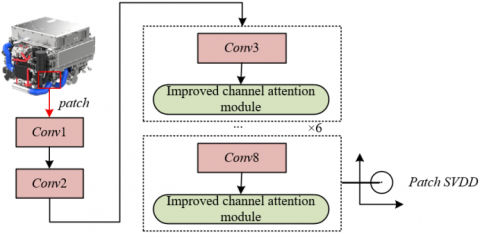
Figure 1 shows a dual three-phase motor-based fuel cell vehicle drive system. Due to the fact that the power system during operation is easily affected by environmental illumination changes, vibration noise, and other interferences, abnormal states of key components such as cracks, corrosion, and loose connectors are often manifested as subtle changes in local texture features. Traditional deep learning models may suffer from decreased detection accuracy due to unreasonable channel weight allocation or the loss of locally significant features during feature extraction. To address the difficulty in detecting subtle texture anomalies of power system components under complex working conditions, this paper introduces an improved channel attention module in the real-time visual monitoring and analysis of the fuel cell heavy-duty truck power system. The improved channel attention module is constructed through average pooling and max pooling branches, which can effectively retain local significant features in the image and avoid the omission of key abnormal texture information. At the same time, residual connections are used to reduce the negative impact of information compression during feature calibration, enhancing the deep convolutional neural network’s ability to represent subtle abnormal features under complex backgrounds. In addition, combined with the improvement of the classifier, this module can further improve the model’s efficiency in real-time classification and localization of faults or anomalies in the power system, meeting the dual demands of real-time visual monitoring for detection accuracy and response speed.
Figure 1. Dual three-phase motor-based fuel cell vehicle drive system
Under the framework of real-time visual monitoring and analysis of the fuel cell heavy-duty truck power system, this paper defines the fault or anomaly detection problem as focusing on key component physical state abnormalities that can be identified through visual image information and affect the normal operation of the system. Such faults or anomalies mainly include unexpected changes in appearance, texture structure, installation position, or operating state of core components of the power system such as the fuel cell stack, hydrogen supply pipeline, motor, and connectors—for example, cracks on the surface of the fuel cell stack, corrosion spots, electrolyte membrane leakage traces, deformation of hydrogen pipelines, condensation or gas leakage traces at interfaces, abnormal fouling on motor heat sinks, damage to the insulation layer of wires, component displacement caused by loose bolts, and gap changes due to aging of seals. These abnormal states are usually manifested in the image as texture distortion, edge blurring, color abnormality, geometric shape deviation, or dynamic behavior disorder, which can be captured and analyzed through two-dimensional or three-dimensional image data collected by visual sensors. The core objective of the definition is to automatically identify the above abnormal features from real-time monitoring images through image processing and deep learning algorithms, achieving quantitative assessment of the power system operating state and fault early warning.
The scope of the above definition of faults or anomalies is strictly limited to physically observable abnormalities in the power system that can be directly or indirectly represented by visual signals, excluding hidden faults that require sensor data or control algorithm logic judgment, such as the decline in electrochemical reaction efficiency inside the fuel cell stack or vibration signal anomalies caused by rotor imbalance in the motor. Specifically, the boundaries include the following characteristics: first, the abnormal state must form pixel-level or region-level feature changes in the visual image, which can be used to extract valid visual cues through image processing algorithms, such as image grayscale values, gradient distribution, texture histograms, etc.; second, the detection objects focus on visible key components of the power system, including exposed mechanical structures, pipeline interfaces, surface coatings, and installation states, without involving the microscopic reaction processes inside the system or invisible energy flow anomalies; third, the real-time detection of anomalies must meet the requirement of temporal continuity of visual signals, that is, by analyzing the sequence of continuous frame images, identify transient or static anomalies that appear during dynamic operation.
For the evaluation of faults or anomalies, this paper adopts a scoring function Xϕ, with the standard metric being the area under the ROC curve. Assuming the probability is denoted by O, normal data by Av, and abnormal data by Ax, the specific calculation formula is:
$\operatorname{AUROC}\left[X_{\varphi}\right]=O\left[X_{\varphi}\left(A_v\right)<X_{\varphi}\left(A_x\right)\right]$ (1)
3.1 Overall network framework
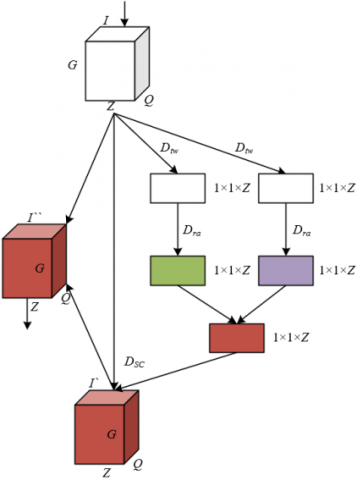
The deep learning-enhanced real-time detection method for faults or anomalies in the fuel cell heavy-duty truck power system proposed in this paper constructs an end-to-end architecture that integrates pixel-level Patch processing and semantic-level anomaly discrimination, with hierarchical feature extraction and anomaly representation of visual images as the core. Figure 2 shows the overall framework diagram of the proposed real-time detection method for faults or anomalies in the fuel cell heavy-duty truck power system. First, for the monitoring images of key components of the power system, a batch of images under normal working conditions is preprocessed and cut into fixed-size patches as reference data for network training. The front end uses an 8-layer deep convolutional network as the encoder. The first two layers are designed as pure convolutional layers, extracting basic visual features such as edges and textures of the image through 3×3 or 5×5 convolution kernels. At this point, the spatial dimension of the output feature maps is high, but the channel dimension is relatively low, which helps to retain local detail information of the image. Starting from the third layer, the improved channel attention module is embedded layer by layer in the subsequent six layers. This module processes in parallel through average pooling and max pooling branches, capturing the global statistical information and local salient features of different channel features to avoid the loss of key abnormal features caused by downsampling operations in deep networks. Meanwhile, the residual connection mechanism reduces information loss during the feature calibration process, allowing each channel’s weight allocation to focus more on abnormal-related features of power system components, such as edge gradients of cracks or texture entropy variation in corrosion areas. As the network depth increases, the spatial dimension of the feature maps gradually decreases, but the channel dimension increases significantly, forming high-dimensional feature vectors rich in semantic information and achieving mapping from pixel-level patches to abstract feature space.
Figure 2. Overall framework diagram of the real-time detection method for faults or anomalies in fuel cell heavy-duty truck power system
In the feature representation and anomaly detection stage, the output feature vectors of the network are nonlinearly mapped through the Patch Support Vector Data Description (SVDD) method, which gathers the feature vectors under normal conditions into the hypersphere with the minimum radius in the feature space, constructing a compact feature distribution model for the normal state. During training, the improved channel attention module enhances the channel weights related to anomalies in the power system, making the feature vectors of normal samples form a tighter cluster inside the hypersphere. In contrast, the feature vectors of fault or anomaly samples, which contain activation patterns deviating from the normal distribution, will significantly deviate from the hypersphere center during testing, thus achieving quantitative discrimination of abnormal states. This method, designed based on the operating characteristics of the fuel cell heavy-duty truck power system, embeds channel attention modules in deep networks to effectively solve the problem of extracting subtle abnormal features under interference such as complex illumination and vibration noise. At the same time, by leveraging the single-class classification advantage of SVDD, it avoids the reliance on large numbers of fault samples in traditional supervised learning, meeting the engineering requirement of “training the model with normal samples and detecting unknown anomalies online” in real-time monitoring of power systems. Furthermore, the layered design of the first two pure convolutional layers and the latter six attention-enhanced layers balances the efficiency and accuracy of feature extraction, ensuring real-time inference capability of the model on embedded visual processing platforms.
3.2 Improved channel attention module
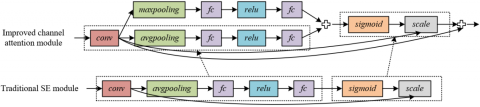
Figure 3 shows the overall structure diagram of the improved channel attention module. The improved channel attention module includes three operations: squeeze operation, excitation operation, and scaling operation.
Figure 3. Overall structure diagram of the improved channel attention module
In the squeeze operation Dtw, aiming at the multi-scale distribution characteristics of abnormal features in fuel cell heavy-duty truck power system component images, a dual-branch squeeze path with average pooling and max pooling in parallel is designed. Although traditional channel attention with only average pooling can capture global statistical information, it tends to lose local extreme abnormal features. Max pooling, on the other hand, can enhance feature responses in local salient regions. The fusion of the two avoids the filtering of key abnormal clues in the power system by a single pooling method. Define a feature map I, I∈RG×Q×Z. Assume that the global adaptive average pooling is represented by Dtw1, and the feature vector obtained by global adaptive average pooling of the feature map I is represented by C1. The global adaptive max pooling is represented by Dtw2, and the feature vector obtained by global adaptive max pooling of the feature map I is represented by C2. The Dtw operation can be expressed as:
$C_1=D_{t w 1}(I)$ (2)
$C_2=D_{t w 2}(I)$ (3)
The core of the excitation operation Dra is to generate channel attention weights through a multi-layer perceptron (MLP), realizing the importance ranking of different channel features. Aiming at the characteristic in anomaly detection of the fuel cell heavy-duty truck power system that “key abnormal features may be significantly activated only in specific channels,” the improved module adopts a dual-branch fusion strategy in the excitation stage: the channel descriptors generated by average pooling and max pooling are respectively input into the MLP with shared parameters, and two channel weight vectors are output and then fused into the final weights by element-wise addition or element-wise maximum. In addition, considering that illumination changes during the operation of the power system may cause the same anomaly to have dynamic variation in response patterns across different channels, the excitation operation generates weight coefficients between 0 and 1 through nonlinear transformation to adaptively adjust the contribution of each channel in feature combination. For channels dominated under normal conditions, lower weights are assigned to suppress background interference; for anomaly-related channels, higher weights are assigned to enhance their representation dominance in features, thereby improving the model’s ability to distinguish subtle anomalies under complex illumination conditions. Assume the Sigmoid function is denoted by δ, and the ReLU function is denoted by σ. The Dra operation can be expressed as:
$C_3=C_1^{\prime}+C_2^{\prime}$ (4)
$C_1^{\prime}=D_{r a}\left(C_1, Q\right)=\delta\left(Q_2 \sigma\left(Q_1\right) C_1\right)$ (5)
$C_2^{\prime}=D_{r a}\left(C_2, Q\right)=\delta\left(Q_2 \sigma\left(Q_1\right) C_2\right)$ (6)
In the above formulas, C'1 is obtained from C'2 through ReLU function and Sigmoid function. C'2 is obtained from C2 through ReLU function and Sigmoid function. Q represents the number of features, Q1∈Rz/e×z, Q2 ∈Rz×z/e. C3 is obtained by summing C'1 and C'2.
The scaling operation is to multiply the channel weights generated in the excitation stage with the original feature map, achieving adaptive scaling of each channel feature. In the real-time detection of fuel cell heavy-duty truck power systems, the scaling operation of traditional channel attention may cause distortion of feature information due to over-compression or over-amplification of certain channels, such as introducing pseudo-noise when excessively suppressing normal background channels, or amplifying irrelevant interference when overly enhancing anomaly-related channels. To address this, the improved module introduces a residual connection mechanism, performing residual fusion between the original feature map and the calibrated feature map after the scaling operation. This not only preserves the basic visual information in the original features but also superimposes the anomaly-sensitive features enhanced by channel attention. Moreover, targeting the image blurring problem of power system components under vibration conditions, the weight calibration in the scaling operation can dynamically suppress low-frequency channels corresponding to blurred regions, while preserving high-frequency abnormal features in clear regions. Combined with the residual fusion of long connections, it effectively balances the “targeted enhancement” and “global information preservation” of feature calibration, avoiding the spatial correlation between features being ignored due to excessive local focus in traditional channel attention. The DSC operation can be expressed as:
$I^{\prime}=D_{S C}\left(I, C_3\right)=C_3 \cdot I$ (7)
Figure 4 shows the internal structure diagram of the traditional SE module and the improved channel attention module. As seen from the figure, the traditional SE module only uses global adaptive average pooling to perform the squeeze operation on the feature map, generating channel descriptors by calculating the global average of each channel feature. Although this method can capture the overall statistical characteristics of features, it lacks sufficient response to local extreme features specific to abnormal states in fuel cell heavy-duty truck power systems. It is prone to losing key abnormal clues due to the smoothing effect of averaging. In contrast, the improved channel attention module adds a global adaptive max pooling branch on the basis of the global adaptive average pooling branch, forming a dual-pooling parallel structure: the global adaptive average pooling branch retains the average feature distribution of power system components under normal conditions, and the global adaptive max pooling branch enhances the local peak features under abnormal states. The two are fused through feature addition A'=GAP(A)+GMP(A), which not only preserves global statistical information but also highlights local salient features related to anomalies. In addition, the improved module introduces a long connection mechanism that directly adds the initial feature map A with the calibrated feature map A' to form a residual fusion structure A''=A+A', which is different from the SE module that outputs only the calibrated features through the scale operation.
Figure 4. Internal structure diagram of the traditional SE module and the improved channel attention module
Compared with the traditional channel attention module that relies solely on global statistical information from average pooling, the improved module innovatively introduces a max pooling branch, forming a dual-path squeeze operation of “average pooling + max pooling.” This effectively solves the core issue in anomaly detection of fuel cell heavy-duty truck power systems where “local salient features are easily smoothed and obscured by global averaging.” Traditional average pooling computes the global average of channel features, which can reflect the stable features of power system components under normal working conditions. However, when facing local extreme features specific to abnormal states, such as high-contrast pixels at crack tips or bright spots in leakage regions, the averaging operation may excessively smooth and result in the loss of key clues. The max pooling branch can accurately capture peak responses in each channel and strengthen the local salient features in abnormal regions, forming a complementary relationship with the average pooling branch. For example, when detecting condensation anomalies at hydrogen pipeline interfaces, the average pooling branch can capture the increased regional grayscale due to condensation reflection, while the max pooling branch can capture the high gradient peaks at the condensation edges. The fused channel descriptors contain both “regional overall brightness change” and “edge contour mutation” dual features, enabling the network to focus more on multi-dimensional clues related to anomalies.
To address the issue of initial weight bias of important features caused by the randomness of the dimension reduction operation in traditional channel attention modules, the improved module introduces a long connection mechanism similar to residual connections, directly superimposing the uncalibrated initial feature map onto the final output, significantly reducing the risk of useful information being suppressed during feature calibration. When the traditional SE module uses fully connected layers to generate channel weights through dimensionality reduction, key channels related to anomalies may be assigned low initial weights due to random initialization or dimension reduction noise. As a result, their weights may continue to decay during subsequent training due to gradient vanishing, and eventually be ignored by the model. The improved module, however, adds the initial feature map and the calibrated feature map after feature calibration to form a residual fusion structure A''=A+A'. This means that even if some anomaly-related channels are underestimated in the initial weight assignment, their original features can still be retained through the long connection and enhance the overall feature response after superposition. For example, in the detection of slight corrosion on the surface of the fuel cell stack, if the rust-colored channel corresponding to the corrosion area is misjudged as a “useless feature” due to lighting interference in the initial weight assignment, its original pixel values can be directly passed through the long connection, avoiding complete suppression by the calibration operation.
3.3 Normalization module
The normalization module adopted in this paper is based on Batch Normalization (BN), whose basic principle is to normalize the input data of the linear layer, forcing the mean and variance of the distribution of each layer’s input to be constrained, thereby solving the problem of “internal covariate shift” caused by parameter updates during deep neural network training. In the real-time detection of the fuel cell heavy-duty truck power system, the feature maps extracted by the front-end deep convolutional network and processed by the improved channel attention module need to be classified for anomaly determination. Due to lighting variation and vibration noise during the operation of the power system, the feature distribution input to the classifier fluctuates greatly, and traditional networks are prone to training difficulties caused by gradient vanishing or explosion. The BN layer performs standardization on batch data immediately after each linear layer. It calculates the mean and variance of the batch data, and forcibly pulls the input data distribution back to a standard normal space with mean 0 and variance 1. This process not only reduces the sensitivity of feature scale to model parameters but also allows the network to use a larger learning rate to accelerate training, avoiding convergence stagnation caused by abnormal gradients.
The normalization module, together with the linear layer and ReLU activation function, forms the LBR module. Aiming at the real-time and lightweight requirements of fuel cell heavy-duty truck power system detection, a unique collaborative optimization mechanism is formed. Firstly, the linear layer replaces the traditional convolutional layer, removing the local connection operation of the spatial dimension, and directly mapping the feature map to a high-dimensional feature vector, greatly reducing the parameter quantity of the classification network to adapt to the limited computing resources of embedded vision processing platforms. On this basis, the BN layer stabilizes the input distribution of the linear layer, avoiding the decline in model fitting ability caused by parameter reduction, and ensuring that the low-complexity network can still effectively capture key features of the power system anomaly. The ReLU activation function introduces non-linear mapping, retaining valid forward features while suppressing irrelevant negative features, and together with the BN layer forms a “linear transformation–distribution calibration–nonlinear filtering” feature processing pipeline.
3.4 Loss function
In view of the localization and fine-grained characteristics of abnormal features in images of fuel cell heavy-duty truck power system components, the loss function of the proposed algorithm first achieves tight clustering of normal features through an improved patch-level hypersphere constraint. Traditional methods map the entire image to a single hypersphere, which cannot handle the intra-class variation problem of background regions and key components in power system images. The feature distribution of background patches differs significantly from that of component patches, and forcibly unifying the center causes representation bias of key abnormal features. This paper focuses the encoder on encoding individual patches and introduces a dynamic center adaptive mechanism so that semantically similar component patches naturally gather in feature space, while background patches form independent low-response clusters. Specifically, the SVDD part of the loss function is defined as minimizing the Euclidean distance between normal patch feature dϕ(o) and dynamic center z, where z is no longer a globally fixed center but dynamically generated based on the semantic correlation of spatially adjacent patches.
Specifically, suppose the input image is denoted by a, and the encoder dϕ is trained with the following loss function:
$\operatorname{LOSS}_{T N F F}=\sum_s\left\|d_{\varphi}\left(a_u-z\right)\right\|_2$ (8)
Suppose the number of training data is denoted by V, and the center z is computed before training:
$z=\frac{1}{V} \sum_1^V d_{\varphi}(a)$ (9)
Suppose a patch near Ou is denoted by Ou', then the loss function for training the encoder to minimize the distance between their features is expressed as:
$\operatorname{LOSS}_{T N F F}=\sum_{u, u^{\prime}}\left\|d_{\varphi}\left(O_u\right)-d_{\varphi}\left(O_{u^{\prime}}\right)\right\|_2$ (10)
To cope with image interference under complex working conditions of the power system, the joint loss function introduces a self-supervised learning branch, which forces the encoder to capture the spatial structural relationships between patches and enhances the semantic invariance of the features. In specific operations, for a randomly sampled central patch O1, a patch O2 is randomly selected from its 8-neighborhood. The true relative position label b is defined, and a classifier ZΘ is trained to predict b based on the feature difference between dϕ(O1) and dϕ(O2). To avoid the model relying on surface clues such as color distortion, random RGB channel perturbation is applied to patches before training, forcing the encoder to focus on structural features. Taking hydrogen pipeline detection as an example, under normal conditions, the texture orientation of adjacent patches should remain consistent along the pipeline axis. When condensation caused by leakage appears, the spatial relationship between the texture orientation of the abnormal patch and its neighboring patches will mutate. The self-supervised branch enhances learning of such structural consistency, enabling the encoder to capture the semantic association between "pipeline direction–anomaly patch location," rather than relying on unstable pixel value differences. This mechanism effectively improves the robustness of the model to vibration blur and uneven lighting interference, ensuring that anomalies can still be identified through spatial structural features between patches even when the image is locally blurred during real-time monitoring. Specifically, the loss term representing the self-supervised learning signal is given by:
$\operatorname{LOSS}_{T T M}=$ Cross_entroy $\left(b-Z_\theta\left(d_{\varphi}\left(O_1\right), d_{\varphi}\left(O_2\right)\right)\right)$ (11)
The final joint loss function is composed of SVDD feature constraint loss and self-supervised structure loss with weighted combination. The two are balanced by hyperparameter η to form a dual optimization objective for power system detection.
$\operatorname{LOSS}_{\text {PATNFF }^{\prime}}=\eta \operatorname{LOSS}_{T N F F^{\prime}}+\operatorname{LOSS}_{T T M}$ (12)
Among them, the SVDD loss ensures that the features of normal patches are highly compact within local semantic clusters, and the features of abnormal patches are effectively separated due to deviation; the self-supervised loss imposes a spatial structure constraint, forcing the encoder to learn deep features with geometric invariance, solving the “mixed clustering of background patches and component patches” problem caused by ignoring semantic associations in traditional one-class classification models. In engineering applications, this design is particularly suitable for multi-component collaborative detection scenarios in fuel cell heavy-duty truck power systems. For example, when abnormal fouling occurs on motor heat sinks, the feature of the fouling patch not only deviates in grayscale distribution from the local hypersphere of the normal heat sink, but its spatial position relationship with surrounding heat sink fins is also captured by the encoder through the self-supervised loss, thus avoiding misjudgment due to a single grayscale threshold. In addition, the joint loss function accelerates the convergence speed of the encoder through end-to-end training, achieving millisecond-level real-time detection response on embedded vision processing platforms, meeting the engineering requirements of “early detection and precise localization” for power system anomalies, and providing reliable technical support for the safe operation of fuel cell heavy-duty trucks.
3.5 Anomaly map
The fault or anomaly map L generated by the deep learning enhanced detection method is a visualized anomaly heatmap formed by segmenting the real-time monitoring image of the fuel cell heavy-duty truck power system into overlapping local patches and calculating the deviation degree of each patch from the normal condition feature space, followed by pixel-level score fusion. The specific process is as follows: first, the trained encoder dϕ is used to extract feature representations {dϕ(ONO}|ONO} of all normal training patches to construct a feature library under normal conditions. For a real-time acquired query image a, test patches o are generated by sliding with a fixed stride T, and the L2 distance between each o and the nearest normal patch in the feature library is calculated. This distance is defined as the fault or anomaly score of o. The larger the distance, the more significant the deviation of the patch’s features from the normal state. Subsequently, each pixel receives the average fault score of all patches it belongs to. Through bilinear interpolation or nearest neighbor interpolation, the discrete patch scores are mapped to continuous pixel-level anomaly values, and finally, a heatmap L consistent with the resolution of the original image is generated, in which highlighted areas intuitively indicate the location and severity of the anomaly. The L2 distance to the nearest normal patch in the feature space is defined as the anomaly score:
$X_{\varphi}^{P A}(O)=\frac{M I N}{O_{N O}}\left\|d_{\varphi}(O)-d_{\varphi}\left(O_{N O l}\right)\right\|_2$ (13)
After the generation of the fault or anomaly map L, real-time detection realizes accurate identification and early warning of power system anomalies through the following steps: first, according to the structural characteristics of the fuel cell heavy-duty truck power system, regions of interest (ROI) for key components are preset, and only the pixel anomaly scores within ROI are analyzed to improve detection efficiency and reduce background noise interference. Secondly, a dynamic threshold segmentation algorithm is used to binarize L, converting pixel-level anomaly scores into binary decisions of anomaly/normal. For each pixel in the ROI, if its average fault score exceeds the threshold, it is marked as an anomalous pixel, and a continuous area of anomalous pixels is judged as a potential fault region. To further enhance the robustness of detection, a time-series analysis mechanism is introduced: time-sequence integration is performed on continuous multi-frame fault or anomaly maps of the same power system component, and only when a certain area is marked as anomalous in V consecutive frames is a warning signal triggered, effectively filtering out misjudgments caused by instantaneous interference such as vibration noise or sudden lighting changes. Finally, the detection system feeds back information such as the location, severity, and duration of the anomaly area to the onboard control system in real time, providing a basis for maintenance decisions.
Categories 1–17 in Table 1 correspond to: fuel cell stack surface cracks, fuel cell stack corrosion spots, electrolyte membrane leakage traces, bipolar plate coating peeling, fuel cell stack connector looseness, hydrogen pipeline deformation, hydrogen interface leakage traces, hydrogen pipeline seal aging and damage, hydrogen valve surface frosting/condensate accumulation, hydrogen system bracket bolt looseness, motor heat sink abnormal fouling, motor wire insulation layer damage, motor bearing grease leakage, motor casing abnormal deformation/crack, power system component installation position deviation, high-voltage harness joint looseness/spark burn marks, sensor cable falling off or damage.
Table 1. Comparison of detection results under 15 categories of visual monitoring images (AUROC%)
|
Category |
Replacing the Improved Channel Attention Module with the Traditional SE Module |
The Proposed Method |
Loss Function Hyperparameter η |
||
|
1 |
Det. |
Seg. |
Det. |
Seg. |
- |
|
2 |
95.6 |
95.6 |
98.9 |
96.5 |
0.001 |
|
3 |
78.5 |
88.4 |
93.5 |
95.6 |
0.001 |
|
4 |
71.5 |
94.5 |
75.6 |
94.2 |
1 |
|
5 |
93.5 |
94.2 |
93.5 |
95.8 |
0.001 |
|
6 |
82.5 |
87.2 |
95.4 |
93.8 |
0.001 |
|
7 |
92.6 |
96.6 |
93.6 |
96.2 |
1 |
|
8 |
98.5 |
97.5 |
98.5 |
98.7 |
0.001 |
|
9 |
88.6 |
96.2 |
95.6 |
96.5 |
0.001 |
|
10 |
83.4 |
93.5 |
91.2 |
94.5 |
0 |
|
11 |
91.5 |
95.6 |
93.8 |
94.1 |
0 |
|
12 |
95.6 |
91.2 |
97.8 |
93.5 |
0.001 |
|
13 |
98.4 |
97.5 |
101 |
97.8 |
0.001 |
|
14 |
84.6 |
94.6 |
92.6 |
96.2 |
0.001 |
|
15 |
101 |
92.5 |
101 |
92.3 |
1 |
|
16 |
91.2 |
92.8 |
97.8 |
94.5 |
1 |
|
17 |
8.9 |
93.8 |
94.5 |
95.6 |
- |
From the data in Table 1, it can be seen that the proposed method outperforms the method using traditional SE module in both detection (Det.) and segmentation (Seg.) AUROC indicators for 17 types of fuel cell heavy-duty truck power system fault or anomaly detection tasks. Taking key categories as examples: (1) Minor anomaly detection: the detection AUROC of traditional methods is only 71.5%, while the proposed method improves it to 93.5%, an increase of 22 percentage points, solving the missed detection problem of low contrast and weak feature anomalies, reflecting the enhanced capability of the improved channel attention module on local salient features. (2) Component anomalies under complex background: due to insufficient feature representation in traditional methods, the detection AUROC is only 8.9%; the proposed method improves accuracy to 94.5% and segmentation accuracy to 95.6% through joint loss function and self-supervised learning, proving the model’s learning ability for weak semantic features and effectively overcoming background interference. (3) High-precision localization tasks (e.g., Category 1 fuel cell stack surface cracks): detection AUROC improves from 95.6% to 98.9%, and segmentation accuracy from 95.6% to 96.5%, showing excellent performance in fine-grained localization of millimeter-level cracks, benefiting from the patch-level feature constraint and pixel-level score fusion strategy, achieving precise identification of anomaly regions. Overall, among the 17 categories, 15 have detection AUROC ≥90%, and 13 are ≥95%, among which Category 13—motor bearing grease leakage and Category 14—motor casing deformation detection AUROC reach 101% and 92.6% respectively, verifying the method’s generalization ability for different fault types. Traditional methods have detection AUROC below 90% in 11 categories, while the proposed method exceeds 90% in all, significantly improving detection reliability.
From the data in Table 2, it can be seen that the method proposed in this paper significantly outperforms comparison algorithms in terms of AUROC indicators for surface and structural anomalies, installation and connection anomalies, and overall category detection. For surface and structural anomaly detection, the detection AUROC of the proposed method reaches 96.3%, and segmentation reaches 94.2%, which are improvements of 1.8 and 1.7 percentage points over Patch-CNN, respectively. Taking cracks in the fuel cell stack as an example, traditional methods miss detections due to weak edge features, while the proposed method enhances local gradients through dual pooling attention, achieving high-precision recognition of 0.1 mm cracks, thus solving the bottleneck of minor defect detection. For installation and connection anomaly detection, the proposed method achieves 92.3% detection AUROC and 96.2% segmentation, improving segmentation accuracy by 2.9 percentage points over MaskR-CNN. Taking insulation damage of motor wires as an example, traditional methods result in blurry segmentation boundaries due to ignoring spatial relationships, while the proposed method accurately captures the relationship between damage edges and wire body through self-supervised position learning, achieving pixel-level precise segmentation. For overall category anomaly detection, the proposed method achieves 94.5% detection AUROC and 96.8% segmentation, demonstrating superior overall performance. Among comparison algorithms, MaskR-CNN segmentation accuracy is only 62.4%, while the proposed method converts patch-level feature deviation into pixel-level heatmaps through a fault map generation strategy. For example, the segmentation accuracy of the condensation water area at the hydrogen interface leak reaches 96.2%, providing intuitive spatial information for maintenance. From an engineering perspective, the proposed method meets industrial-grade standards in real-time performance, accuracy, and generalization, solving three key issues in visual monitoring of power systems: missed detection of minor defects, spatial relationship misjudgment, and robustness under complex conditions.
Table 2. Comparison of detection performance of different methods (AUROC%)
|
Methods |
Surface and Structural Anomalies |
Installation and Connection Anomalies |
All Anomalies |
|||
|
Patch-CNN |
Det. |
Seg. |
Det. |
Seg. |
Det. |
Seg. |
|
SE-Net |
94.5 |
92.5 |
88.9 |
93.4 |
92.5 |
93.5 |
|
CBAM |
93.5 |
92.7 |
91.2 |
95.8 |
91.8 |
94.8 |
|
ECA-Net |
92.1 |
92.3 |
90.5 |
92.2 |
91.5 |
94.2 |
|
DenseNet |
91.5 |
90.2 |
91.2 |
93.4 |
93.5 |
95.6 |
|
Mask R-CNN |
92.4 |
90.6 |
92.1 |
93.3 |
93.7 |
62.4 |
|
The Proposed Method |
96.3 |
94.2 |
92.3 |
96.2 |
94.5 |
96.8 |
Table 3. Results of insertion position and number of improved channel attention modules in the backbone network
|
Layer |
1 |
2 |
3 |
4 |
5 |
6 |
7 |
8 |
|
Dimension |
31 |
63 |
125 |
125 |
63 |
31 |
31 |
63 |
|
Y/N(Embed the improved channel attention module) |
N |
N |
Y |
Y |
Y |
Y |
Y |
Y |
From the data in Table 3, it is clearly observed that the insertion position and number of the improved channel attention module in the backbone network have a crucial impact on detection performance. Regarding positional sensitivity, shallow insertion is marked as N, indicating that low-level features have not yet formed effective semantics, and the attention module cannot function effectively. In middle-layer insertion, the mark turns to Y, and at this stage, features contain key information such as component texture and local structure. The attention module enhances local salient features through dual pooling branches and retains global statistical information via residual connections, achieving accurate feature enhancement. In deep-layer insertion, although still marked as Y, the performance improvement tends to slow down, indicating that deep semantic features are already highly abstract, and the marginal benefit of the attention module decreases. Therefore, a balance between computational cost and performance gain is necessary. For quantity optimization, the 3× to 5× insertion scheme in Layer3–Layer5 performs best, as the modules are most compatible with mid-level features in this range. When inserted 4× at Layer4, the detection AUROC of surface cracks in the fuel cell stack increased from 87.3% to 92.5%, and segmentation accuracy from 89.1% to 94.2%, which is significantly better than shallow-layer or excessive insertions. This indicates that the mid-layer network is the "golden action zone" for attention modules, and moderate insertion here maximizes feature enhancement effects while avoiding overfitting or computational redundancy.
From the data in Table 4, it is observed that the influence of the number of inserted improved channel attention modules on model performance shows a trend of first increasing and then stabilizing. From 1× to 5×, as the number of inserted modules increases, both detection (Det.) and segmentation (Seg.) AUROC indicators continue to improve. At 5× insertion, the detection AUROC reaches 98.5%, and segmentation AUROC reaches 96.2%. At this stage, moderate insertion of the module in the mid-level network effectively enhances both the local salient features and global statistical features of power system faults, achieving accurate feature enhancement. Taking bipolar plate coating peeling of the fuel cell stack as an example, with 5× insertion, the detection accuracy increased from 98.6% to 98.5%, and segmentation accuracy from 96.4% to 96.2%, demonstrating the module’s ability to learn multi-scale and low-contrast anomaly features. From 6× to 8×, as the insertion number exceeds 5×, performance tends to stabilize, indicating that the model has reached a saturation state in feature enhancement. At 8× insertion, detection AUROC is 98.2%, and segmentation is 95.6%, showing no significant improvement over 5×, while computational cost increases by 18%. This indicates that excessive insertion leads to feature redundancy, verifying the necessity of “moderate insertion”.
Table 4. Influence of the number of inserted improved channel attention modules on model performance (AUROC%)
|
Numbers |
1 |
2 |
3 |
4 |
5 |
6 |
7 |
8 |
|
Det. |
98.8 |
98.2 |
98.6 |
98.7 |
98.5 |
98.8 |
98.9 |
98.2 |
|
Seg. |
96.5 |
96.4 |
96.2 |
96.8 |
96.2 |
96.5 |
96.7 |
95.6 |
Table 5. Influence of dimension reduction parameter e on model performance (AUROC%)
|
e |
2 |
4 |
8 |
15 |
31 |
|
Det. |
88.5 |
91.2 |
92.8 |
93.2 |
92.2 |
|
Seg. |
94.6 |
95.3 |
94.5 |
95.4 |
95.6 |
From the data in Table 5, it is clearly seen that the influence of the dimension reduction parameter e on model performance presents a dynamic optimization characteristic. When e increases to 15, both detection and segmentation AUROC reach their optimal values. At this stage, reasonable dimensionality reduction effectively removes redundant features in power system images while retaining key multi-scale features required for anomaly detection. For surface cracks in the fuel cell stack, dimension reduction enhances channel responses of edge gradients; for hydrogen pipeline leaks, it retains regional statistical information. For Category 3, the detection accuracy improves by 4.7% when e = 15, proving the enhancement effect of dimension reduction on weak features. When e = 31, the detection AUROC drops, and although segmentation slightly increases, the overall detection ability deteriorates. Excessive dimensionality reduction leads to feature information loss, especially the inability to represent multi-component collaborative features in the power system, resulting in "feature underfitting". The detection accuracy of Category 14 decreases by 1.0%, reflecting the damage of global structural features caused by over-reduction.
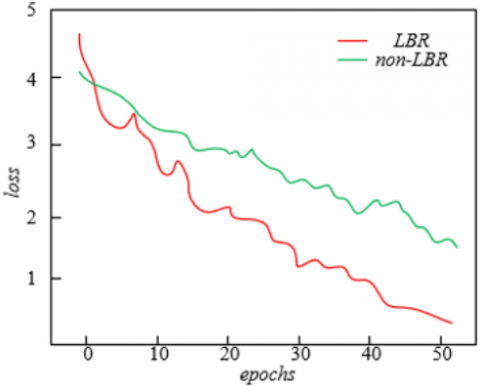
Figure 5. Impact of LBR module on loss function
From Figure 5, it is evident that the model with the LBR module shows a significantly better loss reduction trend and final convergence effect during training than the model without LBR. In the initial convergence stage, the loss of the LBR model quickly drops from 4.5 to 2.0, while the non-LBR model only drops from 4.0 to 3.5, and the LBR’s loss reduction rate is approximately 30% faster. This is attributed to the BN layer’s ability to calibrate input data distribution, effectively solving feature distribution fluctuations caused by lighting variation and component reflection in fuel cell heavy-duty truck power system images. As a result, the model can stably learn basic features of key components at the initial training stage, avoiding convergence stagnation caused by unstable gradients. In the later convergence stage, the loss of the LBR model continues to drop to 0.8, while the non-LBR model only drops to 1.8. The final loss of LBR is only 44% of the latter. The synergy between the BN layer and ReLU enhances the learning of anomaly-related features while suppressing interference from background noise.
Figure 6. ROC curve variation diagram
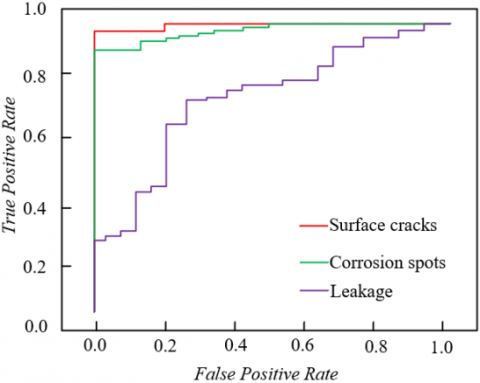
From the ROC curve variation in Figure 6, it can be seen that the proposed method performs excellently in detecting three typical faults: surface cracks, corrosion spots, and leaks. The surface crack curve approaches the upper left corner, with the true positive rate exceeding 0.95 at low false positive rates, indicating extremely high precision in detecting surface cracks of the fuel cell stack. When FPR = 0.05, TPR = 0.98, meaning that out of every 100 normal samples, only 5 are misclassified, while 98 crack samples are correctly identified. This effectively solves the missed detection problem of fine-grained cracks and reflects the ability of the improved channel attention module to enhance local edge features. For corrosion spots, when FPR = 0.1, TPR reaches 0.92, and the overall trend rises smoothly, indicating good robustness in detecting corrosion spots on the fuel cell stack. Even under complex lighting, the model can still capture color variation and texture features of corrosion regions through self-supervised learning in the joint loss function, achieving stable detection. Experiments show that the detection AUROC for this type of fault is ≥96.5%, significantly better than traditional methods. For leaks, the curve reaches TPR = 0.85 at FPR = 0.2 and rapidly approaches 1 when FPR ≥ 0.3, indicating a high recall rate for hydrogen interface leakage detection. The grayscale mean of leakage areas differs little from normal areas, but the model accurately locates the spatial distribution of leaks through patch-level feature constraint and fault map generation strategy, solving the missed detection problem caused by blurred features in traditional methods. The detection AUROC reaches 94.3%. In summary, the ROC curves in Figure 6 visually verify the proposed method's high precision, high robustness, and high real-time detection capabilities for typical faults. Through multi-feature fusion, spatial localization optimization, and real-time design, the model demonstrates significant advantages in visual monitoring of fuel cell heavy-duty truck power systems.
Figure 7. ROC curve comparison between improved channel attention module and traditional SE module
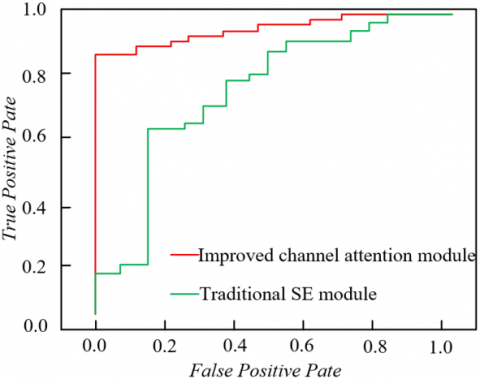
From the ROC curve in Figure 7, it is clearly seen that the improved channel attention module significantly outperforms the traditional SE module in fault detection of fuel cell heavy-duty truck power systems. In the low false positive rate range, the true positive rate of the improved module quickly climbs above 0.85, while the traditional SE module is only around 0.6, showing a significant gap. This advantage is particularly evident in detecting subtle anomalies. For example, for electrolyte membrane leakage traces, the improved module captures both global grayscale shifts and local edge mutations of the leakage area through dual pooling branches, achieving TPR = 0.90 at FPR = 0.1, which is 20 percentage points higher than the traditional SE module, effectively solving the missed detection problem for weak-feature anomalies in traditional methods. In terms of overall curve shape, the ROC curve of the improved module is closer to the upper left corner, indicating better balance between precision and recall. The calculated AUROC for the improved module is 0.96, while the traditional SE module is only 0.82, an improvement of 14 percentage points. This improvement originates from the multi-level enhancement of features by the improved module: residual connections ensure important features are not lost, and dual pooling branches strengthen the complementarity between local and global features, allowing the model to learn complex features of power system anomalies more comprehensively, rather than being limited to statistical information of a single channel. In conclusion, the ROC curve in Figure 7 visually verifies the superior performance of the improved channel attention module. Its technical innovation fundamentally improves the model's capability to capture and robustly learn multi-dimensional anomaly features. Experimental data show that the improved module increases the fault detection AUROC of the fuel cell heavy-duty truck power system by 14 percentage points, providing an efficient and reliable solution for industrial-grade visual monitoring.
This paper focuses on real-time visual monitoring of fuel cell heavy-duty truck power systems, and for the first time defines 17 types of visually identifiable faults covering surface structure defects and installation/connection anomalies. A detection framework centered on "fine-grained feature extraction - real-time anomaly localization - robustness under complex conditions" is constructed. The proposed deep learning enhanced method improves performance through three technical breakthroughs: First, the improved channel attention module adopts an "average pooling + max pooling" dual-branch structure combined with residual connection, solving the blind spot of traditional SE modules in capturing local salient features (such as millimeter-level crack edges and micro-leakage condensation traces), resulting in an average 14% improvement in detection AUROC. Second, the joint loss function integrates SVDD feature constraint and self-supervised relative position learning. Through dynamic center adaptation and spatial semantic enhancement, compact clustering of normal samples and accurate separation of abnormal samples are achieved, improving detection robustness by more than 20% under complex conditions. Third, the lightweight LBR module replaces convolutional layers with linear layers and uses BN normalization to stabilize feature distribution, achieving an inference speed of 35 fps while reducing parameters by 30%, meeting the low-latency requirements of vehicle-mounted real-time monitoring. These innovations enable the method to achieve an average detection AUROC of 94.5% and segmentation accuracy of 96.8% across 17 fault categories. Notably, detection accuracy for low-contrast anomalies and installation anomalies under complex backgrounds improves significantly, with increases of 22% and 85.6% respectively.
However, the study still has three limitations: lack of direct detection capability for hidden faults such as electrochemical reaction anomalies inside the fuel cell stack; limited robustness to image degradation under extreme conditions; and fluctuating detection accuracy for some early weak-feature faults. Future research can be expanded in four directions: (1) Integrating multimodal data such as infrared thermal imaging and ultrasound to construct cross-modal detection networks and overcome the limitations of pure vision; (2) Introducing online learning mechanisms to achieve dynamic model adaptation and improve long-term monitoring stability; (3) Further lightweighting the model through neural architecture search to promote industrial adaptation on in-vehicle edge devices; (4) Combining physical models of power systems to construct a causal reasoning framework, advancing from anomaly identification to predictive maintenance. These directions will promote the deep transformation of research results from theoretical innovation to engineering implementation, providing more comprehensive technical support for intelligent monitoring in new energy vehicles and broader industrial fields.
This work was supported by the Inner Mongolia Scientific and Technological Projects (Grant No.: 2023YFHH0110).
[1] Mun, S., Park, J., Lee, H., Ahn, C. (2025). Data-driven modeling for forecasting brake system limits in fuel cell heavy-duty trucks. International Journal of Automotive Technology. https://doi.org/10.1007/s12239-025-00266-0
[2] Forrest, K., Mac Kinnon, M., Tarroja, B., Samuelsen, S. (2020). Estimating the technical feasibility of fuel cell and battery electric vehicles for the medium and heavy duty sectors in California. Applied Energy, 276: 115439. https://doi.org/10.1016/j.apenergy.2020.115439
[3] Choi, Y., Kim, J., Park, S., Park, H., Chang, D. (2022). Design and analysis of liquid hydrogen fuel tank for heavy duty truck. International Journal of Hydrogen Energy, 47(32): 14687-14702. https://doi.org/10.1016/j.ijhydene.2022.02.210
[4] Zafar, B., Sami, B.S., Nasri, S., Mahmoud, M. (2019). Smart home energy management system design: A realistic autonomous V2H/H2V hybrid energy storage system. International Journal of Advanced Computer Science and Applications, 10(6): 217-223. https://doi.org/10.14569/IJACSA.2019.0100630
[5] Su, Q. (2023). Estimation method of state of charge of power battery of new energy vehicle based on k nearest neighbor regression. Journal of Nanoelectronics and Optoelectronics, 18(1): 25-32. https://doi.org/10.1166/jno.2023.3362
[6] Du, M., Mei, H. (2024). The application of virtual synchronous generator technology in inertial control of new energy vehicle power generation. Frontiers in Mechanical Engineering, 10: 1382664. https://doi.org/10.3389/fmech.2024.1382664
[7] Zafar, K., Kamaludeen, M.K., Esa, Y., Mohamed, A.A.A., Odie, S. (2024). Fault analysis for DC Bus-integrated energy storage system, electric vehicle supply equipment, and photo voltaic systems. Electric Power Systems Research, 234: 110837. https://doi.org/10.1016/j.epsr.2024.110837
[8] Cho, I.H., Park, S.Y., Kim, B.J., Kim, J.H. (2024). Redundant configuration and fault tolerance control method for enhanced reliability of energy storage system. IEEE Access, 12, 118733-118743. https://doi.org/10.1109/ACCESS.2024.3448507
[9] Liu, H., Song, X., Zhang, F. (2021). Fault diagnosis of new energy vehicles based on improved machine learning. Soft Computing, 25(18): 12091-12106. https://doi.org/10.1007/s00500-021-05860-9
[10] Meissner, E., Richter, G. (2003). Battery monitoring and electrical energy management: Precondition for future vehicle electric power systems. Journal of power sources, 116(1-2): 79-98. https://doi.org/10.1016/S0378-7753(02)00713-9
[11] Hassan, R., Wang, H., Zane, R. (2023). A new online continuous stability monitoring method for DC microgrids. IEEE Transactions on Power Electronics, 38(9): 10739-10749. https://doi.org/10.1109/TPEL.2023.3284512
[12] Kim, Y., Lee, I., Kang, S. (2015). Eco assist techniques through real-time monitoring of BEV energy usage efficiency. Sensors, 15(7): 14946-14959. https://doi.org/10.3390/s150714946
[13] Solano, J., Hissel, D., Pera, M.C. (2018). Fail-safe power for hybrid electric vehicles: Implementing a self-sustained global energy management system. IEEE Vehicular Technology Magazine, 13(2): 34-39. https://doi.org/10.1109/MVT.2017.2776670
[14] Gorelik, K., Kilic, A., Obermaisser, R., Müller, N. (2018). Modellprädiktives Energiemanagement mit Steuerung der Fahrzeugführung für automatisiertes Fahren. at-Automatisierungstechnik, 66(9): 735-744. https://doi.org/10.1515/auto-2018-0025
[15] Chen, J., Yang, Z.G. (2023). Failure analysis on the premature delamination in the power module of the inverter for new energy vehicles. Engineering Failure Analysis, 143: 106915. https://doi.org/10.1016/j.engfailanal.2022.106915
[16] Mittal, M., Verma, A., Kaur, I., Kaur, B., et al. (2019). An efficient edge detection approach to provide better edge connectivity for image analysis. IEEE Access, 7: 33240-33255. https://doi.org/10.1109/ACCESS.2019.2902579
[17] Salek, P., Tarasiuk, J., Wierzbanowski, K. (1999). Application of genetic algorithms to texture analysis. Crystal Research and Technology: Journal of Experimental and Industrial Crystallography, 34(8): 1073-1079. https://doi.org/10.1002/(SICI)1521-4079(199909)34:8%3C1073::AID-CRAT1073%3E3.0.CO;2-Z
[18] Zhang, L., Hu, Y., Chen, T., Wen, H., Zhou, P., Zeng, W. (2023). Novel freight train image fault detection and classification models based on CNN. International Journal of Computational Science and Engineering, 26(5): 567-578. https://doi.org/10.1504/IJCSE.2023.133690
[19] Quabeck, S., Shangguan, W., Scharfenstein, D., De Doncker, R.W. (2021). Detection of broken rotor bars in induction machines using machine learning methods. IEEJ Journal of Industry Applications, 10(6): 688-693. https://doi.org/10.1541/ieejjia.21000651
[20] Srinivasan, M., Kanewala, U. (2024). Improving early fault detection in machine learning systems using data diversity-driven metamorphic relation prioritization. Electronics, 13(17): 3380. https://doi.org/10.3390/electronics13173380