Gomathi S. Shanmugam*![]() | Manikandan M. Moovendran
| Manikandan M. Moovendran![]() | Kannan S. Shanmugam
| Kannan S. Shanmugam![]() | Roopa Chandrika Rajappan
| Roopa Chandrika Rajappan![]()
© 2025 The authors. This article is published by IIETA and is licensed under the CC BY 4.0 license (http://creativecommons.org/licenses/by/4.0/).
OPEN ACCESS
Automated early detection of breast cancer using Computer Aided Diagnosis (CAD) is the most important step in extending the cancer patient’s lifetime. However, achieving this with the CAD model, high accuracy in mammogram image analysis remains a challenge with the numerous machine learning (ML) algorithms. Sometimes, the medical practitioner needs a second opinion with this automated result. This motivated me to find a robust and reliable disease classification model to enhance the classification performance. Deep learners (DL) are the most powerful tool in extracting complex features, such as subtle abnormalities in complex images. The machine learning algorithm will classify the images with the optimal feature set to overcome the overfitting problem, and in this way, it achieves a higher accuracy than the existing traditional and other machine learning algorithms. This paper presents a new framework that integrates AdaBoost (ML) with two popular CNNs: AlexNet and ResNet (DL). AlexNet is used for feature extraction, and ResNet approaches vanishing gradient issues with a residual learning framework. The proposed model is a hybrid DL combination integrated with features coming from the CNN, which captures inherent characteristics of mammogram images to be exploited by AdaBoost acknowledged for its strong classification power. The proposed hybrid model is trained and tested on a wide publicly available mammogram dataset and achieves a high classification rate in terms of sensitivity (90%) and specificity (92.8%) in testing.
breast cancer, mammogram, deep learning, AlexNet, ResNet, machine learning, AdaBoost, early diagnosis
Breast cancer (BC) is one of the major causes of death causing disease among women worldwide. Early detection and optimal treatment are crucial for early detection [1]. Mammography is a standard screening test for early-stage cancer, but interpretation by human radiologists is challenging due to the complexities of early-stage tumors. Artificial intelligence and machine learning have provided new solutions to enhance diagnostic performance, with deep learning models like AlexNet and ResNet showing promise for medical image analysis.
This research proposes an AlexNet+ResNet hybrid approach, which combines AdaBoost, a powerful ensemble machine learning method, to improve classification performance. This hybrid model aims to minimize false positive results and is capable of early breast cancer diagnosis. Tested on a diverse dataset of mammogram images, the integrated approach is more reliable and efficient, improving patient outcomes and screening pertinence [2]. This advance in automated learning and recognition of differences between common materials is one more step towards pushing diagnostic capabilities by combining deep understanding with machine methods.
Bania et al. [3] proposed a method relying on (1) feature extraction with the discrete Chebyshev transform for mammogram images as well as fine-tuning features from kernel principal component analysis and formulates an optimized kernel extreme learning machine to classify tumors. Experimental results show that the proposed method obtains 100% in normal-abnormal classification and 99.93% in malignant-benign classification, respectively, on the MIAS dataset and INbreast dataset. Results: Our results show that the proposed motif identification algorithm outperforms existing techniques such as MEME, Gibbs-sampling, and local search methods; this is supported by ANOVA testing, indicating it has better accuracy.
The method proposed by Gautam et al. [4] consists of four stages: preprocessing, segmenting the processed image to regions, extracting features, and classifying it. Preprocessing is the operation of removing noise from raster images, thus preparing mammograms for further analysis. Segmentation- Splits the process into smaller parts where detailed examination is conducted to isolate areas of interest. We compute the texture elements from these regions through feature extraction, using pseudo-grain moments, capable of capturing noise tolerant and more affluent code descriptive power. A support vector machine classifies the mammograms of interest into malignant or normal. Results: Experiments demonstrate that the proposed method is effective and has good accuracy, specificity, and sensitivity.
This research provides a novel approach to an essential problem of early detection of breast cancer at the pectoral muscle boundary from mammogram images. This model was developed by Ittannavar and Havaldar [5]. The model enhances the quality of the image, segmenting both cancerous and non-cancer regions and extracting features in many ways. It applies a genetic algorithm to an infinite feature selection process, in which a deep neural network finally learns the identified relevant features. This yields a 0.10–0.7% accuracy improvement over baselines at various levels of pruning ratios.
Deshmukh et al. [6], present an ensemble-based classifier for early breast cancer detection of two different classifiers to generate a fusion model based on the combination of support vector machine (SVM) and boosting. The firefly algorithm is implemented to reduce the variance of features for better classification processes. The wavelet packet transform method is used for feature extraction, which diversifies the feature and improves it compared to traditional wavelet transform methods.
Boumaraf et al. [7] present a CAD system to categorize mammographic masses in four BI-RADS assessment categories. Mass regions are initially enhanced using histogram equalization and semi-automatically segmented with a region-growing technique. The system identifies 130 BI-RADS features relevant to mass shape, margin, density, size, and patient age. To resolve the above problem, a pressure vessel fault diagnosis method based on least squares support vector machine (LS-SVM) and genetic algorithm neural network GA-BP was proposed. The characteristic selection adopts augmented gene-based encoding with efficient feature evolution methods of continuous-modified genetic algorithm (cGA). Performance evaluation was conducted using 500 mammogram images of the full-field digital access (FFDM) original passage from the DDSM article.
The discriminative fine-tuning approach formulated by Adedigba et al. [8] further dynamically sets the learning rate of each layer in a deep CNN. It also includes mixed-precision training, reducing the need for computational power-an essential factor in simplifying deep learning model training. Finally, methods for data augmentation of mammograms are introduced. The discriminative fine-tuning model converged quickly, so the models were trained to their best-performing point within 50 epochs with a batch size of ~42K. DenseNet achieved the best testing accuracy of 0.998, compared to AlexNet, which got 0.988.
The proposed technique aims to establish a robust mechanism on mammogram scans to detect breast cancer cells in their early stages that Basheri [9]. Mammograms are the medical standard for the initial stage in which specialists determine breast cancer. An Adaptive Deep Convolution Neural Network-based (ADCNN) method is used to detect BC signs in Mammogram images. The algorithm aims to classify BC as Normal, Benign, and Malignant positive from the images. Given these points, we experiment with the study to confirm our prediction in which region has developed into an infection, and it reveals a high cancer cell convergence area that uses a convolutional neural network-based method with 99% accuracy.
Gnanasekaran et al. [10] proposed an Intelligent Breast Mass Classification Approach using Archimedes Optimization Algorithm with Deep Learning (BMCA-AOADL) On Digital Mammograms. Bio-inspired Metaheuristic Breast Mass Classification Using Adaptive Optimal DL (BMCA-AOADL) technique focuses on solving the primitive aim of utilizing the DL model for breast mass classification. Pre-processing is done with median filtering (MF)-based noise removal and U-Net segmentation in the BMCA-AOADL approach. BMCA-AOADL uses the SqueezeNet model for feature extraction and AOA as a way to tune hyperparameters. It utilises the deep belief network approach to detect and classify breast mass as the PartBMCA-AOADL technique. The trainers of the control method check the simulation value out on the MIAS dataset, which can be acquired from the below Kaggle repository. Moreover, the experimental results have proven that the BMCA-AOADL method is superior to other DL algorithms and has the best accuracy of 96.48%.
Most recently, Patel [11] presented a CNN model with eight convolutional layers and four max-pooling layers on suitable locations combined with two single fully connected networks, which is much more beneficial than a pre-trained network like Alexandria net or VGG16 when classifying breast masses. The experimental results show that our model can perform well with accuracies of up to 96.47% and AUC scores as high as 0.96 tested on three different datasets: MIAS, DDSM, and an internal set). On integration and merging with another dataset, the accuracy of the model improved to 98.32%, along with an AUC score of approximately 0.98.
Chandraraju and Jeyaprakash [12] introduce a tumor classification algorithm based on CNNs as well for classifying breast mammogram images that, with the help of this approach, features can be extracted more effectively and rapidly training which does not work also crucial in practice indispensable nature is very beneficial. In this paper, we introduce an algorithm: With the new CNN model, which automatically isolates and identifies features without human intervention, reinforcement sample learning means to reduce training time. The model was trained with the dataset of 1000 training and 450 validation cases from DDSM using both CC0s, with/ an error rate upto ~11% within 150 epochs, also attaining a below 22%vh validation error. The results of the algorithm illustrate how large-scale feature extraction and classification in medical imaging can be realistically handled with CNNs.
Vikramathithan et al. [13] proposed an efficient breast cancer image classification framework based on a deep belief network (DBN) optimized by a chaotic krill herd optimization algorithm. The method is as follows, mammograms are pre-processed using the modified phase preserving dynamic range compression (APPDRC) to reduce noise and effects (Figure 1). From these pre-processed images, the DBN automatically separates them into regular and lesion classifications (normal, benign, malignant). Weight matrices of the self-attention convolutional neural network (SACNN) were optimized by improving the KHO algorithm CKHO: DBN generally lacks optimization methods for accurate classification, thus boosting classification performance.
The above existing papers show that the optimal feature extraction is one of the major concerns in the classification process. This is directly proportional to the accuracy of classification. The proposed model uses the hybrid framework to improve classification accuracy, combining deep learning algorithms for feature extraction and machine learning for classification. The result shows the improvement in the proposed work by combining it with other existing methods.
The above literature study on various traditional, machine learning, and optimization algorithms in medical image analysis, particularly mammogram classification, highlights their strengths and limitations [14, 15]. Traditional approaches, such as rule-based and statistical methods, rely on handcrafted features (e.g., texture, shape, intensity) and conventional classifiers like SVMs and decision trees. While interpretable, they struggle with complex patterns and high-dimensional data. ML methods, especially DL (e.g., CNNs, AlexNet, ResNet), have revolutionized feature extraction by automatically learning hierarchical representations, significantly improving tumor detection and classification accuracy. However, they require large labeled datasets and computational resources. Optimization algorithms (e.g., genetic, particle swarm, Lion and Wolf optimization algorithms etc) enhance feature selection, hyperparameter tuning, and network training, improving model efficiency and robustness. The proposed method integrates a deep learning algorithm for optimal feature selection with a machine learning algorithm for disease diagnosis.
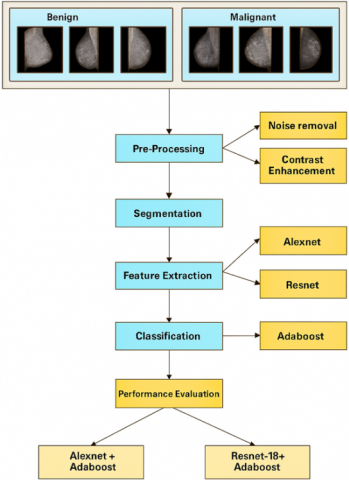
The proposed work aims to aid early breast diagnosis using mammogram images. The database pre-processing process includes Gaussian filtering to smooth images while preserving edges. Contrast Limited Adaptive Histogram Equalization (CLAHE) improve the contrast in images, adjusting contrast locally and enhancing the visibility of fine details. This method ensures essential features are preserved while maintaining smooth images. This approach enables better differentiation of different tissue types in mammogram images.
The noise removal process includes Gaussian filtering to smooth images while preserving edges. CLAHE increases the contrast in images, adjusting contrast locally and enhancing the visibility of fine details. This method ensures essential features are preserved while maintaining smooth images. This approach enables better differentiation of different tissue types in mammogram images.
The Fuzzy C-Means (FCM) algorithm is proposed for segmenting medical images and clustering images into regions corresponding to different anatomical structures or potential disease areas [16]. The algorithm uses deep learning models AlexNet and ResNet-18 for feature extraction, with AlexNet being efficient for general features and ResNet-18 learning deep, hierarchical features due to residual connections. These models form a rich representation of mammogram images with broad and intricate views, addressing intrinsic uncertainty in these images. The proposed workflow is shown in Figure 1.
Figure 1. Work flow of proposed work
AdaBoost, an ensemble learning method, is used for classifying mammograms into benign or malignant categories. It enhances the accuracy of weak classifiers by focusing on misclassified samples and adjusting the model accordingly. This integration aims to create a powerful diagnostic tool for early breast cancer detection, offering higher accuracy and reliability than traditional methods. This system could significantly improve clinical decision-making and patient outcomes in breast cancer screening programs.
3.1 Noise removal
Gaussian filtering is a cost-effective method for removing noise from images without losing edge information. It aids radiologists in accurately diagnosing mammograms by quickly rendering essential structures. The process involves convolution of the original image with a Gaussian kernel for different σ to create different blurred versions of the original image. The convolution occurs sequentially within the kernel's receptive field for each pixel, using the weights of the Gaussian filter.
Likewise, a kemel size $\alpha$ is typically chosen so that, as this covers the entire width $6 \alpha \times 6 \alpha$ of a Gaussian distribution.
The elements of the Gaussian kernel are computed using the Eq. (1):
$K(i, j)=\frac{1}{2 \pi \alpha^2}\, exp -\frac{(i-m)^2+(j-n)^2}{2 \alpha^2}$ (1)
where, (i, j) are the coordinates in the kernel. (m, n) is the center of the kernel. K(i, j) stands for the weight, determined during convolution process of all neighboring pixel.
So, to perform a convolution, we slide the kernel over each pixel of our image and compute as there would be weight from the Gaussian kernel generated around that point in a new clear place where zeroes otherwise will take up some value, which represents the weighted sum of neighboring pixels.
The Convolution Operation Equation:
$I^{\prime}(x, y)=\sum_{i=-m}^m \sum_{j=-n}^n I(x+i, y+j) \cdot K(i, j)$ (2)
where,
I(x, y) is the original pixel value at position (x,y).
I'(x, y) is the new pixel value after applying the filter.
K(i, j) is the Gaussian kernel weight.
m and n are the half-width and half-height of the kernel, respectively.
3.2 Contrast enhancement
CLAHE is used in medical imaging, particularly in mammography, to normalize the intensity of an image. It works on small regions of an image called tiles, focusing on applying Contrast Enhancement. AHE divides the image into tiles, which are then equalized independently, boosting local contrast and making more minor details more visible. CLAHE also adds a contrast limiting step to prevent over-amplification of noise by cropping the histogram at a user-defined threshold and remapping the cropped pixels.
Step 1: Histogram Calculation
Compute the histogram H(i) for each tile, where i is the intensity levels of the pixels inside the tile.
Step 2: The Cumulative Distribution Function (CDF) The CDF for the histogram is computed as:
$\operatorname{CDF}(\mathrm{i})=\sum_{\mathrm{j}=0}^{\mathrm{i}} \mathrm{H}(\mathrm{j})$ (3)
The CDF is then normalized to align the intensity values with the intended range.
Step 3: Histogram Clipping
A clip limit is a predefined threshold that restricts the maximum value of a variable or parameter T. Truncate the histogram H(i) to a certain range.
$\mathrm{H}^{\prime}(\mathrm{i})=\min (\mathrm{H}(\mathrm{i}), \mathrm{T})$ (4)
The surplus pixels are evenly distributed throughout the histogram bins.
Redistribution Amount $=\frac{\mathrm{i}(\mathrm{H}(\mathrm{i})-\mathrm{T})}{\text { Number of bins }}$ (5)
Modify each bin by including the redistribution amount to maintain a consistent total number of pixels.
Sep 4: Mapping to the intensities
The intensity value for each pixel in the tile is determined via equalization:
$\begin{aligned} & \mathrm{I}^{\prime}(\mathrm{x}, \mathrm{y})=\text { min inensity }+(\mathrm{I}(\mathrm{x}, \mathrm{y})- \text { min inensity }) \cdot \frac{\operatorname{CDF}(\mathrm{I}(\mathrm{x}, \mathrm{y}))-\mathrm{CDF}_{-} \text {min }}{1-\text { CDFmin }}\end{aligned}$ (6)
I(x, y) is the original intensity and I'(x, y) is the new intensity.
Step 5: Bilinear interpolation is used to calculate the intensity for each pixel in the overlapping zone between tiles
$\begin{gathered}I_{\text {final }}(x, y)=w_1 I_1(x, y)+w_2 I_2(x, y)+w_3 I_3(x, y)+w_4 I_4(x, y)\end{gathered}$ (7)
where, $I_1, I_2, I_3, I_4$ are the intensities from the neighboring tiles, and $w_1, w_2, w_3, w_4$ are the interpolation weights.
3.3 Image segmentation
The fuzzy c-means (FCM) algorithm is a flexible clustering method that allows each data point to exist as an element with membership in multiple clusters. It makes it more flexible for image segmentation than brutal clustering methods like K-Means. The objective function assigned by FCM is the sum of squared errors weighted, representing the degree of membership.
$\mathrm{J}_{\mathrm{m}}=\sum_{\mathrm{i}=1}^{\mathrm{N}} \sum_{\mathrm{j}=1}^{\mathrm{C}} \mathrm{u}_{\mathrm{i}_{\mathrm{j}}}^{\mathrm{m}}| | \mathrm{x}_{\mathrm{i}}-\mathrm{c}_{\mathrm{j}}| |^2$ (8)
where,
N represents the total count of data points, which in the context of image segmentation refers to the number of pixels.
C represents the quantity of clusters.
The variable $u_{i j}$ represents the membership degree of data item $x_i$ in cluster $j$.
The fuzziness exponent, denoted as m, determines the degree of cluster fuzziness.
Typically, $\mathrm{m}>1$ and a common choice is $m=2$.
xi is the i-th data point (pixel intensity).
ci is the centroid of cluster j.
$\left|\left|\mathrm{x}_{\mathrm{i}}-\mathrm{c}_{\mathrm{j}}\right|\right|^2$ is the Euclidean distance between data point xi and cluster centroid cj.
Membership Function
The membership degree $u_{i j}$ is a scalar ranging from 0 to 1, representing the association level between the data item $x_i$ and cluster $j$. The calculation is performed as
$\mathrm{u}_{\mathrm{ij}}=\frac{1}{\sum_{\mathrm{k}=1}^{\mathrm{c}} \frac{\left\|\mathrm{x}_{\mathrm{i}}-\mathrm{c}_{\mathrm{j}}\right\| \wedge\left(\frac{2}{\mathrm{~m}-1}\right)}{\left\|\mathrm{x}_{\mathrm{i}}-\mathrm{c}_{\mathrm{k}}\right\|}}$ (9)
The Eq. (9) ensures that the sum of the membership values for each data point across all clusters Eq. (1):
$\sum_{j=1}^c u_{i j}=1$ (10)
Cluster Centroid Update
The centroids cj of the clusters are recalculated in each iteration based on the membership values:
$c_j=\frac{\sum_{i=1}^N u_{i j}^m \cdot x_i}{\sum_{i=1}^N u_{i j}^m}$ (11)
The centroid of each cluster is determined by calculating the weighted average of all data points, with the weights being the membership degrees increased to the power of m.
4.1 AlexNet for feature extraction
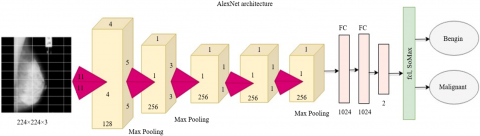
AlexNet, a deep CNN architecture, significantly influenced image classification and feature extraction using DL. In mammogram images, AlexNet extracts crucial features for tumor detection and classification. The architecture of a layered view detail is shown in Figure 2.
Figure 2. AlexNet architecture
AlexNet is a network architecture used for feature extraction in mammogram images. It starts with an input layer, which is resized to 227 × 227. The network then includes five convolutional layers, each applying filters to extract features like edges and textures. The output feature map Fl from a convolutional layer is calculated using the input layer and the convolutional layer's filters. The output feature map F is then calculated using the output feature map S.
$F_{i j, j k}^l=\sigma\left(\sum_{m=1}^{M^{l-1}} \sum_{u=0}^{U-1} \sum_{\substack{v=0 \\ }}^{V-1} W_{u v v m k}^l \cdot F_{i+u, j+v, m}^{l-1}+b_k^l\right)$ (12)
where, $F_{i, j, k}^l$ represents the level of activation at the $(i, j)$ coordinates in the $k^{\text {th }}$ feature map of the $l^{\text {th }}$ layer.
The weight at the point $(u, v)$ that links the $m^{\text {th }}$ feature map from the prior layer to the $k^{\text {th }}$ feature map from the present layer is denoted as $W_{u, v, m, k}^l$.
The word $b_k^l$ represents the bias for the $k^{t h}$ feature map, whereas $\sigma$ is the activation function, often ReLU.
After the convolutional operations, max-pooling reduces spatial information by placing a pool region and picks up the maximum value inside that pooling window; hence, it decreases the number of pixels but saves insightful data determined as X. After convolutions are followed by pooling operation, feature maps enter to the fully-connected layer where high-level features came into consideration during Y. The final output is extracted from the second fully connected layer as a feature vector and can be passed to study further or classify mammogram images.
Max-pooling layers downsample the feature maps produced by convolutional layers, without losing important spatial information using $P_{i, j, k}^l=\max _{u, v} \in R F_{i, j, k}^l$ to choose maximum value within a pooling region. Flattening the feature maps after convolution and pooling steps, followed by passing through fully connected layers, helps identify high-level features, as shown in $z^l=\sigma W^l z^{l-1}+b^l$. We take the second fully connected layer as the output of our final production in binary, and we will get features that can further be used for mammogram image analysis/classification.
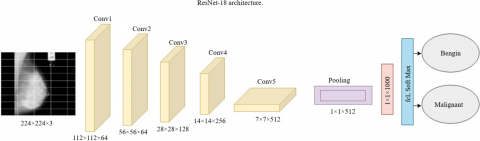
4.2 ResNet-18 for feature extraction
ResNet-18 is a deep residual learning framework used for feature extraction in mammogram images. It starts with a CNN layer learning a 7×7 filter with stride equals two and max-pooling. The architecture has four stages, each with two residual blocks and three 3×3 convolutional layers. Batch normalization and ReLU activation are performed after each convolution operation. The detailed features extracted is given in Table 1.
Table 1. Details of Features and its corresponding layers
|
Name of Layer |
Feature Name |
Types of Features Extracted |
Mathematical Equation |
|
First Convolutional Layers |
Edge Features |
Low-Level Features: Identifies elementary geometric patterns such as edges, corners, and fundamental forms in the mammography. |
Eq. (12) |
|
Intermediate Convolutional Layers |
Texture Features |
Mid-Level Features: Identifies textures and patterns within breast tissue, such as glandular or fatty tissue textures. |
Continuation of convolution, with ReLU activation: $\sigma(x)=\max (0, x)$ Extracts more abstract features by combining simple ones. |
|
Deeper Convolutional Layers |
Shape Features |
High-Level Features: Detects intricate forms and arrangements, such as lumps, cancers, or other irregularities. |
$P^l{ }_{i, j, k}=\max _{u, v} \in R F^l{ }_{i, j, k}$ dimensions while focusing on prominent features. |
|
Fully Connected Layers |
Semantic Features |
Complex Patterns: Integrates advanced characteristics to comprehend the complete framework, facilitating the categorization as either benign or malignant. |
Linear combination: $z^l=\sigma W^l z^{l-1}+b^l$ |
Figure 3. ResNet-18 architecture
Mathematically, the outputs of each block (where $\mathrm{W}^{(1+1)}$ are weights, $\mathrm{b}^{(1+1)}$ - bias and $\mathrm{F}^{\mathrm{l}}$ is ReLU function) can be defined as $\mathrm{F}^{1+1}=\sigma \mathrm{F}^1+\mathrm{W}^{(1+1)} * \mathrm{~F}^1+\mathrm{b}^{1+1}$. The integral part of ResNet is the identity shortcut connection (right branch), which lets skip the convolutional layers during training and modifies H to $\mathrm{F}+\mathrm{H}$ instead of learning residual mappings rather than direct ones, thus addressing vanishing gradients. The feature maps are then averaged using a global average pooling layer after the last residual block to produce a final feature vector that passes through fully connected layers (FLC) of appropriate size. Feature Vector This feature vector can be used for classification or to analyze the mammogram image further. Figure 3 shows the layered architecture of ResNet-18.
4.3 Machine learning- AdaBoost model for classification
AdaBoost is a ML technique that combines weak classifiers into a single strong classifier for mammogram classification. It starts by assigning balanced weights to all mammogram images in the training set, then trains weak classifiers iteratively while increasing the weights of misclassified images. The contribution of each weak classifier is weighed based on its accuracy and combined into the final strong classifier. This strategy is applied in a simple CNN architecture, providing an accurate and reliable diagnostic tool for mammogram classification.
A hybrid model for mammogram classification combines deep learning and conventional machine learning techniques to improve diagnostic accuracy. Pretrained deep learning models like AlexNet and ResNet-18 extract high-level features from mammogram images, which are then incorporated into a traditional machine learning classifier like AdaBoost. This model combines DL feature extraction capabilities with classical machine learning's interpretability, resulting in a stronger and more accurate classification of malignant and benign mammogram cases.
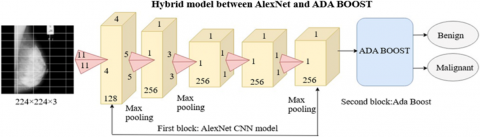
5.1 Model 1 (AlexNet+AdaBoost)
The hybrid approach uses AlexNet's deep learning features extraction and bagging method to improve AdaBoost classification accuracy by controlling stage size, achieving high classification accuracy over mammography images.
Adaptive Boosting, or AdaBoost, is an ensemble learning method that combines multiple weak classifiers to create a strong classifier. This is particularly helpful when you have a lot of features in your feature set, as it penalizes misclassified instances by assigning them higher weights in later iterations.
The hybrid architecture in Figure 4 utilizes the feature extraction ability of AlexNet together with the classification power of AdaBoost.
Figure 4. Hybrid model 1 architecture diagram
Feature Extraction
• The mammography pictures undergo AlexNet processing, extracting features from the fully linked layers.
• These characteristics include the essential data in the mammograms that may differentiate between various kinds of tissue and abnormalities.
Classification using AdaBoost
• The retrieved features are inputted into the AdaBoost classifier.
• AdaBoost repeatedly trains numerous weak classifiers on these features, progressively improving their performance by emphasizing the misclassified cases.
The final robust classifier, which is formed by combining several weak classifiers, determines the ultimate prediction about the mammography image.
Algorithm 1: For Proposed Model 1
Input: Mammogram image X, true labels yi.
Feature Extraction with AlexNet: Pass the image X through AlexNet to obtain the feature vector v.
$v=\operatorname{Alex} \operatorname{Net}(X)$ (13)
Classification:
Initialize the weights wi for the training samples.
For each iteration t = 1 to T.
Train a weak classifier ht(v) using the current weights.
Compute the error $\epsilon_t$ and the classifier weight $\alpha_t$.
Update the sample weights wi for the next iteration.
Combine the weak classifiers to form the final strong classifier H(v).
Output:
The final classification H(v) of the mammogram image, predicting whether the image is normal, benign, or malignant.
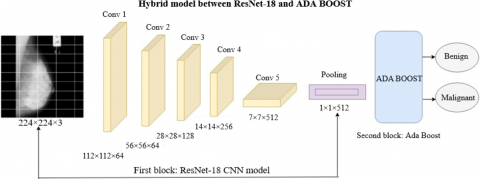
5.2 Model 2 (ResNet-18 + AdaBoost)
The ResNet-18 method for feature extraction on mammogram images employs a hybrid approach, using deep residual networks as weak classifiers and AdaBoost as a strong classifier. AdaBoost, derived from the Boston Consulting Group, combines multiple weak classifiers into a strong classifier, making it ideal for high-dimension feature vectors. Figure 5 shows the new hybrid proposed model.
Figure 5. Hybrid model 2 architecture diagram
Algorithm 2: For Proposed Model 2
Input: Mammogram image X, with true labels yi
Feature Extraction with ResNet-18:
Pass the image X through ResNet-18 to obtain the feature vector v
$v=$ Resnet $-18(X)$ (14)
Initialize weights: Start by assigning equal weights to all training samples $w_i=\frac{1}{N}$ for N samples.
Iterate over weak Learners:
For t = 1 to T
Train Weak Classifier: Train a weak classifier ht(v) on the feature vector v with the current weights wi(t).
Calculate Error:
$\epsilon_t=\sum_{i=1}^N w_i^t \cdot I\left(h_t\left(v_i\right) \neq y_i\right.$ (15)
where, $y_i$ is the true label, and $I(.)$ is the indicator function.
Compute Classifier weight:
$\boldsymbol{\alpha}_t=\frac{1}{2} \operatorname{In} \frac{1-\epsilon_t}{\epsilon_t}$ (16)
Update Weights
$w_i^{t+1}=w_i^t \cdot \exp \left(-\alpha_t \cdot y_i \cdot h_i\left(v_i\right)\right)$ (17)
Normalize the weights so that $\sum_{i=1}^N w_i^{t+1}=1$
Final Strong Classifier
Combine the weak classifiers to form the final strong classifier
$H(v)=\operatorname{sign} \sum_{t=1}^T \alpha_t \cdot h_t(v)$ (18)
6.1 Dataset description
The proposed method uses standard mini MIAS datasets to classify breast cancer. The mini MIAS dataset contains 322 images in PGM format, divided into three sets. The dataset includes 61 images for benign, 52 malignant, and 209 standard cases as positives. The data is split into 80% for training and 20% for testing, with 80% for training and 20% for testing.
One of the problems in this dataset is smaller in size and the existence of class imbalance. Class imbalance is one of the significant metrics in classification, which minimizes classification performance. To overcome this problem, class weights are used during model training, which penalizes the model more for misclassifying the minority class, making it pay more attention to those examples.
6.2 Result analysis
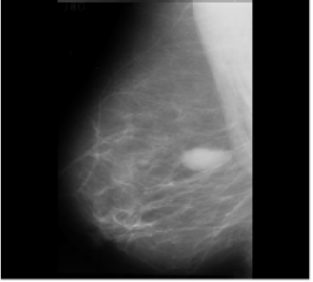
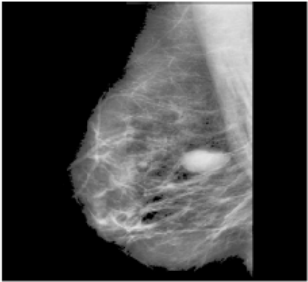
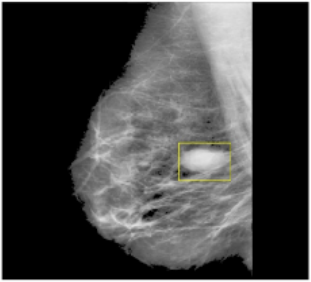
The study examines the visual outcomes of applying a proposed model to pre-process and segment benign images. The model effectively identifies tumor bulk within everyday imagery, as shown in Figures 6(a) and 6(c), comparing original and segmented images.
Figure 6. Visualization of proposed methodology on input image (a) Original Image (b) Preprocessed (c) Segmented Image
The proposed approach effectively preprocesses and segments cancer images, as demonstrated in Figure 6. The mammography input is shown in Figure 6(a), while the preprocessed and segmented versions are given in Figure 6(b), demonstrating the method's effectiveness in identifying tumor masses. Different quality parameters are used to attain the classification performance in the below Eqs. (19) to (21).
$\operatorname{Accuracy}(A C C)=\frac{T P+T N}{T P+T N+F P+F N} * 100$ (19)
$\operatorname{Sensitivity}(Sen)=\frac{T P}{T P+F N} * 100$ (20)
$\operatorname{Specificity}(Spe)=\frac{T N}{T N+F P} * 100$ (21)
The simulation produces average results compared to MIAS due to the size of the input mammogram images. Of 569 images, 341 were used for training and 248 for testing. Two CNN models, AlexNet and ResNet-18, were used to diagnose the pictures. The hybrid approaches with deep and machine learning were tested using the same dataset. Two pre-trained network models were used to extract a single-layered feature map of each image, which was then transmitted into an AdaBoost classifier for diagnosis. The confusion matrix includes True Positives (TP), False Positives (FP), True Negatives (TN), and False Negatives (FN).
As a result, statistical analyses are not the primary method used in mammogram classification because they do not directly assess the model’s diagnostic performance. Whereas, accuracy, sensitivity, and specificity for a particular model assess how well the model can identify cancerous and non cancerous tissues, general statistical measures provide merely descriptive information without considering clinical significance. The main aim in medical imaging is to reduce the number of false positives and negatives right from the beginning. As a result, statistical analysis is not good enough to evaluate the real world effectiveness of a classification model in the context of detecting breast cancer.
The proposed model achieves results for accuracy (87.09%), sensitivity (83%) and specificity (90%).
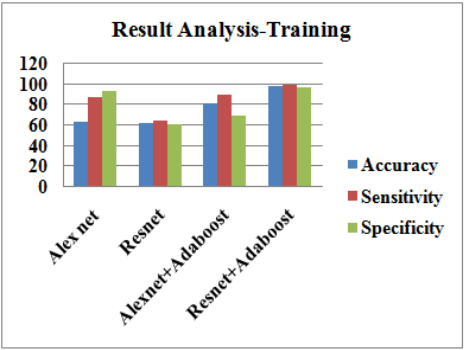
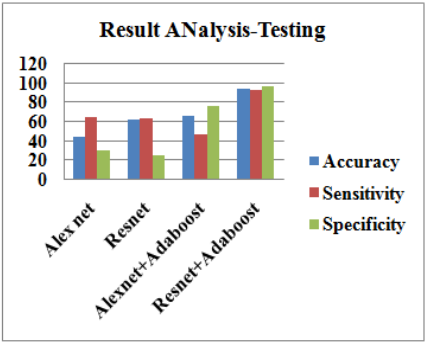
A 2D Gaussian filter was used to apply noise to a dataset before feeding it into a model, aiming to enhance diagnostic accuracy over CNN models. The overall performance of the system in training and testing modes is shown in Table 2. This approach makes the dataset learn faster and costs less, working on available computational resources economically. The results for each deep learning and hybrid model are summarized in Table 3. ResNet+AdaBoost was the best hybrid, with an accuracy of 98.5% in training and a sensitivity of 98.5% in testing. The system's specificity reached almost 97.5%.
Table 2. Parameter setting [17]
|
S.no |
Parameter |
Value |
|
1 |
Minimum size of batch |
10 |
|
2 |
Maximum Epochs |
20 |
|
3 |
Learn rate drop factor |
0.5 |
|
4 |
Initial learn rate |
1e-4 |
|
5 |
Learn rate drop period |
5 |
Table 3. Performance comparison
|
|
AlexNet |
ResNet |
AlexNet+AdaBoost |
ResNet+AdaBoost |
||||
|
|
Training |
Testing |
Training |
Testing |
Training |
Testing |
Training |
Testing |
|
Accuracy |
63.4 |
43.8 |
62.4 |
62.2 |
81.5 |
81.5 |
98.5 |
94.2 |
|
Sensitivity |
86.7 |
64.5 |
63.8 |
63.6 |
90 |
90 |
98.8 |
92.8 |
|
Specificity |
93.4 |
30 |
60.7 |
25 |
69.5 |
69.5 |
97.5 |
96.5 |
Figure 7. Performance of the proposed systems for the mammogram dataset
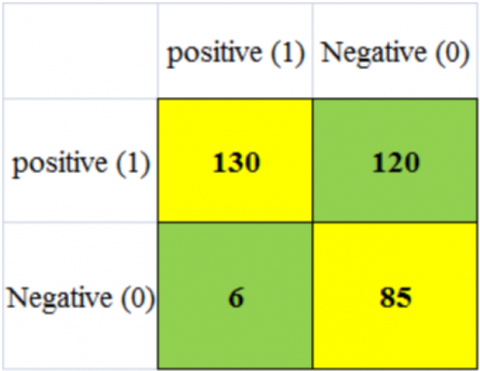
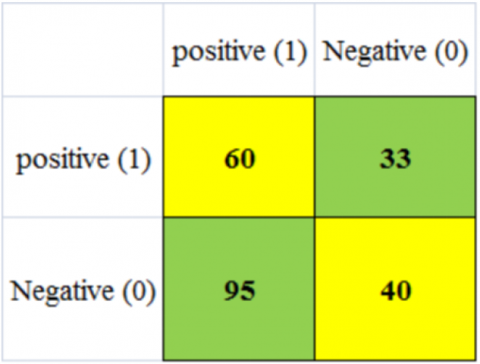
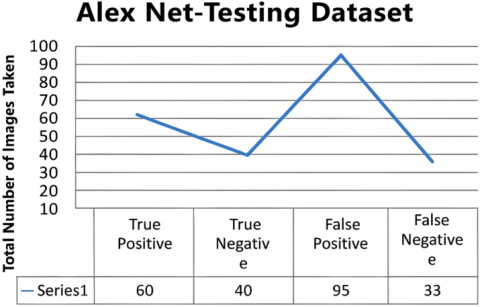
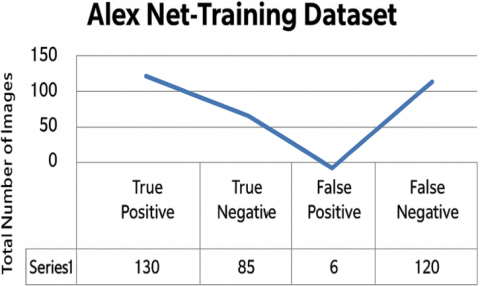
Figure 7 shows the training and test performance of the proposed model for breast tumors in early detection. Figures 8 (a) and 8(b) show the confusion matrix of the proposed work [18].
Figure 8. (a) AlexNet confusion matrix of training; (b) AlexNet confusion matrix of testing
Figures 9(a) and 9(b) show that the AlexNet model achieved a Malignant accuracy of 63.41% during training, with only over 341 images correctly estimated and fewer misclassified ordinary image classifications. In testing for malignant tumors, the model achieved an accuracy of 43.8%, with only 60 images correctly identified from a negative test set of 228. This resulted in fewer false labels compared to benign cases, with a score of 95 [19].
Figure 9. (a) Performance of AlexNet in training; (b) Performance of AlexNet in testing
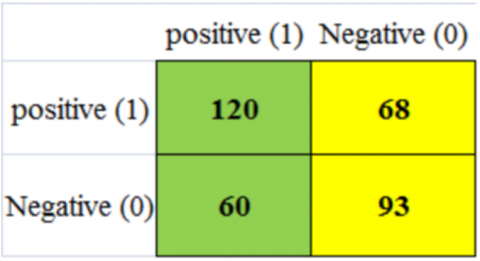
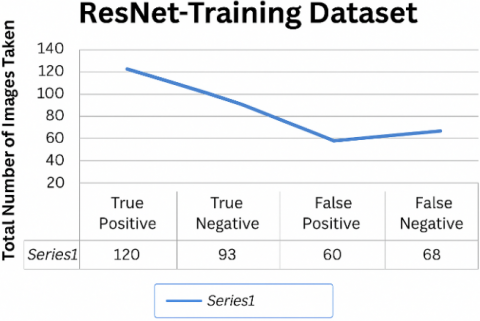
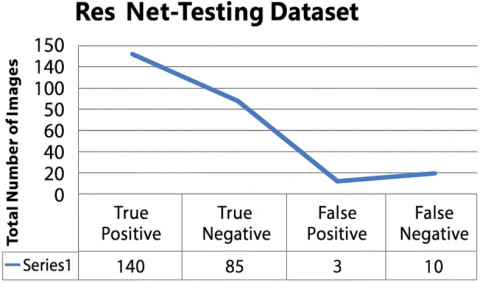
The ResNet-18 model achieved 80.4% accuracy for benign diagnosis, with 120 out of 341 images correctly classified as malignant. However, the model misclassified 60 out of 228 images. The model also achieved a low discrimination rate of malignant photos, with an overall discrimination rate of 0•45-36%. This result is shown in Figures 10(a) and 10(b).
Figure 10. (a) ResNet-18 Confusion Matrix of Training; (b) ResNet-18 Confusion Matrix of testing
Figure 11. (a) Performance of ResNet-18t in Training; (b) Performance of ResNet-18 in testing
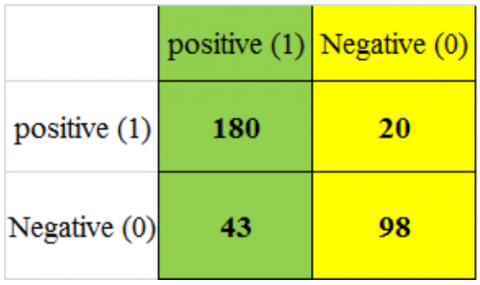
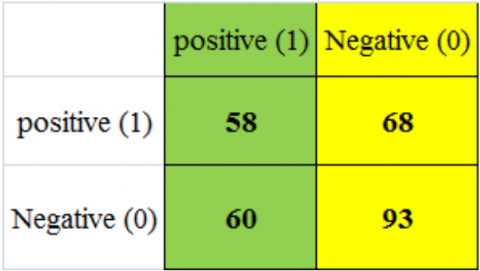
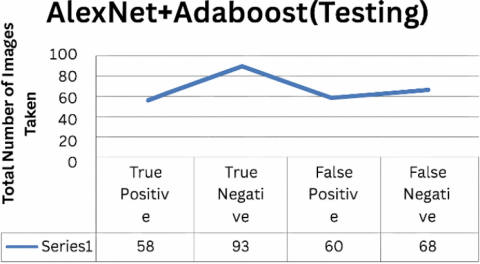
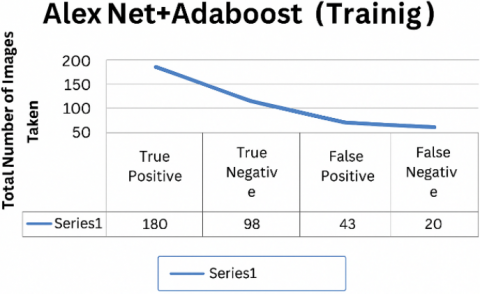
The hybrid AlexNet+AdaBoost model achieved an accuracy rate of 81.5% in recognizing 180 malignant images out of 357 photographs during the training phase and 66.2% in detecting malignant images during testing. The model correctly classified 58 out of 357 images and incorrectly categorized 60 out of 228 images, as shown in Figures 11(a) and 11(b). The system performance is depicted in the confusion matrix in Figures 12(a) and 12(b), and also in Figures 13(a) and Figure 13(b) [20].
Figure 12. (a) AlexNet with AdaBoost confusion matrix of training; (b) AlexNet with AdaBoost confusion matrix in testing
Figure 13. (a) Performance of AlexNet with AdaBoost in training; (b) Performance of AlexNet with AdaBoost in testing
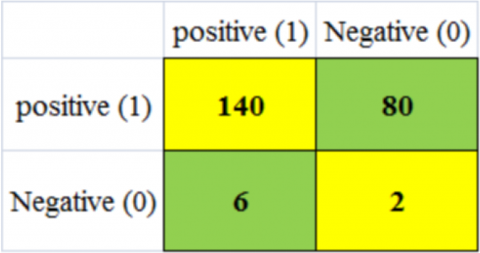
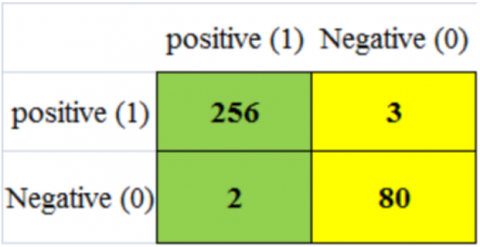
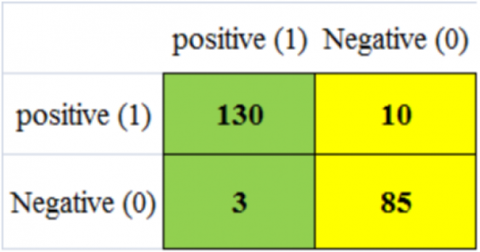
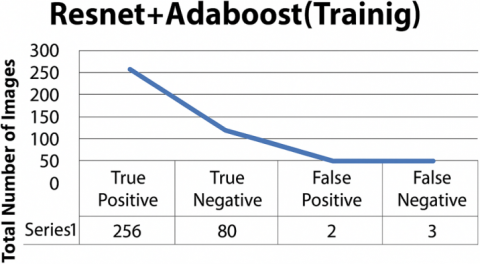
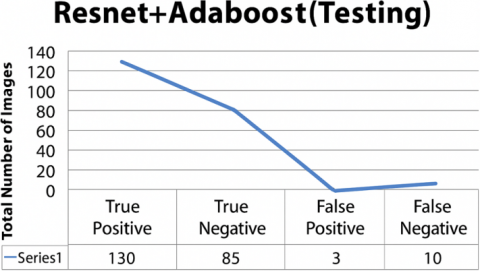
The hybrid model ResNet-18 + AdaBoost achieved a 98.5% accuracy in categorizing 256 out of 341 malignant photos during training, with only 2 out of 228 images incorrectly classified. The model also demonstrated a 94.2% accuracy in identifying malignant cases, correctly diagnosing 130 out of 341 photos, compared to a mere 3% accuracy in the testing phase. These research findings are shown in Figures 14(a) and 15(b) and also in Figures 15(a) and 15(b).
Figure 14. (a) ResNet-18 with AdaBoost confusion matrix of training; (b) ResNet-18 confusion matrix of testing
Figure 15. (a) Performance of ResNet-18 with AdaBoost in training; (b) Performance of ResNet-18 in testing
The complexity of mammograms makes it difficult to distinguish tumor stages, necessitating the development of automated techniques for tumor stage classification using DL and ML approaches. This work introduces a new method (AlexNet+AdaBoost) for content-based spam detection, combining deep learning models and machine learning methods. The experiment used two AlexNet algorithms, Resnet (ResNet-18) and AdaBoost, to improve classification performance accuracy. The AdaBoost algorithms are used to formulate diagnoses based on deep features. The study demonstrates how hybrid approaches between CNN models and the AdaBoost algorithm can reduce computational costs. The ResNet-18+AdaBoost hybrid model achieved maximum classification with 98.5% accuracy in training and 92.8% sensitivity and specificity in testing. In addition to this advancement, the proposed model acts as a second opinion for medical practitioner to diagnosis the disease.
[1] Gaona, Y.J., Rodríguez-Álvarez, M.J., Freire, J., Castillo, D., Lakshminarayanan, V. (2021). Preprocessing fast filters and mass segmentation for mammography images. Applications of Digital Image Processing XLIV, 11842: 352-362. https://doi.org/10.1117/12.2593939
[2] Devakumari, D., Punithavathi, V. (2020). Noise removal in breast cancer using hybrid de-noising filter for mammogram images. In Computational Vision and Bio-Inspired Computing: ICCVBIC 2019, pp. 109-119. https://doi.org/10.1007/978-3-030-37218-7_13
[3] Bania, R.K., Halder, A. (2020). Adaptive trimmed median filter for impulse noise detection and removal with an application to mammogram images. International Journal of Image and Graphics, 20(4): 2050032. https://doi.org/10.1142/S0219467820500321
[4] Gautam, N., Singh, A., Kumar, K., Aggarwal, P.K., Anupam. (2021). Investigation on performance analysis of support vector machine for classification of abnormal regions in medical image. Journal of Ambient Intelligence and Humanized Computing, 1-10. https://doi.org/10.1007/s12652-021-02965-9
[5] Ittannavar, S.S., Havaldar, R.H. (2022). Detection of breast cancer using the infinite feature selection with genetic algorithm and deep neural network. Distributed and Parallel Databases, 40(4): 675-697. https://doi.org/10.1007/s10619-021-07355-w
[6] Deshmukh, Y.S., Kumar, P., Karan, R., Singh, S.K. (2021). Breast cancer detection-based feature optimization using firefly algorithm and ensemble classifier. In 2021 International Conference on Artificial Intelligence and Smart Systems (ICAIS), Coimbatore, India, pp. 1048-1054. https://doi.org/10.1109/ICAIS50930.2021.9395788
[7] Boumaraf, S., Liu, X., Ferkous, C., Ma, X. (2020). A new computer-aided diagnosis system with modified genetic feature selection for BI-RADS classification of breast masses in mammograms. BioMed Research International, 2020(1): 7695207. https://doi.org/10.1155/2020/7695207
[8] Adedigba, A.P., Adeshina, S.A., Aibinu, A.M. (2022). Performance evaluation of deep learning models on mammogram classification using small dataset. Bioengineering, 9(4): 161. https://doi.org/10.3390/bioengineering9040161
[9] Basheri, M. (2023). Intelligent breast mass classification approach using archimedes optimization algorithm with deep learning on digital mammograms. Biomimetics, 8(6): 463. https://doi.org/10.3390/biomimetics8060463
[10] Gnanasekaran, V.S., Joypaul, S., Meenakshi Sundaram, P., Chairman, D.D. (2020). Deep learning algorithm for breast masses classification in mammograms. IET Image Processing, 14(12): 2860-2868. https://doi.org/10.1049/iet-ipr.2020.0070
[11] Patel, R. (2021). Predicting invasive ductal carcinoma using a reinforcement sample learning strategy using deep learning. arXiv preprint arXiv:2105.12564. https://doi.org/10.48550/arXiv.2105.12564
[12] Chandraraju, T.S., Jeyaprakash, A. (2022). Categorization of breast masses based on deep belief network parameters optimized using chaotic krill herd optimization algorithm for frequent diagnosis of breast abnormalities. International Journal of Imaging Systems and Technology, 32(5): 1561-1576. https://doi.org/10.1002/ima.22718
[13] Vikramathithan, A.C., Bhat, S.V., Shashikumar, D.R. (2020). Denoising high density impulse noise using Duo-Median filter for mammogram images. In 2020 International Conference on Smart Technologies in Computing, Electrical and Electronics (ICSTCEE), Bengaluru, India, pp. 610-613. https://doi.org/10.1109/ICSTCEE49637.2020.9277061
[14] Mathur, P., Sathishkumar, K., Chaturvedi, M., Das, P., Sudarshan, K.L., Santhappan, S., Icmr-Ncdir-Ncrp Investigator Group. (2020). Cancer statistics, 2020: Report from National Cancer Registry Programme, India. JCO Global Oncology, 6: 1063-1075. https://doi.org/10.1200/GO.20.00122
[15] Chowdhary, C.L., Mittal, M., Kumaresan, P., Pattanaik, P.A., Marszalek, Z. (2020). An efficient segmentation and classification system in medical images using intuitionist possibilistic fuzzy C-mean clustering and fuzzy SVM algorithm. Sensors, 20(14): 3903. https://doi.org/10.3390/s20143903
[16] Suradi, S.H., Abdullah, K.A., Isa, N.A.M. (2021). Breast lesions detection using FADHECAL and Multilevel Otsu Thresholding Segmentation in digital mammograms. In International Conference on Medical and Biological Engineering, pp. 751-759. https://doi.org/10.1007/978-3-030-73909-6_85
[17] Annamalai, T., Chinnasamy, M., Pandian, M.J.S.S. (2025). An accurate diagnosis and classification of breast mammogram using transfer learning in deep convolutional neural network. Traitement du Signal, 42(1): 343-352. https://doi.org/10.18280/ts.420129
[18] Gomathi, S., Chandrika, R.R. (2025). Advancing medical image processing with deep learning: innovations and impact. ICTACT Journal on Image & Video Processing, 15(3): 3489-3494. https://doi.org/10.21917/ijivp.2025.0494
[19] Chowdhary, C.L., Acharjya, D.P. (2020). Segmentation and feature extraction in medical imaging: A systematic review. Procedia Computer Science, 167: 26-36. https://doi.org/10.1016/j.procs.2020.03.179
[20] Guo, Z., Li, X., Huang, H., Guo, N., Li, Q. (2019). Deep learning-based image segmentation on multimodal medical imaging. IEEE Transactions on Radiation and Plasma Medical Sciences, 3(2): 162-169. https://doi.org/10.1109/TRPMS.2018.2890359