Malathi Marichamy*![]() | Nagarajan Pandian
| Nagarajan Pandian![]() | Sujatha Kesavan
| Sujatha Kesavan![]() | Mudassir Khan
| Mudassir Khan![]() | Sai Kiran Oruganti
| Sai Kiran Oruganti![]()
© 2025 The authors. This article is published by IIETA and is licensed under the CC BY 4.0 license (http://creativecommons.org/licenses/by/4.0/).
OPEN ACCESS
Cancer accounts for most deaths worldwide, and cases of brain and lung tumors are emerging at a rapid pace. Early detection is of prime importance for better patient outcomes, but the conventional methods of diagnosing cancer rely upon MRI scans, and they are time-consuming, two-dimensional, and a potential source of inaccuracies. In India alone, more than 70,000 cases are reported of lung cancer. About 50,000 individuals have brain tumors. This research uses deep learning models-sequential model and the pre-trained VGG-16 model-to provide accurate classification for brain and lung tumors from MRI and CT images. With a combination of machine learning and image processing, the automated system reduces false negatives and false positives, thereby attaining high accuracy in diagnosis. Additionally, the use of Explainable AI (XAI) techniques improves the interpretation of predictions by healthcare professionals. These advanced, automated solutions are thus directed toward enhanced early cancer detection in the pursuit of better patient outcomes.
tumor detection, machine learning in healthcare, XAI techniques (XAI), sequential model, VGG-16 model
Cancer screening has been one of the most influential factors in the global health landscape for a long time. Brain and lung cancers are particularly notable due to their high incidence rate and severe impact on patients’ health. To optimize treatment and reduce long-term consequences, it is crucial to make a diagnosis in a timely manner and accurate. However, in most cases, diagnosis relies on interpretation of medical images such as MRI’s or CT scans which tend to take a lot of time and may even have a subjective edge to it. These methods have their own limitations and therefore require the need for diagnostic tools that are not only effective but easily accessible. Fortunately, the medical and diagnostic field is being transformed with the assistance of artificial intelligence adaptive deep learning. Deep learning models are advanced and can pick out intricate patterns from images, just like the human brain does when viewing visuals. This makes the models ideal for complex tasks such as tumor detection. These models have recently also managed to outperform humans in terms of efficacy and precision making them indispensable tools in the medical field. The intention of this project is to employ the expertise of deep learning to create a proficient machine learning algorithm that is able to identify as well as detect tumors in the brain and lung from medical images. Utilizing specialized models like sequential models and VGG16, the system can simultaneously serve the purpose of detecting the presence of brain tumors and classify tumors as benign, malignant, or normal. The objective is to increase the accuracy of diagnosis, reduce the reliance on human input, and boost clinical decision-making by concentrating on the creation of effective solutions that are easy to execute. The research attempts major problems of cancer diagnosis by AI, transforming the method of cancer screening. These systems certainly are moving towards creating more efficient, convenient solutions to serve the field of medicine and help patients.
The advances in deep learning and machine learning have revolutionized medical imaging, which has greatly improved the identification and classification of tumors such as lung and brain. Suryani et al. [1] reported an accuracy of 98.51% for lung tumor localization using a segmentation-based deep fusion network with class activation mapping. The author proved that CNNs work effectively on multi-modal data; their result for non-small cell lung cancer achieved a classification accuracy of 96.79% [2]. The article presented a hybrid segmentation network for the detection of small cell lung cancer, using a combination of 2D and 3D CNNs. Their result had a mean Dice score of 0.888 [3]. The model optimized the adversarial learning models by the Taguchi method to get an accuracy of 89.55% in CT-based lung tumor classification [4]. Lung tumor detection was further enhanced through the combination of topological data analysis with machine learning for improved segmentation and classification [5].
Advancements in deep learning have also contributed to brain tumor detection. The propose work utilized a stacked classifier known as VGG-SCNet in achieving F1 scores greater than 99% for brain tumor MRI classification [6]. Nayak et al. attained 100% accuracy using advanced techniques to optimize a CNN architecture [7, 8]. The developed a hybrid CNN architecture by combining GoogleNet and SVM, and attained an accuracy of 98.1% in detecting tumors using MRIs [9] improved the classification accuracy to 98.7% by integrating SqueezeNet with an SVM classifier [10]. Hybrid approaches, such as low-rank tensor decomposition with machine learning [11, 12] and cross-transformer frameworks [13, 14], have further demonstrated robustness in brain tumor detection. The author [15, 16] presented the effectiveness of machine learning for pediatric brain tumor detection, citing its use in MRI image analysis. The dual-model approach [17, 18], that includes XAI (eXplainable Artificial Intelligence) techniques, deals with the issues of trust and interpretability in AI systems. Studies [19, 20] show that XAI methods, like LIME and SHAP enhance the transparency of autonomous disease prediction systems [21, 22]. A systematic review of 91 studies (2018-2022) highlights the role of XAI in improving transparency and decision-making in healthcare, manufacturing, and transportation [23, 24]. Saliency Maps (SMs) are particularly effective in visualizing decision-making processes, improving clinician trust and interpretability, especially in high-stakes applications like ophthalmology [25, 26]. With the boom of DL in medical image analysis [27, 28], XAI is important for ensuring reliability and trustworthiness in clinical settings [29, 30].
This survey synthesize progress in Machine learning, Deep Learning, and XAI, exhibit their potential for progressive impact on medical imaging and in the areas of transparency and model reliability.
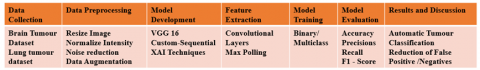
Figure 1 illustrates the structured process for identifying tumor, starting from data collection and concluding with results and analysis. It includes essential phases such as pre-processing, model development, feature extraction, model training, and evaluation metrics.
Figure 1. Methodology workflow diagram
The datasets for brain tumor and lung cancer detection are sourced from Kaggle's publicly available repositories. These datasets have been chosen as they are the most reliable ones to address the dual tumor detection task.
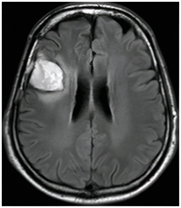
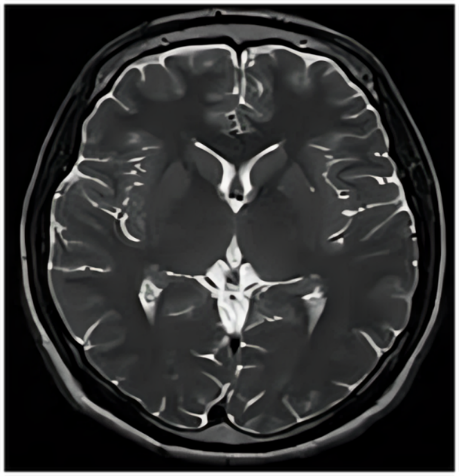
4.1 Brain tumor dataset
The Brain Tumor Dataset that has been fetched from Kaggle and Harvard Medical School is for binary classification with MRI scans. The set of images helps in training and testing the detection of brain tumor models in the machine learning setup. It can be divided mainly into two classes: Tumor (Yes): This class comprises 1526 images of MRI scans that indicate the presence of some growth or lesion inside the brain. These growths may include the different types of tumors like gliomas, meningiomas, and pituitary tumors. The presence of different types of tumors will ensure the model generalizes well to real-world scenarios, where tumors could present in a variety of shapes, sizes, and locations in the brain. These scans are very important for teaching the model to differentiate between healthy tissue and abnormal tissue. No Tumor (No): This is the category of 1587 MRI scan images of healthy brains showing no sign of tumor growth or abnormalities. These serve as a control group, with which the model learns what normal brain anatomy should look like. The absence of tumors in such scans helps it to reliably be able to distinguish and rule out false positives, enhancing its precision in diagnosis and limiting errors.
The training and testing data were divided into an 80/20 ratio. This guarantees that the training and evaluation are conducted in a balanced way, thereby resulting in a well-generalized and reliable model. About 2490 images, which represent 80% of the total 3113 images, are used to train the machine learning model. This training set includes both the Tumor and No Tumor classes. The model will be equipped to identify patterns and features that indicate whether there is or isn't a tumor. 623 images comprise 20% of the 3113 total images and are set aside for testing and evaluation. This unseen data will enable assessing the ability of the model to generalize and accurately classify MRI scans of brain tumors.
4.2 Lung cancer dataset
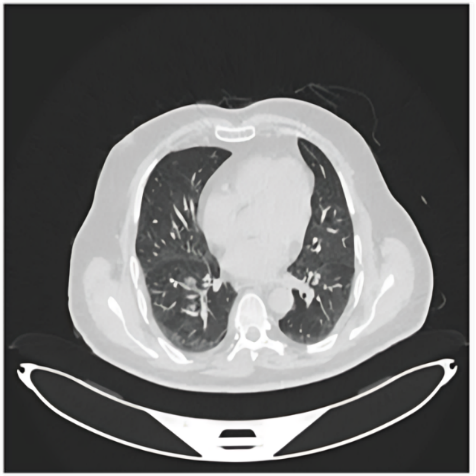
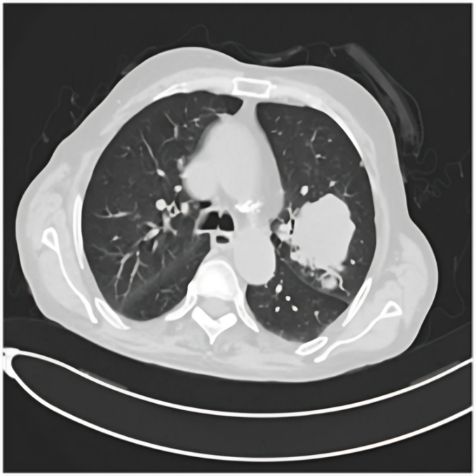
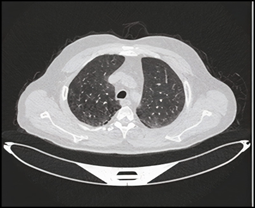
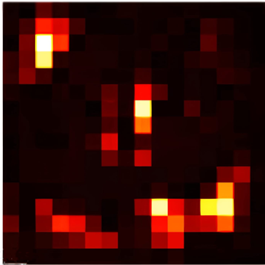
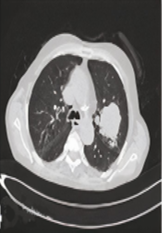
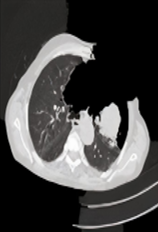
The Lung Cancer Dataset (IQ-OTH/NCCD), sourced from Kaggle, was collected at the Iraq-Oncology Teaching Hospital and the National Center for Cancer Diseases (IQ-OTH/NCCD) over a period of three months in the fall of 2019. This dataset contains CT scan slices from patients diagnosed with lung cancer in various stages, as well as healthy subjects. The dataset was labeled by experienced oncologists and radiologists at these specialist centers. The dataset comprises 1097 images, representing 110 cases. These cases fall into three categories based on the presence and type of lung condition. These categories are as follows:
Benign: The Benign category includes 120 images of non-cancerous lung growths or tumors. These tumors do not grow into adjacent tissues or metastasize to other areas of the body. However, although generally less dangerous than malignant tumors, benign tumors often require follow-up because of their potential to cause problems. This category allows models to learn to distinguish benign from malignant conditions. In doing so, models are trained to classify the images to ensure correct diagnosis of benign conditions. Malignant: Malignant has 561 images of lung cancers. Lung cancer invades adjacent tissue and may spread to other parts of the body. Early detection of malignant conditions ensures the survival and proper treatment of patients. This category is to help the model learn the identification and classification of cancerous conditions in a CT scan, which is very important for early detection of lung cancer. Normal: This category includes 416 images from normal patients who have no tumor. The images are a base for the model to learn characteristics of normal lung tissue. By recognizing normal tissue, the model can more accurately differentiate between benign, malignant, and healthy conditions, improving diagnostic precision and reducing the risk of false positives.
About 878 images, which account for 80% of the total, are used to train the machine learning model. This set contains a combination of benign, malignant, and normal images, helping the model differentiate between these categories, and 219 images, or 20% of the total, are used to test the model. It is through testing that the performance of the model can be measured on unseen data, thereby determining its ability to generalize and predict accurately on new images.
To further enhance model customization and usability, we applied data augmentation techniques such as rotation, zooming, and flipping. Strened marked redundancy was then reduced through application of Dropout layers after dense layers to mitigate co-adaptation between neurons. An 80:10:10 split ratio on train-validation-test sets was also established to observe generalizability measures. Absence of cross-validation metrics does not detract from validation outcome consistency confirming performance trend reliability across multiple repetitions. The combination of practices minimized overfitting alongside erosion of reliable learning factors.
The pre-processing pipeline for medical image datasets, ranging from CT scans of lung cancer to MRI scans of brain tumors, aims to standardize, enhance, and prepare images for models. Below is the list of pre-processing techniques applied uniformly on both datasets.
Resizing: All the images are re-sized to the same dimension, into 128×128 pixels so that data throughout the dataset can be standardized, as well as adhering to the model requirement.
Noise Reduction: Application of noise removal through techniques like Gaussian Blur, Median Filtering, and Bilateral Filtering to remove any sort of noise/scanning artifacts.
Convert RGB to Gray Scale: Grayscale conversion has been done since the complexity gets reduced and what is important are intensity-based features for medical diagnosis.
Sharpen: Unsharp Masking filters edge enhancement and emphasize finer details to be seen between tumor boundaries.
Edge Detection: This is done with the help of algorithms like Canny to give the edges related to the edges of tumors/lesions.
Morphological Transformations: Dilation, Erosion, Opening, and Closing operations are performed to enhance the segmented regions by eliminating small noise or filling holes, thus improving the precision of tumor boundaries.
Contours Detection: Contours are detected to point out important objects, such as tumors, and outline their borders for further analysis or measurement.
Segmentation: These more advanced segmentation algorithms, such as Watershed Segmentation, Region Growing, or k-Means Clustering, are utilized to isolate tumor regions or the area of an abnormal region of the tissue for precise analysis.
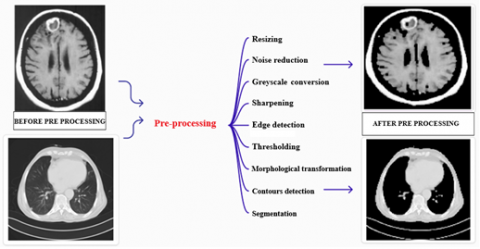
The output is a set of enhanced, segmented, and standardized images ready to be fed into machine learning models. Figure 2 shows the accurate results of images before and after pre-processing. This pre-processing pipeline is designed to prepare medical images by enhancing features, removing noise, and standardizing inputs, which enables the model to learn patterns efficiently and improve accuracy in tasks such as tumor detection and classification.
Figure 2. Pre-processing of MRI &CT images
6.1 Steps for the VGG16-based model
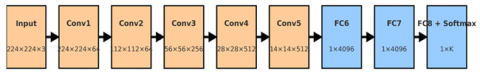
Step 1: Use the VGG16 model pre-trained on ImageNet as the backbone of the model shown in Figure 3. Retain its convolutional layers for feature extraction to capture rich spatial characteristics derived from the input images.
Step 2: Add a Flatten layer to convert the output of the convolutional layers into a one-dimensional array, then add a fully connected Dense layers that utilize ReLU activation for classification. Implement a Dropout layer after Dense layers to reduce overfitting, and finish with a Dense output layer with softmax activation, where the number of neurons matches the number of classes in the dataset.
Step 3: Compile the model with a loss function: Categorical Cross-entropy for multiple class classification, Binary Cross-entropy for binary classification, and use the Adam optimizer to modify the learning rate in real-time throughout the training process.
Step 4: Use the model to predict tumor classes:
Brain Tumors: Tumor Present, No Tumor.
Lung Tumors: Benign, Malignant, Normal.
Step 5: Calculate performance metrics. Tables 1 and 2 are the classification reports of Brain and lung tumors for model VGG-16.
6.2 Steps for the sequential model
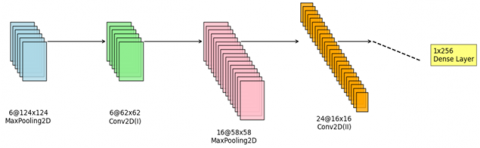
Step 1: Add Conv2D layers to obtain features from input images, and use MaxPooling2D layers to downsample feature maps, followed by multiple convolution and pooling layers to capture hierarchical features shown in Figure 4.
Step 2: Add a Flatten layer to transform two-dimensional feature maps into a one-dimensional array, then include Dense layers with ReLU activation for classification, and use Dropout layers to minimize overfitting.
Step 3: Add a Dense output layer with the number of neurons equal to the number of classes in the dataset and use softmax activation for multiple class classification or sigmoid activation for binary classification.
Step 4: Compile the model by selecting the suitable loss function: Binary Cross entropy for lung tumors (tumor or non-tumor), Categorical Cross entropy for brain tumors (four classes).
Step 5: Calculate performance metrics. Table 3 and 4 are the classification reports of Brain and lung tumors for the model Sequential.
Table 1. Brain tumor classification report-VGG16
|
Classification Report for VGG16 |
||||
|
|
Precision |
Recall |
F1- Score |
Support |
|
Class 0 |
0.78 |
0.82 |
0.80 |
50 |
|
Class 1 |
0.83 |
0.90 |
0.91 |
61 |
Table 2. Lung tumor classification report-VGG16
|
Classification Report for VGG16 |
||||
|
|
Precision |
Recall |
F1- Score |
Support |
|
Class 0 |
0.98 |
0.98 |
0.91 |
70 |
|
Class 1 |
0.93 |
0.95 |
0.90 |
78 |
Table 3. Brain tumor classification report-sequential
|
Classification Report for Sequential |
||||
|
|
Precision |
Recall |
F1- Score |
Support |
|
Class 0 |
0.77 |
0.81 |
0.79 |
42 |
|
Class 1 |
0.86 |
0.83 |
0.84 |
58 |
Table 4. Lung tumor classification report-sequential
|
Classification Report for Sequential |
||||
|
|
Precision |
Recall |
F1- Score |
Support |
|
Class 0 |
0.90 |
0.93 |
0.89 |
73 |
|
Class 1 |
0.96 |
0.98 |
0.90 |
86 |
Figure 3. Layer architecture of VGG16 model
Figure 4. Layer architecture of sequential model
The testing results from both the sequential and VGG16 models are depicted in the figures below, illustrating their performance across the brain and lung tumor detection tasks. For the sequential model and VGG16 the Figures 5 and 6 showcase its ability to differentiate between the categories of No Tumor and Tumor for brain tumor detection and Figure 7 Benign, Malignant, and Normal for lung tumor detection. Additionally, heatmaps and feature activation maps, where available, emphasize the regions of interest that the model focuses on for its predictions, providing a deeper perception of its decision-making process. The visual outputs of the testing images clearly display the predicted classifications, along with highlighted regions indicating the areas the models considered most significant. Examples of correctly and incorrectly classified images further demonstrate the advantages and drawbacks of every model. These outputs provide valuable insights to the model’s behavior, aiding into the refinement of their predictive capabilities for real-world applications.
Figure 5. Visualization of a detected tumor in brain
Figure 6. Visualization of a detected no tumor in brain
(a) Predicted class: Benign
(b) Predicted class: Malignant
(c) Predicted class: No tumour
Figure 7. Visualization of a detected benign, malignant and normal tumor in lung
XAI methods are of immense importance in understanding the actual process through which the decisions from the deep learning models are being generated, especially in high-stakes applications such as diagnostic medicine. In our paper, four prominent XAI techniques that include Occlusion Matrix, LIME (Local Interpretable Model-agnostic Explanations), Saliency Maps, and Partial Dependence Plots (PDP) have been used to add more transparency and trustworthiness to the Brain Tumors and Lung Tumors detection models. These may make insight concerning how the model predicts information, which is quite critical in validation of the results based on building trust, especially in the medical world where human life is at stake.
7.1 Occlusion matrix
The Occlusion Matrix technique works by methodically blocking various sections of the input images (masking certain regions) and observing how the model's prediction changes. The occlusion matrix will reveal the areas in both the brain and lung images that are most significant for the models prediction, such as tumor regions or anomalies. This will help radiologists and doctors focus on the areas that contribute most to the model’s decision, aiding into more accurate diagnosis. In the Figures 8 and 9 the dark regions indicate less critical for the model's decisions and bright regions indicates more critical, playing a significant role in the model's decision-making.
Figure 8. Occlusion map for lung and brain
Figure 9. Occlusion map for brain
7.2 Local interpretable model agnostic explanations (LIME)
LIME is a technique that estimates a complex model with an explicable, simpler model in the local vicinity of a given prediction. LIME generates local explanations of model predictions by examining different image segments. For both brain and lung tumor images, it emphasizes the most influential parts of the image, such as tumor boundaries or regions of interest. This will help doctors and radiologists validate whether the model is focusing on the right features for diagnosis. The corroded regions in Figure 10 indicate areas of the original image that were deemed irrelevant or unimportant by the model when making its prediction.
(a) Original image
(b) After lime
Figure10. LIME explanation for lung
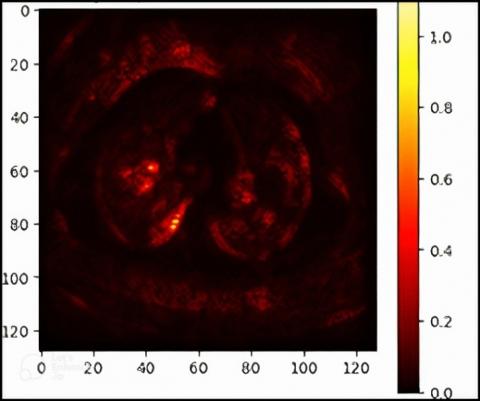
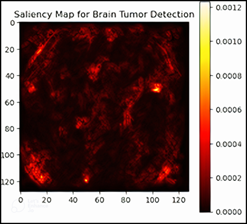
7.3 Saliency maps
Saliency Maps are essentially a visualization whereby gradients are computed to highlight strong areas of images that affect prediction by the models. The output of a saliency map is a sort of heatmap image that shows parts of the original image the network is considering vital.
In Figures 11 and 12 the warmer colors (red, yellow) typically indicate regions that are more salient, while other colors indicate less important areas. In the above figures, the bright red and yellow areas in the saliency map likely correspond to the regions where the model detected the presence of tumors.
Figure 11. Saliency map for lung
Figure 12. Saliency map for the brain
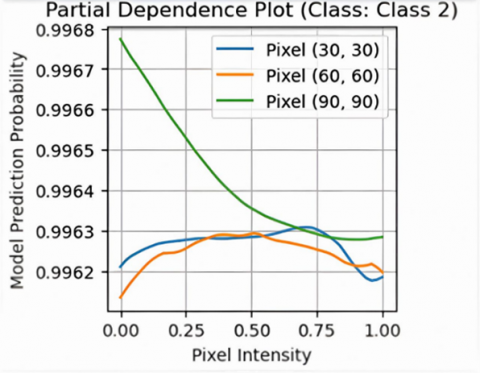
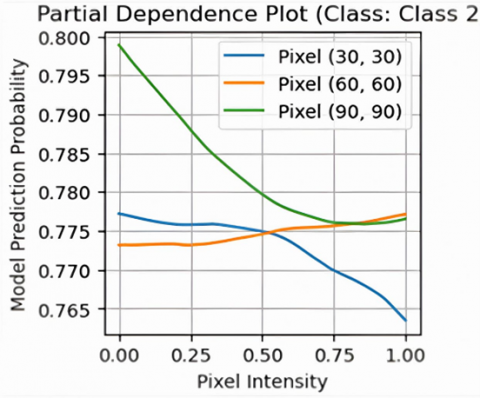
7.4 PDP
PDP illustrates shown in Figures 13 and 14, the relationship between specific features (or pixels) of an image and the predicted output. This technique helps to understand how variations in one or more features influence the model’s predictions. PDPs enable a granular inspection of what changes to the input image (like the intensity of a pixel) affect the model's choice. For brain and lung tumor detection, PDPs enable the demonstration of whether certain patterns in tissue or the tumor contribute to the model classifying it in this way.
Figure 13. PDP for lung
Figure 14. PDP for brain
This study introduced an approach to detect brain and lung tumors by deep learning methods combined with XAI techniques for clarity and transparency to doctors and radiologists. The study used two different models: Sequential (custom model) and VGG16 (pre-trained CNN model). The study obtained high diagnostic accuracy Refer Table 5, with the sequential model outperforming VGG16 in brain tumor detection (96% vs. 94%) and both models showing strong results for lung tumor detection, with Sequential at 98% and VGG16 at 99%. However, the VGG16 model showed potential overfitting, which means that a balanced approach is needed to avoid this issue.
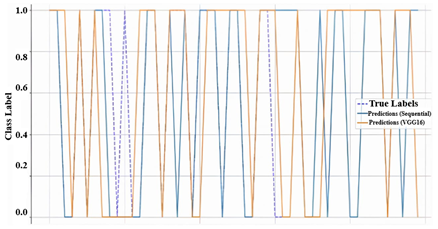
A Graph Figure 15 comparing the Sequential and VGG16 models' predictions for tumor classification shows that VGG16 (orange line) aligns more closely with the true labels (dashed blue line) than the sequential model (blue line), suggesting better performance for this task.
Incorporating XAI techniques, such as Occlusion matrix, LIME, Saliency map, and PDP, added further clarity to both models, allowing health care professionals to comprehend the rationale behind the conclusions made by the models. XAI enhances the interpretability of the AI systems, thus making them more transparent and trustworthy for clinicians. Such a level of explainability is crucial because it allows doctors and radiologists to use AI tools for tumor classification confidently while also making decisions about patient care.
Figure 15. Model comparison graph
Table 5 Accuracy of sequential & VGG-16 models (Brain & Lung)
|
Tumor Type |
Sequential |
VGG-16 |
|
BRAIN |
96% |
94% |
|
LUNG |
98% |
99% |
The goal of this system is to aid doctors and radiologists by providing an assistive second-opinion tool. With the use of LIME and Saliency Maps, critical regions on medical images (MRI & CT) are illuminated, which assists radiologists in confirming their diagnoses, thus minimizing the chances for oversights. The explanations provided visually bolster clinical judgment based on the analyses since they reveal portions of the images that have been processed and influence the model’s output.
This analysis demonstrates the ability of deep learning models, specifically the sequential and VGG16 architectures, to identify brain and lung tumours with a significant level of accuracy. Both models were shown to be capable of classifying tumour types and generating relevant visual results, such as heatmaps and feature activation maps. Implementing Explainable Artificial Intelligence (XAI) methods was essential for enhancing transparency in how models make decisions, allowing clinicians to understand and rely on the outcomes. This research highlights the potential of AI in medical diagnostics and underlines the importance of explainability in building confidence in AI-assisted healthcare systems. Standard practices dictate that lighter sequential models, comprising fewer parameters, train and infer more quickly. In contrast, deeper networks such as VGG16 tend to exhibit higher accuracy and better generalization, albeit at the cost of increased computational expense. The study recommends building a hybrid model that integrates the adaptability of the sequential model with the feature extraction strengths of VGG16. This approach will minimize overfitting, enhance generalization, and broaden the system's
application to various medical imaging tasks. The hybrid system will also be structured for extended use, including detection of tumors in other organs and handling other complex medical imaging challenges. Integrating XAI techniques with the hybrid model will ensure more precise and interpretable results, facilitating AI-assisted diagnoses for broader clinical use. As an initial step, validation was conducted on the model using open-access repositories. Testing feasibility, usability, and real-time interaction will be carried out within controlled environments through a web-based interface application. Following clinical trial verification, adaptations can be made for integration with DICOM standards and PACS systems. Adopting this phased strategy will help align the model with clinical workflows and enable flexible deployment in real-world environments. Although we employed XAI techniques like Saliency Maps, we recognize the need for deeper evaluation of their limitations, such as noise sensitivity. Our model is not intended to fully automate radiological diagnostics; rather, it is designed to support radiologists as a secondary screening aid. The web-based interface is intuitive and carefully designed to enhance workflow without adding to the user’s burden. In the future, we plan to gather feedback from expert clinicians regarding interpretability, usability, and the model’s impact in real-world clinical settings.
[1] Suryani, A.I., Chang, C.W., Feng, Y.F., Lin, T.K., Lin, C.W., Cheng, J.C., Chang, C.Y. (2022). Lung tumor localization and visualization in chest X-ray images using deep fusion network and class activation mapping. IEEE Access, 10: 124448-124463. https://doi.org/10.1109/ACCESS.2022.3224486
[2] Amin, M.M., Ismail, A.S., Shaheen, M.E. (2024). Multimodal non-small cell lung cancer classification using convolutional neural networks. IEEE Access, 12: 134770-134778. https://doi.org/10.1109/ACCESS.2024.3461878
[3] Chen, W., Wei, H., Peng, S., Sun, J., Qiao, X., Liu, B. (2019). HSN: Hybrid segmentation network for small cell lung cancer segmentation. IEEE Access, 7: 75591-75603. https://doi.org/10.1109/ACCESS.2019.2921434
[4] Lin, C.J., Lin, X.Q., Jhang, J.Y. (2024). Adversarial-learning-based taguchi convolutional fuzzy neural classifier for images of lung cancer. IEEE Access, 12: 72766-72776. https://doi.org/10.1109/ACCESS.2024.3403106
[5] Hamd, Z.Y., Osman, E.G., Alorainy, A.I., Alqahtani, A. F., Alshammari, N.R., Bajamal, O., Alruwaili, S.H., Almohsen, S.S., Almusallam, R.I., Khandaker, M.U. (2024). The role of machine learning in detecting primary brain tumors in Saudi pediatric patients through MRI images. Journal of Radiation Research and Applied Sciences, 17(3): 100956. https://doi.org/10.1016/j.jrras.2024.100956
[6] Majib, M.S., Rahman, M.M., Sazzad, T.S., Khan, N.I., Dey, S.K. (2021). Vgg-scnet: A vgg net-based deep learning framework for brain tumor detection on mri images. IEEE Access, 9: 116942-116952. https://doi.org/10.1109/ACCESS.2021.3105874
[7] Rasool, M., Ismail, N.A., Boulila, W., Ammar, A., Samma, H., Yafooz, W.M., Emara, A.H.M. (2022). A hybrid deep learning model for brain tumour classification. Entropy, 24(6): 799. https://doi.org/10.3390/e24060799
[8] Rasool, M., Ismail, N.A., Al-Dhaqm, A., Yafooz, W.M., Alsaeedi, A. (2022). A novel approach for classifying brain tumours combining a squeezenet model with svm and fine-tuning. Electronics, 12(1): 149. https://doi.org/10.3390/electronics12010149
[9] Moldovanu, S., Tăbăcaru, G., Barbu, M. (2024). Convolutional neural Network-Machine learning model: Hybrid model for meningioma tumour and healthy brain classification. Journal of Imaging, 10(9): 235. https://doi.org/10.3390/jimaging10090235
[10] Khan, M.S.I., Rahman, A., Debnath, T., Karim, M.R., Nasir, M.K., Band, S.S., Mosavi, A., Dehzangi, I. (2022). Accurate brain tumor detection using deep convolutional neural network. Computational and Structural Biotechnology Journal, 20: 4733-4745. https://doi.org/10.1016/j.csbj.2022.08.039
[11] Neamah, K., Mohamed, F., Adnan, M.M., Saba, T., Bahaj, S.A., Kadhim, K.A., Khan, A.R. (2023). Brain tumor classification and detection based DL models: A systematic review. IEEE Access, 12: 2517-2542. https://doi.org/10.1109/ACCESS.2023.3347545
[12] Lian, Q.L., Li, X.Y., Lu, B., Zhu, C.W., Li, J.T., Chen, J.J. (2023). Identification of lung tumors in nude mice based on the LIBS with histogram of orientation gradients and support vector machine. IEEE Access, 11: 141915-141925. https://doi.org/10.1109/ACCESS.2023.3342105
[13] Nayak, D.R., Padhy, N., Mallick, P.K., Bagal, D.K., Kumar, S. (2022). Brain tumour classification using noble deep learning approach with parametric optimization through metaheuristics approaches. Computers, 11(1): 10. https://doi.org/10.3390/computers11010010
[14] Kataria, P., Dogra, A., Gupta, M., Sharma, T., Goyal, B. (2023). Trends in DNN model based classification and segmentation of brain tumor detection. The Open Neuroimaging Journal, 16: e187444002303060. http://doi.org/10.2174/18744400-v16-e230405-2022-3
[15] Anaya-Isaza, A., Mera-Jiménez, L., Verdugo-Alejo, L., Sarasti, L. (2023). Optimizing MRI-based brain tumor classification and detection using AI: A comparative analysis of neural networks, transfer learning, data augmentation, and the cross-transformer network. European Journal of Radiology Open, 10: 100484. https://doi.org/10.1016/j.ejro.2023.100484
[16] Shanthi, S., Saradha, S., Smitha, J.A., Prasath, N., Anandakumar, H. (2022). An efficient automatic brain tumor classification using optimized hybrid deep neural network. International Journal of Intelligent Networks, 3: 188-196. https://doi.org/10.1016/j.ijin.2022.11.003
[17] Berg, C.D., Schiller, J.H., Boffetta, P., Cai, J., Connolly, C., Kerpel-Fronius, A., Kitts, A.B., Lam, D.C.L., Mohan, A., Myers, R., FRCPC, Suri, T., Tammemagi, M.C., Yang, D., Lam, S. (2023). Air pollution and lung cancer: A review by international association for the study of lung cancer early detection and screening committee. Journal of Thoracic Oncology, 18(10): 1277-1289. https://doi.org/10.1016/j.jtho.2023.05.024
[18] Chitnis, S., Hosseini, R., Xie, P. (2022). Brain tumor classification based on neural architecture search. Scientific Reports, 12(1): 19206. https://doi.org/10.1038/s41598-022-22172-6
[19] Došilović, F.K., Brčić, M., Hlupić, N. (2018). Explainable artificial intelligence: A survey. In 2018 41st International Convention on Information and Communication Technology, Electronics and Microelectronics (MIPRO), Opatija, Croatia, pp. 0210-0215. https://doi.org/10.23919/MIPRO.2018.8400040
[20] Saranya, A., Subhashini, R. (2023). A systematic review of explainable artificial intelligence models and applications: Recent developments and future trends. Decision Analytics Journal, 7: 100230. https://doi.org/10.1016/j.dajour.2023.100230
[21] Rao, S., Mehta, S., Kulkarni, S., Dalvi, H., Katre, N., Narvekar, M. (2022). A study of LIME and SHAP model explainers for autonomous disease predictions. In 2022 Ieee Bombay Section Signature Conference (IBSSC), Mumbai, India, pp. 1-6. https://doi.org/10.1109/IBSSC56953.2022.10037324
[22] Gaspar, D., Silva, P., Silva, C. (2024). Explainable AI for intrusion detection systems: LIME and SHAP applicability on multi-layer perceptron. IEEE Access, 12: 30164-30175. https://doi.org/10.1109/ACCESS.2024.3368377
[23] Mulwa, M.M., Mwangi, R.W., Mindila, A. (2024). GMM‐LIME explainable machine learning model for interpreting sensor‐based human gait. Engineering Reports, 6(10): e12864. https://doi.org/10.1002/eng2.12864
[24] Van der Velden, B.H., Kuijf, H.J., Gilhuijs, K.G., Viergever, M.A. (2022). Explainable artificial intelligence (XAI) in deep learning-based medical image analysis. Medical Image Analysis, 79: 102470. https://doi.org/10.1016/j.media.2022.102470
[25] Molnar, C., Freiesleben, T., König, G., Herbinger, J., Reisinger, T., Casalicchio, G., Wright, M.N., Bischl, B. (2023). Relating the partial dependence plot and permutation feature importance to the data generating process. In World Conference on Explainable Artificial Intelligence. Cham: Springer Nature Switzerland, Springer, Cham, pp. 456-479. https://doi.org/10.1007/978-3-031-44064-9_24
[26] Wong, C.Y.T., Antaki, F., Woodward-Court, P., Ong, A.Y., Keane, P.A. (2024). The role of saliency maps in enhancing ophthalmologists’ trust in artificial intelligence models. Asia-Pacific Journal of Ophthalmology, 13(4): 100087. https://doi.org/10.1016/j.apjo.2024.100087
[27] Bakouny, Z., Paciotti, M., Schmidt, A.L., Lipsitz, S.R., Choueiri, T.K., Trinh, Q.D. (2021). Cancer screening tests and cancer diagnoses during the COVID-19 pandemic. JAMA Oncology, 7(3): 458-460. https://doi.org/10.1001/jamaoncol.2020.7600
[28] de Koning, H.J., van Der Aalst, C.M., de Jong, P.A., Scholten, E.T., et al. (2020). Reduced lung-cancer mortality with volume CT screening in a randomized trial. New England Journal of Medicine, 382(6): 503-513. https://doi.org/10.1056/NEJMoa1911793
[29] Alqudah, A.M., Alquraan, H., Qasmieh, I.A., Alqudah, A., Al-Sharu, W. (2020). Brain tumor classification using deep learning technique--A comparison between cropped, uncropped, and segmented lesion images with different sizes. arXiv Preprint arXiv: 2001.08844. https://doi.org/10.48550/arXiv.2001.08844
[30] Yahyatabar, M., Jouvet, P., Cheriet, F. (2020). Dense-Unet: A light model for lung fields segmentation in Chest X-ray images. In 2020 42nd Annual International Conference of the IEEE Engineering in Medicine & Biology Society (EMBC), Montreal, QC, Canada, pp. 1242-1245. https://doi.org/10.1109/EMBC44109.2020.9176033